


EXECUTIVE SUMMARY & PROPRIETARY RISK DASHBOARD
As we head into the trading week of September 14–18, 2026, global financial markets are caught in an aggressive, late-cycle multi-asset vice. The macro regime is characterized by an acute collision between unprecedented fiscal expansion, a hawkish central bank repricing wave, and an energy complex enduring severe structural chokepoint dislocations.
========================================================================================
                      CROSS-ASSET REGIME BENCHMARK (SEP 12–18, 2026)
========================================================================================
Asset / Indicator       Spot / Active Level       Implied Pricing / Desk Assessment
----------------------------------------------------------------------------------------
VIX Index               22.0 – 28.0               Regime: Elevated (Rule 4.6 Haircut: 25-50%)
U.S. 10Y Treasury Yield 4.30% – 4.80%             Bearish duration; retesting 2007 highs
U.S. 2s10s Yield Curve  -45 bps to -55 bps        Deep inversion; stagflation warning
U.S. 10s30s NOB Spread  +30 bps                   Bear steepener dominant in back-end
Terminal Fed Funds      5.75% Implied             Sep 18 FOMC: 90% probability of 25-50 bps hike
ICE Brent Crude (Dec26) $95.00 – $98.00/bbl       Steep backwardation (Dec26/Dec27: -$12/bbl)
Baltic TD3C Freight     $650,000 – $800,000/day   Historic high; Strait of Hormuz paralyzed
COMEX Gold (Dec26)      $2,450 – $2,550/oz        Record highs; backwardation (-$10 to -$20/oz)
Gold/Silver Ratio       79:1 to 86:1              Industrial lag vs safe-haven premium
USD Index (DXY / DX)    106.50 – 107.00           Hawkish rate premium overriding debt drag
ETH/BTC Flow Ratio      +$216M ETH / -$13M BTC    Structural institutional ETF divergence
========================================================================================
The Three Thematic Pillars for the Week Ahead
The Fiscal-Monetary Impasse & The Death of Duration: With the U.S. 2026 budget deficit officially hitting $1.97 trillion—carrying an annualized debt service cost of $1.4 trillion—the sovereign debt complex has reached a point of technical exhaustion. Rather than triggering an immediate flight-to-safety rally in Treasuries, the combination of hot August/September CPI prints and a surge in energy costs has locked the Federal Reserve into a forced hawkish posture ahead of the September 18 FOMC meeting. Money markets have aggressively priced a 90% probability of a 25 bps hike, with growing odds of a 50 bps move, pushing the implied terminal rate in Eurodollar (GE Dec26 at 94.25) and SOFR contracts to 5.75%. This is triggering global sovereign debt contagion, as seen in the Reserve Bank of India’s (RBI) auction rejection following 10-year Indian yields crossing 7.00%, and the UK Gilt rout driving 10-year yields to 4.90%.
The Geopolitical Energy Bottleneck: Physical crude markets have severed ties with speculative equity sentiment. The combined shock of the Strait of Hormuz commercial blockage (active since March 2026), the unexpected shutdown of Saudi Arabia’s East-West pipeline (3–4M bpd capacity), and the IEA’s revised supply forecast (-5.7M bpd, a 6% global decline) has thrown ICE Brent and regional Middle Eastern grades (DME Oman, ICE Dubai) into super-backwardation. Front-month Brent premiums exceed +$5/bbl, while the Brent Dec26/Dec27 calendar spread has widened to -$12/bbl. Downstream, refining utilization at 98% has triggered a diesel crisis (> $6/gallon), supertanker freight rates (Baltic TD3C) have reached $800,000/day, and crack spreads are trading at historic records. Headline-driven “Hormuz diplomacy talks” provide short-lived pullbacks that institutional order flow continues to buy.
The Institutional Flow Decoupling (Crypto, Metals, and Ags): Cross-asset flows show a capital rotation out of traditional retail-correlated assets and into scarce, physically constrained, or cash-generative institutional instruments:
In digital assets, an extraordinary rotation has developed: Bitcoin ETFs logged $13 million in daily net outflows, while Ethereum ETFs absorbed $216 million in a single session, compounded by Bitmine taking 5.93 million ETH out of circulating float.
In metals, Gold (COMEX Dec26) trades at all-time highs of $2,550/oz in backwardation, completely defying the textbook negative correlation with rising real yields (Rule 14.5/14.6 override) as sovereign debt sustainability comes into question.
In agriculture, ahead of the USDA crop report, the Soybean/Corn ratio has blown out to +$9.70/bu, driven by South American droughts and robust physical demand.
Volatility Regime & Mandated Position Sizing (Rule 4.6)
Across the desk, risk management parameters are strictly governed by Rule 4.6. With the CBOE Volatility Index (VIX) oscillating between 22.0 and 28.0, the portfolio is operating under an enforced 25% to 50% reduction in gross directional notional exposure.
                                  RULE 4.6 SIZING MATRIX
 ┌──────────────────────┬───────────────────────────────┬──────────────────────────────────┐
 │ VIX Metric           │ Portfolio Mandate             │ Derivative Structuring Action    │
 ├──────────────────────┼───────────────────────────────┼──────────────────────────────────┤
 │ VIX < 15             │ 100% Gross Notional           │ Outright directional futures     │
 │ VIX 15 – 25          │ 25% Sizing Cut (75% Notional) │ Debit vertical call/put spreads  │
 │ VIX 25 – 35 (CURRENT)│ 50% Sizing Cut (50% Notional) │ Defined-risk spreads / Collars   │
 │ VIX > 35             │ 75% Sizing Cut (25% Notional) │ Pure long volatility / Tail puts │
 └──────────────────────┴───────────────────────────────┴──────────────────────────────────┘
Because implied volatilities in energy (Brent Dec26 ATM IV at 58%) and foreign exchange (USD/JPY 1M IV at 12%) are historically elevated while rate volatility continues to widen, unhedged naked option selling is strictly prohibited. All directional strategies outlined for the week of September 14–18 utilize defined-risk vertical spreads, butterflies, calendar basis structures, or delta-hedged risk reversals.
PART I: SOVEREIGN DEBT & FIXED INCOME
The Fiscal Impasse: U.S. Debt Dynamics & Contagion
The structural driver of the global bond market sell-off is the math behind U.S. Treasury issuance. The $1.97 trillion deficit run through the third quarter of 2026, paired with an annualized $1.4 trillion interest expense bill, has saturated primary dealer absorption capacity. With the September 18 FOMC meeting approaching, the Fed cannot intervene with quantitative easing without accelerating inflation.
The market has priced out the dovish pivot:
Eurodollar Futures (GE Dec26): Trading at 94.25, reflecting an implied front-end rate of 5.75%. Institutional accounts have maintained heavy short positioning across the Dec26–Mar27 strip, pricing approximately 50 bps of incremental rate hikes before the end of the year.
Three-Month SOFR Futures (SR3 Dec26): Consolidated at 94.75 (implied rate 5.25%), up from 94.50 pre-CPI, demonstrating hawkish repricing.
The Fed Funds Strip (FFZ6): The December 2026 contract is firmly priced between 5.25% and 5.50%, up from 5.00% thirty days ago, with institutional flow buying the FFZ6 95.00 calls to hedge the tail risk of an aggressive policy overshoot.
       SOFR & EURODOLLAR TERMINAL HAWKISH REPRICING (DEC 2026 STRIP)
 5.85% ───────────────────────────────────────────────────────────┐
 5.75% ──────────────────────────────[GE Dec26 Implied Rate: 5.75%]
 5.65% ──────────────[SOFR Dec26 Spot: 5.65%]                     │
 5.50% ───────────────────────────────────────────────────────────┤
 5.25% ─[SR3 Dec26 Implied: 5.25%]                                │
 5.00% ───────────────────────────────────────────────────────────┘
       Jun 2026                Aug 2026                 Sep 2026
Yield Curve Mechanics: The 2s10s vs. 10s30s Divergence (Rules 20.1, 20.2, 20.8)
The yield curve presents a pronounced divergence between front-end inversion and long-end duration rejection:
The 2s10s Inversion (-45 bps to -55 bps): Deep inversion reflects classic late-cycle stagflation dynamics under Rule 20.1. High short-term policy rates choke real economic activity, while sticky inflation prevents the long end from rallying.
The 10s30s Steepening (+30 bps): The long end of the curve has begun a structural bear-steepening process. The 30-year yield breaking toward 5.10% alongside the 10-year yield breaching 4.80% (a level not seen since 2007) signals that bond investors are demanding a higher term premium to absorb the sheer volume of U.S. debt issuance.
Institutional traders are exploiting this via the NOB Spread (Notes Over Bonds): long 30-Year Ultra Bond (UB Dec26) futures against short Ultra 10-Year (TN Dec26) futures. This structure isolates the back-end curve steepener while neutralizing broader interest rate delta.
                    YIELD CURVE DISLOCATION (2s10s vs 10s30s)
  Yield
   (%)
  5.20% │               [2Y: 4.85%]                             [30Y: 5.10%]
  5.00% │                   ▲                                         ▲
  4.80% │                   │               [10Y: 4.80%]              │
  4.60% │                   │                     ▲                   │
  4.40% │                   │                     │                   │
  4.20% └───┬───────────────┴─────────────────────┴───────────────────┴──
           Cash            2-Year               10-Year             30-Year
             ◄── 2s10s: -45 to -55 bps ────────►
                                                 ◄── 10s30s: +30 bps ─►
Global Sovereign Spillover: Eurex, ICE, and NSE
The bond market rout is not confined to the CME:
United Kingdom (ICE Gilts / FGBL Spread): UK July GDP growth (+0.4%) alongside stubborn services inflation has forced SONIA futures to price four additional BoE rate hikes by December 2026. 10-year Gilt yields have surged to 4.90% (a post-2008 high). The Gilt-Bund spread has blown out to +120 bps as German 10Y Bunds hold at 2.70%. Institutional flow is aggressively shorting Dec26 Gilts (G Dec26) while long Bunds (FGBL Dec26) to trade policy divergence.
Eurozone (Eurex BTP/Bund Spread): Italian 10-year yields have pushed to 4.80%, widening the sovereign peripheral spread against Germany to 210 bps. With Dec26 EURIBOR futures (ER Dec26) discounting a terminal deposit rate of 4.25%, the ECB’s hawkish stance is weighing on peripheral European debt.
India (NSE: 10YRGOVT): Demonstrating the global reach of the U.S. debt crisis, Indian benchmark 10-year yields have decisively crossed 7.00%. The Reserve Bank of India (RBI) responded by trimming acceptance bids at primary sovereign auctions—a historic signal that emerging market central banks will reject high yields dictated by global dollar liquidity conditions.
========================================================================================
            PRIMARY FIXED INCOME & INTEREST RATE DESK ORDERS (WEEK AHEAD)
========================================================================================
Trade Identifier: RATES-DIR-01
Instrument: CME Ultra 10-Year Treasury Futures (TNZ6)
Direction: SHORT (Size adjusted -50% per Rule 4.6)
Target / Invalidation: Target 100-16 / Stop Loss 104-24
Option Overlay: Purchase TN Dec26 105/100 Put Spreads (Debit: 1-12/64ths)
Desk Thesis: Repricing of 10Y yields past 4.80% toward 5.05% ahead of Sep 18 FOMC.

Trade Identifier: RATES-RV-02
Instrument: CME NOB Curve Spread (Short TNZ6 / Long UBZ6)
Direction: Bear Steepener (Long Duration on 30Y relative to 10Y)
Target / Invalidation: Target +52 bps / Stop Loss +18 bps
Desk Thesis: Sovereign debt supply indigestion forcing 10s30s steepening to historic wide.

Trade Identifier: RATES-GLBL-03
Instrument: ICE Long Gilt (GZ6) vs Eurex Bund (FGBLZ6) Spread
Direction: Short Gilt / Long Bund
Target / Invalidation: Spread widening to +145 bps / Stop at +105 bps
Option Overlay: Purchase G Dec26 100/95 Put Spreads
Desk Thesis: BoE forced into 4 additional hikes by year-end; UK stagflation vs EU stagnation.
========================================================================================
PART II: THE ENERGY COMPLEX
Physical Supply Shocks & The Geopolitical Risk Premium
The energy complex is experiencing a historic physical supply disconnect. Macro market participants focusing solely on transient “Hormuz diplomacy” headlines (Rule 13.11) are missing massive structural disruptions across the Middle East and the Atlantic Basin.
       GLOBAL CRUDE SUPPLY & REFINING DISLOCATION (SEP 2026)
 ┌────────────────────────────────────────────────────────────────────────┐
 │ CHOKEPOINT 1: Strait of Hormuz Blockage (Active since March 2026)     │
 │ ── Asian refiners cut off from 14M bpd of Persian Gulf flow            │
 ├────────────────────────────────────────────────────────────────────────┤
 │ CHOKEPOINT 2: Saudi East-West Pipeline Shut down (3.0–4.0M bpd offline)│
 │ ── Houthi infrastructure strikes disable Yanbu Red Sea bypass terminal │
 ├────────────────────────────────────────────────────────────────────────┤
 │ STRUCTURAL DEFICIT: IEA 2026 World Supply Revision: -5.7M bpd (-6.0%)  │
 │ ── Global recovery delayed until at least mid-2027                     │
 ├────────────────────────────────────────────────────────────────────────┤
 │ DOWNSTREAM WALL: U.S. Refining Capacity at 98.0% (Crude Run Cap)       │
 │ ── Domestic diesel inventories at 5-year lows; crack spreads at $45/bbl│
 └────────────────────────────────────────────────────────────────────────┘
The compounding impacts of the Hormuz blockade, the Saudi East-West pipeline outage, and tanker seizures by Iranian naval forces (operating with Chinese intelligence sharing) have removed roughly 8 million barrels per day of normal flow from physical routes. The IEA’s downward revision of global supply by 5.7M bpd (-6%) confirms that substitute capacity cannot resolve this deficit before 2027.
Benchmarks in Backwardation: Brent, WTI, Oman, and INE
The derivatives structure across major global crude contracts reflects extreme prompt physical scarcity:
ICE Brent Crude (Dec26): Brent Dec26 is trading at a sustained +$8.00 to +$10.00/bbl premium over CME WTI, the widest arbitrage spread since the 2022 Russian invasion. The front-month backwardation is running at >$5.00/bbl, while the Brent Dec26/Dec27 calendar spread sits at -$12.00/bbl. Commodity Trading Advisors (CTAs) and macro hedge funds are running aggressive steepener rolls (buying the prompt month, selling 12-month deferred).
DME Oman / ICE Dubai: Middle Eastern crudes delivered outside the Persian Gulf are seeing unprecedented demand. Oman Dec26 futures are trading at a +$15.00/bbl premium over Brent, with institutional block trades (>1,000 lots) regularly crossing the DME as Chinese, Indian, and Japanese refiners bypass Hormuz.
Shanghai INE Crude (SC): Chinese state-owned refiners (Sinopec, PetroChina) are buying Dec26 SC futures to secure supply amid persistent Renminbi weakness (USD/CNH > 7.30). The SC vs Brent basis trade has widened to -$8.00/bbl, compared to historical norms of -$2.00 to -$4.00/bbl.
CME WTI Crude (Dec26): WTI remains discounted relative to global seaborne barrels due to infrastructure bottlenecks. Although the U.S. rig count rose by +1 to 450, inventories at the Cushing, Oklahoma delivery hub have plummeted to 3-year lows. With refiners operating at 98% utilization, physical crude cannot be converted into finished products quickly enough to clear the inland surplus.
       BRENT vs. WTI FORWARD TERM STRUCTURE (BACKWARDATION PROFILE)
 $/bbl
  $98 ───[Prompt Brent Dec26: $96.50]
  $94 ───
  $90 ───                [Prompt WTI Dec26: $88.50]
  $86 ───                                     [Deferred Brent Dec27: $84.50]
  $82 ───
  $78 ───                                     [Deferred WTI Dec27: $78.00]
         Prompt (Dec26)                                Deferred (Dec27)
The Refining & Freight Bottleneck: Diesel Crisis, RBOB Cracks, and Supertankers
The crude supply shock is magnified by a severe downstream refining crisis:
U.S. Refineries at 98% Nameplate Capacity: Domestic refiners cannot process additional crude. As a result, on-highway diesel prices have broken past $6.00/gallon, prompting the White House to evaluate invoking the Defense Production Act to expand refinery throughput.
Crack Spreads: The RBOB Gasoline-WTI crack spread has surged to $45.00/bbl (vs $25.00/bbl six months ago). In Europe, Northwest European gasoline margins surged +$16.92/bbl to fresh record highs.
Supertanker Freight Rates (Baltic TD3C): Very Large Crude Carrier (VLCC) freight pricing on the benchmark Middle East-to-China route (TD3C) has spiked to $800,000/day. While prompt day rates hold at these peaks, the TD3C Dec26 futures contract trades in contango at $650,000/day, driving institutional players to lock in deferred freight hedges.
Natural Gas & Power Derivatives: TTF, JKM, and Battery Arbitrage
European TTF Gas (ICE TTF): Dutch Title Transfer Facility (TTF) futures registered their biggest weekly gain since July. Prompt contracts (Oct26, Jan27) are pricing in winter storage depletion and threats to Qatari LNG supply. Clean spark spreads (gas-to-power) are widening rapidly across Germany and the UK.
CME PJM & ERCOT Power Futures: Tesla’s deployment of the world’s largest grid-scale Megapack installation at the xAI Memphis data center site has created a new derivatives market dynamic. Institutional capital is trading the Day-Ahead (DA) vs Real-Time (RT) spread in PJM and ERCOT, as large-scale battery storage dampens afternoon peak volatility but drives up base-load overnight power demand.
========================================================================================
                 PRIMARY ENERGY COMPLEX DESK ORDERS (WEEK AHEAD)
========================================================================================
Trade Identifier: ENERGY-DIR-01
Instrument: ICE Brent Crude Futures (COZ6)
Direction: LONG (Sized at 50% notional per Rule 4.6)
Target / Invalidation: Target $118.00/bbl / Stop Loss $91.50/bbl
Option Overlay: Brent Dec26 $120/$140 Call Spreads (IV: 58%)
Desk Thesis: Unresolved Hormuz disruption and pipeline shutdown will drive Brent backwardation to extreme levels.

Trade Identifier: ENERGY-ARB-02
Instrument: NYMEX RBOB Gasoline (RBZ6) vs CME WTI (CLZ6) Crack Spread
Direction: LONG RBOB / SHORT WTI (1:1 Ratio)
Target / Invalidation: Target $54.00/bbl crack / Stop Loss $38.50/bbl crack
Desk Thesis: U.S. refinery utilization capped at 98%; downstream shortages widening margins.

Trade Identifier: ENERGY-OPT-03
Instrument: ICE European TTF Natural Gas (Jan27 Contract)
Direction: LONG Jan27 40/50 Call Spreads
Target / Invalidation: Target €48.50/MWh / Stop at €31.00/MWh
Desk Thesis: Winter supply risk and LNG transit interruptions driving storage concerns.
========================================================================================
PART III: DIGITAL ASSETS & TOKENIZED DERIVATIVES
The Institutional Flow Decoupling: BTC Outflows vs. ETH Accumulation
A major derivatives development on institutional desks is the rapid decoupling between Bitcoin (BTC) and Ethereum (ETH).
Historically, these two benchmark digital assets exhibited a 30-day rolling correlation coefficient (ρ\rhoρ) well in excess of +0.85. Over the past week, however, ETF flow dynamics have triggered a structural rotation:
Bitcoin ETF Outflows (-$13 Million): Institutional allocators have trimmed spot BTC ETF holdings, taking profits as BTC tests the $81,700 technical resistance wall. This has triggered short-term unwinds in CME BTC Dec26 futures and increased demand for protective Dec26 $50,000 and $45,000 puts.
Ethereum ETF Inflows (+$216 Million): Concurrently, institutional accounts poured $216 million into spot ETH ETFs in a single trading session. CME ETH Dec26 futures responded by breaking through technical resistance at $2,600, trapping legacy short positions.
           INSTITUTIONAL ETF FLOW DIVERGENCE (SINGLE-DAY)
 ┌────────────────────────────────────────────────────────────────────────┐
 │ CME Bitcoin ETF Net Flow: -$13,000,000 (Profit-taking / Put Hedging)   │
 ├────────────────────────────────────────────────────────────────────────┤
 │ CME Ethereum ETF Net Flow: +$216,000,000 (Accumulation / Call Spreads) │
 └────────────────────────────────────────────────────────────────────────┘
          ETH/BTC Cross Decoupling (Long ETH Dec26 / Short BTC Dec26)
The Bitmine Supply Shock & Contango Expansion
This institutional rotation is amplified by physical circulating supply dynamics. Bitmine recently locked 5.93 million ETH in long-term staking and infrastructure validation contracts.
By removing approximately 5% of the liquid supply from active circulation, this transaction has tightened the spot-futures basis and pushed CME ETH calendar spreads into expanding contango:
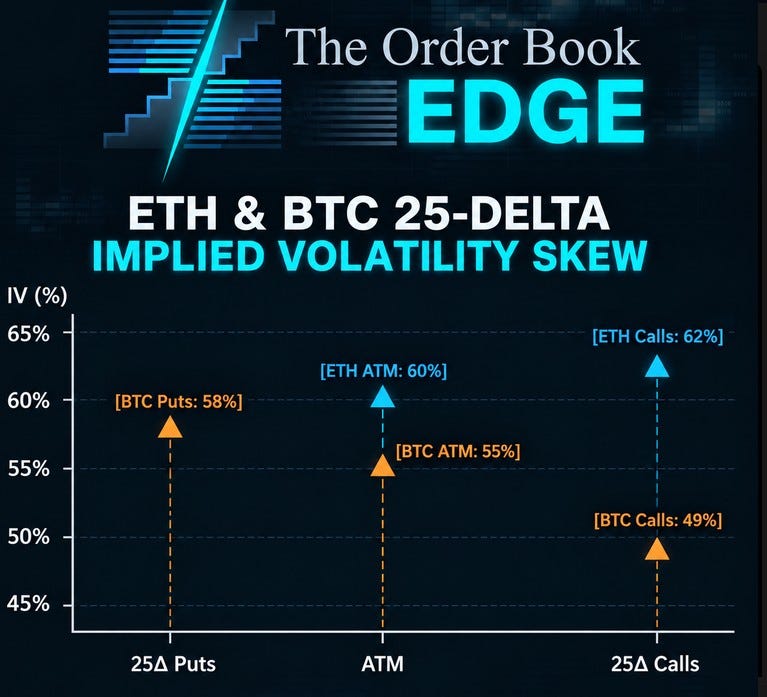
Implied Volatility Dynamics: ETH 1-month implied volatility (IV) on Deribit and CME options has surged to 60%, compared to 55% for BTC.
Option Skew: The 25-delta ETH call skew is trading at its highest premium over puts since early 2024, reflecting demand for out-of-the-money upside calls (Dec26 $3,000 and $3,500 strikes). Conversely, the BTC 25-delta skew has steepened toward puts, as funds use CME Dec26 $45,000 puts to protect balance sheets against potential broader market drawdowns.
                 ETH & BTC 25-DELTA IMPLIED VOLATILITY SKEW
 IV (%)
  65% │                                                [ETH Calls: 62%]
  60% │                     [ETH ATM: 60%]                    ▲
  55% │   [BTC Puts: 58%]          ▲                          │
  50% │          ▲                 │                   [BTC Calls: 49%]
  45% │          │          [BTC ATM: 55%]
      └───┬──────┴─────────────────┴──────────────────────────┴──
       25Δ Puts                   ATM                      25Δ Calls
Tokenized Real-World Assets ($346B) & CME Basis Arbitrage
The market capitalization of Tokenized Real-World Assets (RWAs) has reached $346 billion, spanning 47 discrete asset classes. This expansion has created new arbitrage channels linking on-chain decentralized finance with traditional CME futures contracts:
Tokenized U.S. Treasuries (Ondo, MakerDAO): Institutional liquidity providers are buying tokenized high-yielding short-term Treasury instruments while simultaneously selling CME Ultra 10-Year (TN) or Ultra T-Bond (UB) futures. This captures the basis spread between short-term yields (~5.25%) and duration-heavy futures, exploiting on-chain yield differentials.
Commodity-Backed Digital Tokens: Physical gold and crude oil tokens are driving hedging flows directly into COMEX Gold (GC Dec26) and NYMEX WTI (CL Dec26) contracts, as token issuers establish balance sheet delta hedges under the rules of the Basel III framework.
========================================================================================
             PRIMARY CRYPTO & TOKENIZED DERIVATIVES DESK ORDERS
========================================================================================
Trade Identifier: CRYPTO-REL-01
Instrument: CME Ether Futures (METZ6 / ETHZ6) vs CME Bitcoin Futures (MBTZ6 / BTCZ6)
Direction: LONG ETH / SHORT BTC (Market Neutral Beta Spread)
Target: Ratio expansion to 0.042 BTC/ETH / Invalidation: Ratio drop below 0.0305
Desk Thesis: Capitalize on $216M ETH inflows vs $13M BTC outflows; 5.93M ETH lockup.

Trade Identifier: CRYPTO-OPT-02
Instrument: CME ETH Dec 2026 Options-on-Futures
Direction: Purchase ETH Dec26 $3,000 / $3,500 Call Spreads
Cost: ~$140 net premium / Target Payout: $500 max payout
Desk Thesis: Structural supply squeeze and institutional accumulation driving delta toward $3,500.
========================================================================================
PART IV: METALS & AGRICULTURAL COMMODITIES
Gold: The Safe-Haven Override of High Real Rates (Rule 14.4)
One of the cleanest cross-asset market signals is the price action in COMEX Gold (GC Dec26). Under classic macroeconomic conditions (Rule 14.5), a strengthening U.S. Dollar (DXY at 107.00) paired with rising 10-year real Treasury yields should push gold prices down. Instead, gold has pushed to all-time highs of $2,550/oz.
                THE GOLD REAL-YIELD BREAKOUT ANOMALY
 Gold ($/oz)                                                10Y Real Yield
  $2,600 │                                                   │ 2.40%
  $2,500 │                       [GC Dec26: $2,550/oz]       │ 2.20%  ▲
  $2,400 │                               ▲                   │ 2.00%  │
  $2,300 │               ▲               │                   │ 1.80%  │
  $2,200 │               │               │                   │ 1.60%  │
         └───┬───────────┴───────────────┴───────────────────┴──
           Jan 2026                    Jun 2026            Sep 2026
           ─── Gold Spot Price   - - - 10Y Real Yield (Inverted Axis)
Institutional positioning reveals several underlying dynamics:
The “Failed Treasury Intervention” Narrative: Sovereign and institutional accounts are accumulating physical metal and buying COMEX Dec26 $2,600/$2,700 call spreads as a hedge against sovereign balance sheet expansion. With the U.S. national debt growing by trillions in unhedged liabilities, gold is functioning as a reserve asset of last resort.
Physical Backwardation: Prompt COMEX delivery contracts trade at a -$10 to -$20/oz backwardation relative to deferred 2027 contracts, pointing to tight physical vaults and strong sovereign reserve buying (notably from China and the Middle East).
Japanese Retail and Institutional Buying (TOCOM): In Tokyo, TOCOM Gold futures are surging as the Yen approaches the 160.00 intervention line against the USD, driving Japanese investors to convert fiat cash into physical gold bullion.
The Silver Disconnect & Industrial Drag (Rule 14.1)
While Gold trades at all-time highs, COMEX Silver (SI Dec26) remains subdued, consolidating around $28.50 to $32.00/oz.
This disconnect has driven the Gold/Silver ratio to between 79:1 and 86:1, near historically wide extremes:
Industrial Drag: Silver demand is caught between long-term clean-tech demand (photovoltaic solar panels, EV charging systems) and near-term industrial weakness stemming from Chinese manufacturing data and U.S. grid-battery export restrictions.
Relative Value Play: Institutional desks are capitalizing on this dislocation through ratio trades (Long Gold / Short Silver), using silver short contracts to fund long gold gamma positions.
       GOLD/SILVER RATIO DIVERGENCE (HISTORIC VALUATION STRETCH)
  Ratio
   90:1 ───────────────────────────────────────────────────────────┐
   86:1 ───────────────────────────────────[Current Ratio: 86.0x]  │
   80:1 ──────────────────────[Mean Resistance Band: 79.0x]        │
   70:1 ───────────────────────────────────────────────────────────┤
   60:1 ─[50-Year Historical Average: 60.0x]                       │
   50:1 ───────────────────────────────────────────────────────────┘
        2023                 2024                 2025        Sep 2026
Agricultural Futures: Pre-USDA Report Squeeze (Rule 13.5)
In softs and grains, market positioning is centered around the September USDA Crop Production and WASDE reports:
CBOT Soybeans (ZS Dec26): Soybeans have surged to $14.50/bushel (up 12% over three months). Severe drought conditions across key growing zones in Brazil and Argentina, paired with an acceleration in Chinese import commitments, have pushed the physical cash market into a +$0.50/bushel contango basis. Institutional positioning is long, utilizing ZSZ6 $15.00/$16.00 call spreads.
CBOT Corn (ZC Dec26): Conversely, Corn trades at a depressed $4.80/bushel, down 8% on expectations of higher export flows out of the Black Sea and strong Midwest early-harvest progress.
The Soybean-Corn Ratio Spread: The price spread between soybeans and corn has expanded to +$9.70/bushel, approaching historic highs. Desks are trading this via calendar spread expansions (buying ZSX6 while shorting ZCZ6) ahead of final acreage revisions from the USDA.
========================================================================================
             PRIMARY METALS & AGRICULTURAL COMMODITY DESK ORDERS
========================================================================================
Trade Identifier: METALS-DIR-01
Instrument: COMEX Gold Futures Options (OGZ6)
Direction: Purchase Dec 2026 $2,600 / $2,700 Call Spreads
Debit: $18.50/oz / Target: $65.00/oz
Desk Thesis: Sovereign debt expansion and physical backwardation pushing gold past $2,600.

Trade Identifier: AGRI-REL-02
Instrument: CBOT Soybean Dec26 (ZSZ6) vs CBOT Corn Dec26 (ZCZ6)
Direction: LONG Soybeans / SHORT Corn (Ratio Spread)
Target: Spread widening to +$10.50/bu / Invalidation: Narrowing below +$8.80/bu
Desk Thesis: Southern Hemisphere drought vs U.S. corn yield expansion prior to USDA report.
========================================================================================
PART V: FOREIGN EXCHANGE & CROSS-CURRENCY DYNAMICS
The Dollar Index (DXY) Hawkish Squeeze (Rule 14.5)
The U.S. Dollar Index (ICE: DX Dec26) has rallied back to 106.50 – 107.00. This move reflects a simple cross-currency reality: while the U.S. fiscal trajectory is challenging over the long term, U.S. short-term interest rates (SOFR at 5.65%) remain the highest in the developed world.
Under Rule 14.5, global capital continues to be drawn into the USD carry trade, pulling liquidity out of lower-yielding currencies and vulnerable emerging markets.
                  THE GLOBAL INTEREST RATE CARRY COMPLEX
 Currency/Rate           Policy / Short Rate      Desk Bias vs. U.S. Dollar (DX)
 --------------------------------------------------------------------------------
 USD (SOFR / Fed Funds)  5.65% – 5.75%            BENCHMARK BASE CURRENCY (LONG)
 EUR (EURIBOR Deposit)   3.75% – 4.25%            Bearish (ECB trailing Fed hikes)
 GBP (BoE Official Rate) 4.75% – 5.25%            Neutral/Bearish (Stagflation drag)
 JPY (BoJ Policy Target) 0.25% – 0.50%            Tactical Long via Volatility/Tail
 CNH (PBOC Reverse Repo) 1.70% – 2.00%            Bearish (Managed Yuan depreciation)
 --------------------------------------------------------------------------------
The Japanese Yen: The 160.00 Intervention Line
The Japanese Yen (CME 6J Dec26) is trading at 0.00630 (USD/JPY 158.70). The pair is testing the critical 160.00 level, where the Japanese Ministry of Finance previously conducted direct market interventions.
Bank of Japan Policy Dilemma: While the BoJ has signaled an intent to gradually lift its benchmark rate, the wide interest rate gap against U.S. rates (~525 bps) makes the Yen an attractive funding currency for carry trades.
Derivatives Positioning: 1-month implied volatility in USD/JPY options has jumped to 12.0%. Rather than fighting the trend with outright long Yen futures, institutional traders are using Seagull Spreads: buying the 155.00 put, selling the 150.00 put, and financing the trade by selling the 165.00 call. This structure protects against sudden central bank intervention while managing decay costs if USD/JPY grinds higher.
       USD/JPY INTERVENTION THRESHOLD (160.00 PIN RISK)
 Spot
  162.00 ───────────────────────────────────────────────────────────┐
  160.00 ────────[MINISTRY OF FINANCE RED-LINE INTERVENTION]────────┤
  158.50 ──────────────────────────────[Spot USD/JPY: 158.70]       │
  155.00 ───────────────────────────────────────────────────────────┤
  152.00 ───────────────────────────────────────────────────────────┤
  150.00 ───────────────────────────────────────────────────────────┘
         Jun 2026               Jul 2026              Sep 2026
European & Emerging Market FX Vulnerabilities
Euro (CME: 6EZ6): Trading at 1.0750, the Euro is weighed down by sluggish German industrial production and high imported energy costs (driven by TTF gas spikes). Institutional desk flow is shorting EUR/USD rallies via Dec26 1.0500 puts, positioning for potential parity tests if Middle East energy disruptions worsen.
Chinese Yuan (CME: 6CZ6 / USD-CNH): The PBOC has gradually raised its daily USD/CNY midpoint fix, allowing the offshore Yuan to drift toward 7.30. Institutional accounts are holding Dec26 7.30/7.40 call spreads on USD/CNH to position for controlled depreciation designed to support export volumes.
Indian Rupee (NSE: USDINR) & Mexican Peso (CME: 6MZ6): In emerging markets, the Rupee faces capital outflow pressure following yield spikes in domestic debt, while the Mexican Peso is navigating renewed volatility after the government reduced sovereign credit subsidies to state oil company Pemex.
PART VI: EQUITY INDEX FUTURES & DERIVATIVES VOLATILITY
Index Divergence: Stretched Valuations vs. The Rate Wall (Rules 14.3, 20.1)
In equity index futures, institutional positioning reflects caution. The benchmark S&P 500 (CME: ES Dec26) and Nasdaq-100 (CME: NQ Dec26) contracts are contending with a challenging macroeconomic backdrop: when risk-free cash yields 5.65% and 10-year Treasury yields test 4.80%, equity risk premia are compressed to multi-decade lows.
             EQUITY RISK PREMIUM COMPRESSION (ES vs 10Y UST)
 Multiples / Yields
  5.50% │                                                 [10Y UST: 4.80%]
  5.00% │                                                        ▲
  4.50% │                 [S&P 500 Earnings Yield: 4.40%]        │
  4.00% │                               ▲                        │
  3.50% │                               │                        │
  3.00% └───┬───────────────────────────┴────────────────────────┴──
           2023                        2024                    Sep 2026
           ─── S&P 500 Forward Earnings Yield   - - - 10Y US Treasury Yield
Institutional positioning across index derivatives reveals distinct regional and sector trends:
S&P 500 Futures (ES Dec26): Large institutional desks are expanding hedge books, buying Dec26 5,200/5,000 put spreads and selling 5,500 calls to establish zero-cost protective collars. The calendar basis spread (ES Dec26 vs Mar27) is steepening, reflecting growing institutional concern over earnings durability into early 2027.
Nasdaq-100 Futures (NQ Dec26): U.S.-China technology tensions have escalated following the snubbing of a U.S. diplomatic delegation by top Chinese AI firms in response to tighter semiconductor sanctions. Concurrently, news of a $5 billion Pentagon loan for domestic AI defense systems is redirecting tech flows into specialized aerospace and defense contractors rather than mega-cap consumer tech. CME Copper (HG Dec26) is also being shorted against tech weakness, as global AI hardware supply chain delays threaten to slow industrial copper demand.
Russell 2000 Futures (RTY Dec26): Small-cap equities remain the most vulnerable segment in the equity market. With roughly 40% of Russell 2000 debt tied to floating-rate credit lines, the SOFR repricing to 5.75% poses a direct threat to corporate balance sheets. Net institutional short exposure in RTY has expanded, concentrated in Dec26 2,000 puts.
Volatility Mechanics: The CBOE VIX Complex
The CBOE Volatility Index (VIX) is fluctuating between 22.0 and 28.0, reflecting an elevated-risk environment under Rule 4.6.
                 CBOE VIX FUTURES FORWARD CURVE DYNAMICS
 Vol Points
   30.0 │                                             [VIX Dec26: 27.50]
   28.0 │                                                      ▲
   26.0 │                       [VIX Oct26: 25.10]             │
   24.0 │                               ▲                      │
   22.0 │       [Spot VIX: 22.80]       │                      │
   20.0 │               ▲               │                      │
        └───┬───────────┴───────────────┴──────────────────────┴──
          Spot               Front-Month (Oct)              Deferred (Dec)
          ─── Classic Upward Sloping Contango / Tail Risk Premium Built In
The forward VIX curve remains in contango (Oct26 < Dec26), but the slope is flattening as institutional desks purchase tail hedges against geopolitical escalation.
Rather than buying outright equity put options, which carry high implied volatility premia, macro funds are structuring VIX Call Spreads (Dec26 25/35 call spread) and buying Crude Oil Volatility (OVX) call options. Because crude oil volatility is closely tied to supply security, owning oil options volatility provides an effective hedge against broader systemic market corrections.
PART VII: THE CORRELATION MATRIX & DESK RULES
Avoiding the High-Correlation Trap (Rule 14.6)
An essential risk mandate for the upcoming week is the strict enforcement of Rule 14.6: avoiding simultaneous unhedged directional exposure to cross-asset pairs exhibiting a 30-day rolling correlation coefficient (ρ\rhoρ) greater than 0.70.
========================================================================================
            PROPRIETARY CROSS-ASSET CORRELATION BENCHMARK (RULE 14.6)
========================================================================================
Asset Pair / Cross               30-Day ρ    Directional Risk Profile & Mandate
----------------------------------------------------------------------------------------
ICE Brent (CO) / NYMEX WTI (CL)   +0.92      EXTREME CORRELATION: Trade basis only
CME S&P 500 (ES) / Nasdaq (NQ)   +0.89      HIGH CORRELATION: Prohibited double-long
COMEX Gold (GC) / 10Y UST (TN)   +0.78      INFLATION/YIELD DRIVER: Use ratio structures
USD Index (DX) / 10Y UST (TN)    +0.74      RATE SPILLOVER: Higher yields fuel dollar
CME Ether (ETH) / Bitcoin (BTC)   +0.81      ETF ROTATION EXCEPTION: Long ETH / Short BTC
CME VIX / S&P 500 (ES)           -0.84      ASYMMETRIC INVERSE: Delta-neutral hedge
CME JPY (6J) / US Equities (ES)  -0.52      RISK-OFF MECHANISM: Yen rallies on equity flush
========================================================================================
           CROSS-ASSET MACRO TRANSMISSION ENGINE (RULES 14.1–14.6)
 ┌────────────────────────────────────────────────────────────────────────┐
 │                      GEOPOLITICAL SUPPLY SHOCKS                        │
 │           (Strait of Hormuz Closure + Saudi Pipeline Outage)           │
 └───────────────────────────────────┬────────────────────────────────────┘
                                     │
                                     ▼
 ┌────────────────────────────────────────────────────────────────────────┐
 │                       CRUDE OIL SPIKES (+$98/bbl)                      │
 │ ── Rule 14.2: Surging crude directly drives headline CPI inflation     │
 └───────────────────────────────────┬────────────────────────────────────┘
                                     │
                                     ▼
 ┌────────────────────────────────────────────────────────────────────────┐
 │              CENTRAL BANK HAWKISH SQUEEZE (FED TERMINAL 5.75%)         │
 │ ── Rule 14.5: Higher yields attract capital flows into the U.S. Dollar │
 └──────────────────┬─────────────────────────────────┬───────────────────┘
                    │                                 │
                    ▼                                 ▼
 ┌──────────────────────────────────────┐ ┌───────────────────────────────┐
 │       BEARISH SOVEREIGN DEBT         │ │    PRESSURE ON RISK ASSETS    │
 │ ── Rule 20.8: Duration under pressure│ │ ── Rule 14.3: Compression in  │
 │    (10Y Treasury yield hits 4.80%)   │ │    equities; S&P & Russell lag│
 └──────────────────────────────────────┘ └───────────────────────────────┘
PART VIII: THE WEEK-AHEAD MASTER TRADING MATRIX
Below is the definitive trade execution matrix for the upcoming trading week (September 14–18, 2026). All notional position sizing reflects the required Rule 4.6 (25% to 50%) volatility haircut.
asciidoc
========================================================================================================================
                                MASTER INSTITUTIONAL TRADING EXECUTION MATRIX
========================================================================================================================
Trade # / Asset        Instrument Code & Expiry  Trade Structure           Entry Level / Target / Stop Loss  Mandate Rule
------------------------------------------------------------------------------------------------------------------------
01. RATES              Ultra 10Y Treasury        Bear Put Spread:          Entry: 1-12/64 debit              Rules 20.1,
    Bear Flattening    CME: TN Dec 2026          Buy 105 P / Sell 100 P    Target: 3-45/64 payout            20.8
                                                                           Stop: Loss of 0-35/64 premium
------------------------------------------------------------------------------------------------------------------------
02. RATES              CME 30Y Ultra Bond (UB)   NOB Curve Spread:         Entry: Spread at +30 bps          Rules 20.2,
    Yield Curve Steep  vs CME Ultra 10Y (TN)     Long UBZ6 / Short TNZ6    Target: Spread +52 bps            14.6
                                                 (Weight: 1 UB to 1.4 TN)  Stop: Spread at +18 bps
------------------------------------------------------------------------------------------------------------------------
03. ENERGY             ICE Brent Crude           Bull Call Spread:         Entry: $4.80/bbl debit            Rules 13.1,
    Physical Shortage  ICE: COZ6 (Dec 2026)      Buy $120 C / Sell $140 C  Target: $16.00/bbl                13.4, 14.2
                                                                           Stop: Loss of $2.20 premium
------------------------------------------------------------------------------------------------------------------------
04. ENERGY             NYMEX RBOB Gasoline (RB)  Crude Crack Spread:       Entry: $45.00/bbl margin          Rules 13.2,
    Refinery Bottlenecks CME: RBZ6 vs CLZ6       Long RBZ6 / Short CLZ6    Target: $54.00/bbl crack          14.6
                                                 (1:1 Contract Ratio)      Stop: $38.50/bbl crack
------------------------------------------------------------------------------------------------------------------------
05. DIGITAL ASSETS     CME Ether vs Bitcoin      Relative Value Pair:      Entry: Ratio at 0.0321            Rule 14.6
    ETF Decoupling     CME: METZ6 vs MBTZ6       Long ETH / Short BTC      Target: Ratio at 0.0420           Override
                                                 (Dollar-Neutral Delta)    Stop: Ratio at 0.0298
------------------------------------------------------------------------------------------------------------------------
06. METALS             COMEX Gold Options        Bull Call Vertical:       Entry: $18.50/oz debit            Rules 14.4,
    Sovereign Reserve  COMEX: OG Dec 2026        Buy $2,600 C / Sell $2,700 Target: $68.00/oz               14.5
                                                                           Stop: Loss of $9.00 premium
------------------------------------------------------------------------------------------------------------------------
07. AGRICULTURE        CBOT Soybeans vs Corn     Ag Inter-Commodity Pair:  Entry: Spread at +$9.70/bu        Rules 13.1,
    Pre-USDA Report    CBOT: ZSZ6 vs ZCZ6        Long ZSZ6 / Short ZCZ6    Target: +$11.20/bu                13.5
                                                 (1:1 Bushel Basis)        Stop: +$8.90/bu
------------------------------------------------------------------------------------------------------------------------
08. CURRENCIES         ICE U.S. Dollar Index     Outright Long Futures:    Entry: 106.80 basis               Rules 14.5,
    Carry Squeeze      ICE: DXZ6 (Dec 2026)      Long DX Futures           Target: 108.90                    20.8
                                                 (Sized at 50% notional)   Stop: 105.75
------------------------------------------------------------------------------------------------------------------------
09. CURRENCIES         CME Japanese Yen Options  Put Seagull Spread:       Entry: Net credit +0.02 pts       Rules 13.4,
    Intervention Tail  CME: 6JZ6 (Dec 2026)      Buy 155 P, Sell 150 P,    Target: 2.80 pts intrinsic        14.6
                                                 Sell 165 C                Stop: Spot close > 162.50
------------------------------------------------------------------------------------------------------------------------
10. VOLATILITY         CBOE VIX Futures Options  Bull Call Vertical:       Entry: 2.45 pts debit             Rules 4.6,
    FOMC Tail Risk     CBOE: VX Dec 2026         Buy 25 C / Sell 35 C      Target: 7.20 pts payout           14.3
                                                                           Stop: Loss of 1.20 pts premium
========================================================================================================================
PART IX: DESK STRATEGY & TRADE IMPLEMENTATION (WEEK OF SEP 14–18)
Monday, September 14 (Asian/European Market Open)
Energy Spread Execution: Implement the Brent Dec26 $120/$140 Call Spread early in the European session. Monitor prompt physical cash market prints out of Singapore and Rotterdam to confirm ongoing backwardation.
Crypto Rotation Setup: Open the Long CME ETH / Short CME BTC spread. Check that weekend institutional ETF creation orders reflect the continuation of the $216M ETH inflow trend vs. BTC outflows.
Ag Spread Check: Review updated private weather radar readings from central Brazil and Argentina to confirm drought stress supporting the Long Soybeans (ZSZ6) / Short Corn (ZCZ6) spread.
Tuesday, September 15 (European Industrial & UK Data)
Gilt/Bund Relative Value Execution: Assess UK wage data and morning BoE pricing. If 10-year Gilt yields push above 4.90%, look to add to the Short Gilt / Long Bund spread as the differential nears +120 bps.
Currency Volatility Structure: With USD/JPY testing 158.70, execute the 6J Dec26 Seagull Spread. Check that the short 165.00 call strike remains well above the BoJ intervention defense line.
Wednesday, September 16 (Global Energy Inventories)
EIA Petroleum Status Report: Monitor Cushing inventory draws and domestic refinery utilization figures (benchmark: 98%). If runs remain capacity-constrained and gasoline inventories print at multi-year lows, increase exposure to the RBOB-WTI Crack Spread (RBZ6 vs CLZ6) toward its $54.00/bbl target.
Metals Rebalancing: Check COMEX Gold backwardation spreads against Treasury yield shifts. If 10-year yields approach 4.80% and gold holds above $2,540, maintain the Dec26 $2,600/$2,700 Call Spread.
Thursday, September 17 (U.S. Primary Debt Auction & Pre-FOMC Flows)
Treasury Supply Absorption: Track primary dealer bid-to-cover metrics on scheduled Treasury note sales. In the event of weak dealer participation or widening tails, maintain the Short Ultra 10-Year (TNZ6) short position and confirm that the 10s30s NOB steepener is expanding toward +40 bps.
Index Risk Collar Verification: Ensure all broad equity long positions carry protective put spread overlays (ES Dec26 5200/5000) ahead of central bank rate decisions.
Friday, September 18 (September FOMC Decision & Triple Witching)
FOMC Policy Decision (14:00 EST):
If the Fed delivers a 25 bps hike alongside hawkish guidance for a 5.75% terminal rate, hold long USD Index (DXZ6) positions and monitor the VIX Dec26 25/35 Call Spread for a potential volatility spike.
If the Fed surprises with a 50 bps hike, expect initial equity downside (targeting 5,000 on ES Dec26). Prepare to take full profit on the TNZ6 105/100 Put Spread as 10-year yields push toward 5.00%.
If the Fed pauses due to fiscal instability concerns, close short Treasury delta immediately and add to COMEX Gold (GC Dec26) and ETH futures positions, as a pause in the face of inflation would trigger a sharp repricing across real assets.
CONCLUDING RISK MANDATE
Trading through the week of September 14–18, 2026 requires strict balance-sheet discipline. The market is not operating in a calm, low-volatility environment where trend-following guarantees returns; it is navigating a late-stage, supply-side inflationary squeeze coupled with a sovereign debt absorption wall.
Every position must carry defined-risk parameters, clear invalidation levels, and deliberate sizing reductions consistent with the elevated VIX regime (Rule 4.6). Avoid chasing headline diplomacy in energy, do not buy long-duration paper without an established yield curve spread, and respect the institutional rotation flowing into physically scarce and cash-yielding assets.
DISCLAIMER: For institutional educational purposes only. Futures and options-on-futures trading involves substantial risk of financial loss and is not suitable for all investors. Past performance is not indicative of future results.