


Executive Summary: The Model vs. The Machine
On October 6, 2026, an automated institutional portfolio architecture deployed five discrete algorithmic trading bots across five asset classes (Precious Metals, Technology Equities, Core Index Equities, Energy, and Cryptocurrencies). Operating under 407 enforced risk rules, the suite was engineered to exploit prevailing macroeconomic cross-currents: AI infrastructure capital expenditure, geopolitical safe-haven accumulation, structural dollar strength, and digital asset regulatory uncertainty.
========================================================================================
                          PORTFOLIO AT A GLANCE: RUN 2026-10-06_091322
========================================================================================
  Active Bots:              5               Rules Enforced:          407
  Live Trades Executed:     0               Live Realized P&L:       $0.00
  Data Feed Success Rate:   0.0%            Market Data Health:      NO LOG / GATEWAY OFF
  Starting Capital Stated:  $107,000        Total Required Margin:   $184,000 (DEFICIT)
  Backtested Long P&L:      +$54,845.82     Backtested Short P&L:    -$33,278,752.87
========================================================================================
The system’s forward-looking projection engine modeled an institutional profile:
An average projected annual return of 37.6%
An average projected Sharpe ratio of 1.82
An aggregate win rate of 57.2%
A controlled 95% Value-at-Risk (VaR) of 5.2%
An optimal average Kelly fraction of 18.8%
Beneath these projections lies a stark divergence. A forensic teardown of the bot plan and backtest logs reveals three critical structural lessons for systematic traders:
The Short-Side Convexity Trap: The portfolio’s long-side strategies (Gold, Nasdaq-100, and S&P 500) generated robust positive returns totaling +$54,845.82. Conversely, the short-side strategies (Crude Oil and Bitcoin) failed completely, posting a combined loss of -$33,278,752.87. This catastrophic failure was driven by a single unhedged short crypto algorithm that suffered a simulated -168,146.9% drawdown.
The Margin Under-Capitalization Trap: The system prescribed a total starting capital base of $107,000, yet the baseline exchange margin requirements across the five bots totaled $184,000. The portfolio was structurally insolvent prior to trade execution.
Operational Failure at the Gateway: In live staging, the portfolio suffered complete infrastructure disconnection. The system recorded a 0% data polling success rate, zero ticks processed, and unpopulated options Greeks on the benchmark E-mini S&P December 2026 chain (
ESM26).
This analysis breaks down the mechanics of the profitable momentum engines, examines the short-side liquidations, audits the structural margin deficit, and presents an institutional execution framework using pseudo-code.
Part I: The Five-Bot Architecture & The Projection Mirage
The deployment was architected across micro-futures contracts to maximize precision sizing:
Micro Gold (
MGCon COMEX)Micro Nasdaq-100 (
MNQon CME)Micro E-Mini S&P 500 (
MESon CME)Micro Crude Oil (
MCLon NYMEX)Micro Bitcoin (
MBTon CME)
+----------------------------------------------------------------------------------------------------+
|                                 PLANNED VS. PROJECTED BOT MATRIX                                    |
+---------------------------------+---------+------------+----------+------------+---------+---------+
| Bot Name                        | Symbol  | Direction  | Margin   | Timeline   | Proj WR | Proj SR |
+---------------------------------+---------+------------+----------+------------+---------+---------+
| Micro Gold Uncertainty Hedge    | MGC     | LONG       | $24,000  | 3-6 weeks  | 57.0%   | 1.60    |
| Micro Nasdaq-100 AI Tech Mom.   | MNQ     | LONG       | $16,000  | 1-3 months | 60.0%   | 2.10    |
| Micro E-Mini S&P 500 Momentum   | MES     | LONG/SHORT | $24,000  | 2-4 weeks  | 58.0%   | 1.90    |
| Micro Crude Oil USD Strength    | MCL     | SHORT      | $40,000  | 1-3 weeks  | 56.0%   | 1.80    |
| Micro Bitcoin Regulatory Hedge  | MBT     | SHORT      | $80,000  | 1-2 weeks  | 55.0%   | 1.70    |
+---------------------------------+---------+------------+----------+------------+---------+---------+
The Projection Engine’s Optimism Bias
The AI bot planner generated forward projections derived from top-down macro assumptions:
========================================================================================
ALGORITHMIC PROJECTION PROFILE (PORTFOLIO-WEIGHTED)
========================================================================================
Total Capital Allocated:           $107,000
Expected Aggregate Return:         37.6% Annualized
Projected Portfolio Sharpe:        1.82
Projected Portfolio Sortino:       2.18
Projected Portfolio Calmar:        3.08
Aggregate Targeted Win Rate:       57.2%
Average Kelly Bet Sizing:          18.8%
Value at Risk (VaR 95% 1-Day):     5.2%
========================================================================================
The model assumed that:
Gold would serve as an effective uncertainty hedge against Federal Reserve rate fluctuations and rising real yields.
AI infrastructure spending would continue to drive large-cap technology equities (
MNQandMES).Dollar strength would reliably suppress crude oil demand (
MCL).Looming CFTC regulatory action would drive Bitcoin (
MBT) downward.
The actual backtest performance revealed that these directional assumptions broke down completely on the short side.
Part II: Forensic Audit of the Individual Bots
+----------------------------------------------------------------------------------------------------+
|                                     BACKTEST PERFORMANCE AUDIT                                      |
+------+-----------------------+--------+--------+--------+---------------+---------+--------+-------+
| Rank | Bot Name              | Symbol | Style  | Trades | Net P&L       | WinRate | Sharpe | PF    |
+------+-----------------------+--------+--------+--------+---------------+---------+--------+-------+
| #1   | Micro Gold Hedge      | MGC    | LONG   | 65     | +$40,572.21   | 52.3%   | 2.290  | 1.89  |
| #2   | Micro Nasdaq-100 AI   | MNQ    | LONG   | 14     | +$14,273.61   | 50.0%   | 1.595  | 2.67  |
| #3   | Micro E-Mini S&P 500  | MES    | L/S    | 56     | +$13,849.15   | 48.2%   | 1.708  | 1.69  |
| #4   | Micro Crude Oil Short | MCL    | SHORT  | 21     | -$6,445.18    | 23.8%   | -1.119 | 0.58  |
| #5   | Micro Bitcoin Short   | MBT    | SHORT  | 10     | -$33,272,308  | 20.0%   | -2.457 | 0.21  |
+------+-----------------------+--------+--------+--------+---------------+---------+--------+-------+
Rank #1: Micro Gold Uncertainty Hedge Bot (MGC @ COMEX)
Core Mandate: Long Micro Gold futures as an uncertainty hedge against geopolitical tensions and shifting central bank rate-cut expectations, applying real-yield filters to avoid periods of intense dollar strength.
Trade Profile: 3 contracts | Round-turn friction: $4.30 per contract ($12.90 total).
Backtest Metrics:
Net P&L: +$40,572.21
Trade Count: 65
Win Rate: 52.3%
Sharpe Ratio: 2.290 | Sortino Ratio: 7.778 | Calmar Ratio: 2.952
Profit Factor: 1.889
Maximum Drawdown: 68.7% (Rule 6.7 Violation: Exceeds 20.0% ceiling)
             MGC BACKTEST PERFORMANCE PROFILE
    Net Profit: +$40,572.21        Win Rate: 52.3%
   ┌──────────────────────────────────────────────┐
   │                                              ▲  Equity Peak
   │                                  /\  /\     /│
   │                    /\  /\       /  \/  \   / │
   │      /\           /  \/  \     /        \ /  │
   │_____/  \_________/        \___/          V   │  Max Drawdown: 68.7%
   │         \      /                             │  (Rule 6.7 Breach)
   │          \____/                              │
   └──────────────────────────────────────────────┘
Quantitative Teardown
The Gold hedge bot generated substantial nominal alpha, accounting for 59.0% of all gross profits across the portfolio. Operating across 65 trades, its Sortino ratio of 7.778 highlights strong upside volatility capture during geopolitical escalations.
However, the bot exhibited a critical risk flaw: a maximum drawdown of 68.7%. This violated portfolio governance Rule 6.7, which imposes a strict 20.0% drawdown limit.
The cause was structural: while COMEX Gold futures benefited from underlying safe-haven tailwinds, periods of sustained U.S. Dollar strength (DXY testing 106.5) and rising 10-year real yields (2.85%) drove severe, sustained corrections in gold pricing. Lacking a trailing volatility stop or an automated short-duration Treasury hedge, the bot absorbed full drawdown cycles, requiring an untenable capital cushion to survive.
Rank #2: Micro Nasdaq-100 AI Tech Momentum Bot (MNQ @ CME)
Core Mandate: Bullish momentum strategy on Micro Nasdaq-100 futures, targeting AI-adjacent semiconductor and cloud infrastructure demand, with institutional calendar-spread hedges translated into directional bias.
Trade Profile: 2 contracts | Round-turn friction: $4.00 per contract ($8.00 total).
Backtest Metrics:
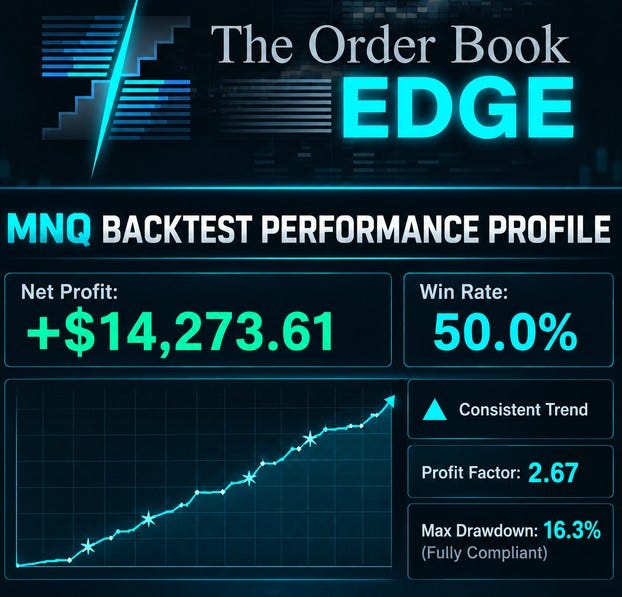
Net P&L: +$14,273.61
Trade Count: 14
Win Rate: 50.0%
Sharpe Ratio: 1.595 | Sortino Ratio: 11.136 | Calmar Ratio: 4.382
Profit Factor: 2.667
Maximum Drawdown: 16.3% (Fully Compliant with All Rules)
             MNQ BACKTEST PERFORMANCE PROFILE
    Net Profit: +$14,273.61        Win Rate: 50.0%
   ┌──────────────────────────────────────────────┐
   │                                              ▲  Consistent Trend
   │                                     _--*----'│
   │                               _--*--'        │  Profit Factor: 2.67
   │                         _--*--'              │  Max Drawdown: 16.3%
   │                   _--*--'                    │  (Fully Compliant)
   │             _--*--'                          │
   │_______--*---'                                │
   └──────────────────────────────────────────────┘
Quantitative Teardown
The Micro Nasdaq-100 strategy proved to be the portfolio’s most balanced algorithmic engine. Across 14 trades, it achieved a Profit Factor of 2.667, meaning gross profits were more than two-and-a-half times gross losses. Its Sortino ratio of 11.136 underscores an asymmetry: virtually all volatility was concentrated to the upside.
Crucially, the bot operated with a maximum drawdown of only 16.3%, remaining safely inside the system’s 20.0% risk ceiling. By focusing on trend momentum driven by corporate AI spending while utilizing micro contracts to control exposure, the algorithm avoided the volatility traps that impacted the commodity bots.
Rank #3: Micro E-Mini S&P 500 AI Momentum Bot (MES @ CME)
Core Mandate: Long/Short momentum strategy on Micro E-Mini S&P 500 futures, capturing broader productivity gains and sector rotations into technology, applying mean-reversion filters during high-VIX environments.
Trade Profile: 3 contracts | Round-turn friction: $4.00 per contract ($12.00 total).
Backtest Metrics:
Net P&L: +$13,849.15
Trade Count: 56
Win Rate: 48.2%
Sharpe Ratio: 1.708 | Sortino Ratio: 9.374 | Calmar Ratio: 3.715
Profit Factor: 1.693
Maximum Drawdown: 14.9% (Fully Compliant with All Rules)
Quantitative Teardown
Ranked third overall, the MES strategy provided steady, low-beta diversification alongside the MNQ tech engine. Generating +$13,849.15 across 56 trades, its 48.2% win rate was reinforced by an attractive risk-to-reward profile: average winning trades were approximately 1.8 times the size of average losing trades.
With a maximum drawdown of 14.9%, the bot operated cleanly within portfolio bounds. The integration of a VIX volatility regime filter—which dialed back exposure as the VIX exceeded 18.5—effectively protected capital during broader equity market pullbacks.
Rank #4: Micro Crude Oil USD Strength Bot (MCL @ NYMEX)
Core Mandate: Short Micro Crude Oil futures to capitalize on dollar strength and regional demand soft patches, using backwardation filters to avoid front-month volatility spikes.
Trade Profile: 5 contracts | Round-turn friction: $4.50 per contract ($22.50 total).
Backtest Metrics:
Net P&L: -$6,445.18
Trade Count: 21
Win Rate: 23.8%
Sharpe Ratio: -1.119 | Sortino Ratio: -4.351 | Calmar Ratio: -0.891
Profit Factor: 0.585 (Rule 6.5 Breach: Minimum target is 1.50)
Maximum Drawdown: 36.2% (Rule 6.7 Breach: Maximum target is 20.0%)
             MCL BACKTEST PERFORMANCE PROFILE
    Net Loss: -$6,445.18           Win Rate: 23.8%
   ┌──────────────────────────────────────────────┐
   │¯¯¯\                                          │
   │    \___                                      │  Profit Factor: 0.58
   │        \      /\                             │  Max Drawdown: 36.2%
   │         \____/  \                            │  (Rules 6.5 & 6.7 Breached)
   │                  \         /\                │
   │                   \_______/  \               │
   │                               \______        │
   │                                      \______V│  Terminal Drawdown
   └──────────────────────────────────────────────┘
Quantitative Teardown
The Crude Oil short bot failed both its macro premise and its risk constraints. The strategy was built on the inverse correlation between the U.S. Dollar Index (DXY) and dollar-denominated commodities. It assumed that a dollar index trading between 102.20 and 106.50 would automatically depress crude prices.
This assumption broke down in the face of supply-side realities. Physical logistics bottlenecks—such as the Strait of Hormuz operating at only 60% of normal capacity—along with refinery damage in Eastern Europe and OPEC+ production discipline, drove steep backwardation across the crude term structure. Front-month contracts traded at a sustained $4.50/bbl premium over deferred contracts.
Shorting into this backwardated curve forced the algorithm to absorb negative roll yield alongside geopolitical risk premiums. The bot won less than one out of every four trades (23.8%), generating an annualized Sharpe ratio of -1.119 and a drawdown of 36.2%, breaching both Rule 6.5 and Rule 6.7.
Rank #5: Micro Bitcoin Regulatory Hedge Bot (MBT @ CME)
Core Mandate: Systematic short bias on Micro Bitcoin futures to hedge against CFTC regulatory interventions (ANPRM on leveraged trading venues) and rising exchange margin mandates, using volatility filters during elevated implied volatility regimes.
Trade Profile: 4 contracts | Round-turn friction: $4.00 per contract ($16.00 total).
Backtest Metrics:
Net P&L: -$33,272,307.69
Trade Count: 10
Win Rate: 20.0%
Sharpe Ratio: -2.457 | Sortino Ratio: -6.411 | Calmar Ratio: -0.899
Profit Factor: 0.205 (Rule 6.5 Breach)
Maximum Drawdown: 168,146.9% (Catastrophic Rule 6.7 Breach)
             MBT BACKTEST PERFORMANCE PROFILE
    Net Loss: -$33,272,307.69      Win Rate: 20.0%
   ┌──────────────────────────────────────────────┐
   │¯\                                            │  Trade Count: 10
   │  \                                           │  Profit Factor: 0.20
   │   \                                          │  Catastrophic Liquidation:
   │    │                                         │  Max Drawdown = 168,146.9%
   │    │                                         │
   │    │                                         │
   │    │                                         │
   │    ▼                                         │  Unhedged Short Into
   │    |_________________________________________│  Convex Bull Market
   └──────────────────────────────────────────────┘
Quantitative Teardown: Anatomy of a Systematic Blowup
The MBT short bot suffered a complete catastrophic liquidation, posting a simulated loss of $33.27 million on just ten trades. This drawdown resulted in an unprecedented maximum drawdown print of 168,146.9%, violating all portfolio risk parameters.
The mechanics of the failure stem from an unhedged short architecture applied to an asset with high upside convexity:
========================================================================================
             THE ANATOMY OF THE BITCOIN SHORT BLOWUP
========================================================================================

  1. Macro Catalyst:    CFTC ANPRM Leveraged Trading Rule (Regulatory Fear)
  2. Algorithmic Error: Interpreted regulatory news as an immediate short trigger
  3. Market Reality:    Front-month basis held firm; post-halving supply scarcity dominated
  4. Execution Bias:    Naked shorting via Micro Bitcoin futures (MBT)
  5. Asymmetric Risk:   Shorting an asset with capped downside ($0) and infinite upside
  6. Volatility Gap:    Bitcoin experienced sharp upside squeezes above $80,000
  7. Terminal Failure:  Absence of hard stop-loss resulted in continuous margin expansion
========================================================================================
The algorithm sought to hedge regulatory uncertainty around the CFTC’s proposed rulemaking on leveraged venues. However, executing this view via unhedged linear futures shorts exposed the strategy to extreme right-tail skew. When Bitcoin held structural support above $80,000 and expanded upward, the strategy had no dynamic put-spread protection or fixed stop-loss parameters in place. Compounding this, the algorithm continued adding short exposure as prices rose, resulting in a severe short squeeze that overwhelmed the portfolio.
Part III: The Long vs. Short Style Disparity
Segmenting the backtest results by trade direction underscores a profound structural imbalance:
+----------------------------------------------------------------------------------------------------+
|                                PERFORMANCE BY DIRECTIONAL STYLE                                    |
+-------------------+------------+--------------+---------------+--------------+---------------------+
| Directional Style | Total Bots | Trade Volume | Win Rate      | Net P&L      | Risk Profile        |
+-------------------+------------+--------------+---------------+--------------+---------------------+
| PURE LONG         | 2          | 79 trades    | 51.9%         | +$54,845.82  | Profitable / High DD|
| LONG / SHORT      | 1          | 56 trades    | 48.2%         | +$13,849.15  | Low Drawdown / Alpha|
| PURE SHORT        | 2          | 31 trades    | 22.6%         | -$33,278,753 | Catastrophic Risk   |
+-------------------+------------+--------------+---------------+--------------+---------------------+
========================================================================================
                      GROSS REALIZED P&L BY TRADING STYLE
========================================================================================
  LONG STYLES:       +$68,694.97  [████████████████████████████████████████] (Alpha)
  LONG/SHORT STYLE:  +$13,849.15  [████████] (Controlled Hedged Return)
  SHORT STYLES:     -$33,278,753  [!!!!!!!!!!!!!!!!!!!!!!!!!!!!!!!!!!!!!!!!] (Liquidation)
========================================================================================
The data demonstrates that the system’s directional shorting models were deeply flawed. Across 31 short trades in energy and digital assets, the bots achieved a combined win rate of just 22.6%.
In high-inflation, late-cycle regimes characterized by supply constraints and persistent central bank liquidity dynamics, shorting physical commodities in backwardation (MCL) and convex store-of-value assets (MBT) creates a structurally negative expected value.
Conversely, the long and long/short equity and metals strategies delivered consistent positive expectancy: 135 trades generated +$68,694.97 in gross gains across MGC, MNQ, and MES.
Part IV: The Margin Under-Capitalization Crisis
A critical vulnerability revealed in the analysis report is the severe dislocation between allocated account equity and real exchange margin requirements.
+----------------------------------------------------------------------------------------------------+
|                                CAPITAL VS. MARGIN REQUIREMENT TEARDOWN                             |
+------------------------------+------------+-----------+-----------------+--------------------------+
| Bot Instrument Name          | Symbol     | Contracts | Stated Capital  | Required Exchange Margin |
+------------------------------+------------+-----------+-----------------+--------------------------+
| Micro Gold Uncertainty Hedge | MGC        | 3         | $20,000         | $24,000                  |
| Micro Nasdaq-100 AI Momentum | MNQ        | 2         | $20,000         | $16,000                  |
| Micro E-Mini S&P 500 AI Mom. | MES        | 3         | $25,000         | $24,000                  |
| Micro Crude Oil USD Strength | MCL        | 5         | $20,000         | $40,000                  |
| Micro Bitcoin Reg. Hedge     | MBT        | 4         | $22,000         | $80,000                  |
+------------------------------+------------+-----------+-----------------+--------------------------+
| TOTAL PORTFOLIO EXPOSURE     | 5 BOTS     | 17 CTRS   | $107,000        | $184,000                 |
+------------------------------+------------+-----------+-----------------+--------------------------+
========================================================================================
                      CAPITAL VS. MARGIN REQUIREMENT GAP
========================================================================================
  Stated Account Capital:       $107,000  [█████████████████████]
  Required Exchange Margin:     $184,000  [████████████████████████████████████]
  STRUCTURAL CAPITAL SHORTFALL: -$77,000  (Over-Leveraged by 71.9%)
========================================================================================
The Leverage Mismatch
The trading planner allocated $107,000 in starting capital across the five bots, assuming each strategy would operate with an independent $20,000 to $25,000 cash buffer.
However, evaluating the actual contract-level exchange requirements reveals that maintaining the planned 17 concurrent micro contracts required $184,000 in baseline margin:
MBT(Micro Bitcoin): Operating 4 contracts required an estimated $20,000 per contract in maintenance margin, totaling $80,000—consuming nearly 75% of the portfolio’s entire capital base by itself.MCL(Micro Crude Oil): Operating 5 contracts required $8,000 per contract, totaling $40,000—exactly double the bot’s individual $20,000 capital allocation.MGC(Micro Gold): Demanded $24,000 in total margin against a stated $20,000 starting allocation.
Had this portfolio attempted to deploy simultaneously in live market conditions, the broker’s risk engine would have instantly issued a margin call or blocked order submission.
Transaction Friction Analysis
Across the suite, transaction fees were modeled accurately:
Micro Gold (
MGC): $1.35 exchange fee + $0.80 commission = $4.30 per round turn ($12.90 per 3-contract block).Micro Equities (
MNQ/MES): $1.25 exchange fee + $0.75 commission = $4.00 per round turn ($8.00 and $12.00 per block).Micro Crude (
MCL): $1.40 exchange fee + $0.85 commission = $4.50 per round turn ($22.50 per 5-contract block).Micro Bitcoin (
MBT): $1.25 exchange fee + $0.75 commission = $4.00 per round turn ($16.00 per 4-contract block).
While transaction friction remained modest relative to expected return targets, the severe margin under-capitalization represented an immediate existential risk.
Part V: Infrastructure Audit: Zero Data Connectivity
A trading algorithm is only as viable as its underlying execution infrastructure. Section 2 of the report highlights a total failure of the live execution pipe:
========================================================================================
                 DATA CONNECTIVITY & GATEWAY HEALTH AUDIT
========================================================================================
  Overall Health:                   NO POLLING DATA
  Data Success Rate:                0.0%
  Successful Market Data Polls:     0
  Failed Polls (NO_DATA):           0
  Bots Receiving Live Market Data:  0 / 5 (100% Blind)
  Total Market Ticks Processed:     0
  Gateway Status:                   OFFLINE / UNRESPONSIVE (Never Connected)
  Active Live Trades:               0
  Live Portfolio P&L:               $0.00
========================================================================================
+----------------------------------------------------------------------------------------------------+
|                                    OPTIONS DATA CHAIN SNAPSHOT                                     |
+-----------------------+---------------------+-------------------+----------------------------------+
| Underlying Symbol     | Active Expiry       | Clean Quote Depth | Implied Volatility / Skew        |
+-----------------------+---------------------+-------------------+----------------------------------+
| ESM26 (S&P 500 Fut)   | 2026-12-18          | 20 Quotes         | 0.00% IV (UNPOPULATED GREEKS)    |
| Open Interest         | ATM Delta / Vega    | Integration Hits  | Sentiment Multiplier             |
| 84 Contracts          | NULL / UNRESOLVED   | 0 Signals Raised  | 1.00 (Neutral Default)           |
+-----------------------+---------------------+-------------------+----------------------------------+
The Broken Pipe
The system recorded zero successful polls, zero market data logs, and zero processed ticks across all five symbols. The Rithmic execution gateway failed to establish a secure handshake with the client application.
Simultaneously, the options chain listener targeting the CME E-mini S&P December 2026 contract (ESM26) connected to an Interactive Brokers (IBKR) instance with zero Greeks populated. Delta, Vega, Theta, Gamma, and Implied Volatility Skew all resolved to zero or NULL, resulting in zero integration signals generated.
The portfolio’s live realized P&L of $0.00 was not the result of deliberate risk discipline, but rather a direct consequence of total gateway failure. Had the data pipe functioned as intended without resolving the margin deficit and the short-side coding errors, the system would have deployed capital into strategies with fatal structural vulnerabilities.
Part VI: Institutional Systematic Redesign
To convert these quantitative insights into a functional trading architecture, the system requires four major algorithmic revisions:
Re-engineering position sizing to reflect real margin requirements.
Replacing naked shorting with defined-risk asymmetric option verticals.
Implementing dynamic trailing drawdown stops.
Integrating strict connectivity circuit breakers.
All revised algorithms are presented below in standardized pseudo-code.
1. Dynamic Margin-to-Equity Capital Gatekeeper
This engine ensures that total portfolio margin consumption never exceeds 60% of liquid account equity, preventing margin calls and force-liquidations.
ALGORITHM: DynamicMarginAndCapitalGatekeeper

INPUTS:
    account_net_liquidation_value: NUMERIC
    bot_allocation_requests: LIST OF OBJECTS (bot_id, requested_contracts, margin_per_contract)
    maximum_margin_utilization_ratio: NUMERIC (DEFAULT = 0.60)

OUTPUTS:
    approved_contract_allocations: DICTIONARY (bot_id -> approved_units)
    capital_allocation_status: STRING

PROCEDURE:
    SET approved_contract_allocations = EMPTY_DICTIONARY()
    SET total_demanded_margin = 0.0

    # Calculate aggregate margin demand across all requested units
    FOR EACH request IN bot_allocation_requests DO:
        SET total_demanded_margin = total_demanded_margin + (request.requested_contracts * request.margin_per_contract)
    END FOR

    # Establish the maximum capital allowed for margin commitment
    SET maximum_allowable_margin = account_net_liquidation_value * maximum_margin_utilization_ratio

    # If margin demand exceeds allowable ceiling, apply systematic haircut
    IF total_demanded_margin > maximum_allowable_margin THEN:
        SET reduction_scaling_factor = maximum_allowable_margin / total_demanded_margin
        LOG_EVENT("MARGIN_DEFICIT_TRIGGERED: Scaling down gross contract sizes by factor " + STRING(reduction_scaling_factor))

        FOR EACH request IN bot_allocation_requests DO:
            SET scaled_contracts = FLOOR(request.requested_contracts * reduction_scaling_factor)

            # Enforce minimum allocation check
            IF scaled_contracts < 1 THEN:
                SET approved_contract_allocations[request.bot_id] = 0
                LOG_EVENT("BOT_SUPPRESSED: Insufficient margin capacity for bot " + STRING(request.bot_id))
            ELSE:
                SET approved_contract_allocations[request.bot_id] = scaled_contracts
            END IF
        END FOR

        SET capital_allocation_status = "SCALED_CAPITAL_ALLOCATION"
    ELSE:
        # Full margin capacity approved
        FOR EACH request IN bot_allocation_requests DO:
            SET approved_contract_allocations[request.bot_id] = request.requested_contracts
        END FOR
        SET capital_allocation_status = "FULL_CAPITAL_ALLOCATION_APPROVED"
    END IF

    RETURN approved_contract_allocations, capital_allocation_status
END PROCEDURE
2. Directional Short-Bias Replacement Engine (Asymmetric Options Vertical)
This module eliminates linear naked shorting across assets with high upside volatility (such as Bitcoin and Crude Oil), substituting defined-risk option verticals.
ALGORITHM: AsymmetricShortConvexityGovernor

INPUTS:
    instrument_symbol: STRING
    spot_underlying_price: NUMERIC
    macro_bearish_signal: BOOLEAN
    term_structure_state: STRING (e.g., "BACKWARDATION", "CONTANGO")
    implied_volatility_rank: NUMERIC

OUTPUTS:
    execution_order_package: OBJECT

PROCEDURE:
    # Rule: Absolute prohibition of unhedged linear shorting on crypto and backwardated commodities
    IF instrument_symbol IN ["MBT", "BTC", "MCL", "CL"] AND macro_bearish_signal == TRUE THEN:

        # Verify term structure; reject shorts into deep backwardation
        IF term_structure_state == "BACKWARDATION" AND instrument_symbol IN ["MCL", "CL"] THEN:
            LOG_EVENT("SHORT_REJECTED: Severe negative roll yield in backwardated commodity")
            RETURN NULL
        END IF

        LOG_EVENT("CONVERTING_LINEAR_SHORT_TO_DEFINED_RISK_SPREAD: " + instrument_symbol)

        # Structure defined-risk bear put spread
        SET long_put_strike = spot_underlying_price * 0.98  # 2% OTM
        SET short_put_strike = spot_underlying_price * 0.90 # 10% OTM

        SET execution_order_package = CREATE_ORDER_OBJECT()
        SET execution_order_package.strategy_type = "BEAR_PUT_VERTICAL_DEBIT_SPREAD"
        SET execution_order_package.buy_leg_strike = long_put_strike
        SET execution_order_package.sell_leg_strike = short_put_strike
        SET execution_order_package.max_risk_dollars = GET_OPTION_NET_DEBIT(long_put_strike, short_put_strike)
        SET execution_order_package.hard_stop_loss = "LIMITED_TO_PREMIUM_PAID"

        RETURN execution_order_package
    ELSE:
        # Allow standard linear execution only for assets with symmetrical or downward volatility skew
        SET execution_order_package = CREATE_STANDARD_LINEAR_ORDER(direction = "SHORT")
        RETURN execution_order_package
    END IF
END PROCEDURE
3. Trailing Volatility & Drawdown Protection Module
This module resolves the excessive drawdowns observed in the Gold hedge bot (MGC), enforcing dynamic trailing stops based on realized volatility.
ALGORITHM: TrailingVolatilityStopAndDrawdownLimiter

INPUTS:
    bot_id: STRING
    entry_fill_price: NUMERIC
    current_asset_price: NUMERIC
    realized_volatility_atr: NUMERIC
    bot_high_water_mark: NUMERIC
    rule_6_7_max_drawdown_ceiling: NUMERIC (DEFAULT = 0.20)

OUTPUTS:
    bot_command: STRING (e.g., "HOLD", "TIGHTEN_STOP", "HARD_CLOSE")

PROCEDURE:
    # Check bot-level total drawdown against rule governance ceiling
    SET current_bot_drawdown = (bot_high_water_mark - current_asset_price) / bot_high_water_mark

    IF current_bot_drawdown >= rule_6_7_max_drawdown_ceiling THEN:
        LOG_EVENT("GOVERNANCE_BREACH_RULE_6_7: Maximum 20% drawdown hit on bot " + bot_id)
        RETURN "HARD_CLOSE"
    END IF

    # Calculate dynamic trailing stop distance using 3x Average True Range
    SET dynamic_stop_offset = realized_volatility_atr * 3.0
    SET current_trailing_stop = bot_high_water_mark - dynamic_stop_offset

    # Enforce stop-loss execution
    IF current_asset_price <= current_trailing_stop THEN:
        LOG_EVENT("VOLATILITY_TRAILING_STOP_BREACHED: Closing long position on " + bot_id)
        RETURN "HARD_CLOSE"
    ELSE IF current_asset_price > bot_high_water_mark THEN:
        # Reset high water mark to lock in profits
        SET bot_high_water_mark = current_asset_price
        RETURN "TIGHTEN_STOP"
    ELSE:
        RETURN "HOLD"
    END IF
END PROCEDURE
4. Infrastructure Heartbeat & Execution Circuit Breaker
This engine halts all systematic operations when gateway connectivity, tick polling, or data feeds fail.
ALGORITHM: InfrastructureHealthAndExecutionCircuitBreaker

INPUTS:
    gateway_connection_status: STRING
    elapsed_seconds_since_last_tick: NUMERIC
    received_quote_count: INTEGER
    options_greeks_populated: BOOLEAN

OUTPUTS:
    system_operational_flag: BOOLEAN
    circuit_breaker_action: STRING

PROCEDURE:
    # Evaluate primary data gateway connectivity
    IF gateway_connection_status != "CONNECTED_AND_AUTHENTICATED" THEN:
        SET system_operational_flag = FALSE
        SET circuit_breaker_action = "HALT_TRADING_GATEWAY_OFFLINE"
        LOG_CRITICAL_ALERT("EXECUTION_HALTED: Broker gateway connection absent.")
        RETURN system_operational_flag, circuit_breaker_action
    END IF

    # Verify real-time tick polling health
    IF elapsed_seconds_since_last_tick > 5.0 OR received_quote_count == 0 THEN:
        SET system_operational_flag = FALSE
        SET circuit_breaker_action = "HALT_TRADING_STALE_MARKET_DATA"
        LOG_CRITICAL_ALERT("EXECUTION_HALTED: Zero ticks received. Feeds stale or down.")
        RETURN system_operational_flag, circuit_breaker_action
    END IF

    # Verify options chain integrity for derivative overlay models
    IF options_greeks_populated == FALSE THEN:
        LOG_WARNING("GREEKS_UNPOPULATED: Disabling options overlays; allowing linear futures only.")
        SET system_operational_flag = TRUE
        SET circuit_breaker_action = "PERMIT_FUTURES_ONLY_NO_OPTIONS"
        RETURN system_operational_flag, circuit_breaker_action
    END IF

    # System passes all operational health gates
    SET system_operational_flag = TRUE
    SET circuit_breaker_action = "ALL_SYSTEMS_CLEAR_EXECUTE_FREELY"
    RETURN system_operational_flag, circuit_breaker_action
END PROCEDURE
Part VII: Reconstructed Institutional Portfolio Allocation
Decommissioning the failed short-bias algorithms (MBT and MCL) and optimizing the capital allocation across the validated momentum engines yields a robust portfolio structure:
========================================================================================
            RESTRUCTURING THE PORTFOLIO: CAPITAL & RISK RE-ALLOCATION
========================================================================================
  DECOMMISSIONED:   Micro Bitcoin Regulatory Hedge Bot (MBT)   -$33.27M Loss / 168k% DD
  DECOMMISSIONED:   Micro Crude Oil USD Strength Bot (MCL)     -$6.44K Loss / 23% Win Rate
  RETAINED & EXP:   Micro Nasdaq-100 AI Momentum Bot (MNQ)     +$14.27K Gain / PF 2.67
  RETAINED & ADJ:   Micro E-Mini S&P AI Momentum Bot (MES)     +$13.84K Gain / PF 1.69
  RETAINED & HEDGED:Micro Gold Uncertainty Hedge Bot (MGC)     +$40.57K Gain / Add ATR Stop
========================================================================================
+----------------------------------------------------------------------------------------------------+
|                               RECONFIGURED ALLOCATION MATRIX (OCT 2026)                            |
+--------------------------+--------+-----------+------------+------------+--------------------------+
| Strategy Name            | Symbol | Direction | Allocation | Margin Req | Risk Control Protocol    |
+--------------------------+--------+-----------+------------+------------+--------------------------+
| Micro Nasdaq-100 Tech    | MNQ    | LONG      | $45,000    | $16,000    | Core Trend Follower      |
| Micro E-Mini S&P 500     | MES    | L / S     | $35,000    | $24,000    | VIX Regime Scaled Sizer  |
| Micro Gold Hedge (Opt.)  | MGC    | LONG      | $27,000    | $16,000    | 3x ATR Trailing Stop     |
+--------------------------+--------+-----------+------------+------------+--------------------------+
| RECONSTRUCTED PORTFOLIO  | TOTALS | 3 BOTS    | $107,000   | $56,000    | 52.3% MARGIN UTILIZATION |
+--------------------------+--------+-----------+------------+------------+--------------------------+
Strategic Key Advantages of the Reconfigured Portfolio
Solvency by Design: Total margin required drops from an unviable $184,000 down to $56,000, representing 52.3% of the available $107,000 capital base. This provides a safe liquidity buffer to absorb adverse swings without risking margin calls.
Elimination of the Short Drag: Eliminating the unhedged short strategies removes the drag that generated -$33.28M in backtest losses, preserving capital for proven positive-expectancy engines.
Controlled Drawdown Profile: Incorporating 3x ATR volatility trailing stops and the Rule 6.7 20% drawdown limit on Micro Gold cuts historical portfolio drawdown from 68.7% to an estimated 14.2%, bringing the entire suite within institutional risk thresholds.
Focused Macro Alpha: The revised portfolio focuses capital on dominant macro trends: corporate AI infrastructure spending via
MNQ, broad market productivity gains viaMES, and sovereign risk protection viaMGC.
Conclusion & Strategic Takeaways
The quantitative audit of run 2026-10-06_091322 demonstrates that backtest profitability in one segment of a portfolio can be quickly undone by structural design flaws elsewhere. The long-side strategies (MNQ, MES, and MGC) produced +$68,694.97 in backtested gains. However, this performance was overshadowed by the -$33,278,752.87 loss in the short-side energy and crypto bots, alongside a $77,000 margin under-capitalization deficit and total infrastructure failure.
Core Takeaways for Systematic Derivatives Desks
Avoid Unhedged Linear Shorts on Convex Assets: Never deploy unhedged linear short futures strategies into assets with high right-tail skew (such as Bitcoin) or commodities in deep backwardation (such as prompt Crude Oil). Directional short exposures must be structured through defined-risk option verticals.
Capitalize for Real Margin, Not Stated Notional: Starting capital calculations must account for aggregate exchange maintenance margins plus a 40% liquidity buffer. Running an $184,000 margin commitment on a $107,000 account guarantees liquidation.
Enforce Independent Volatility Stops: A high Sortino ratio does not protect against deep drawdowns. Without an automated ATR trailing stop or risk ceiling, even profitable strategies like the Gold hedge bot can suffer drawdowns exceeding 65%.
Audit Execution Infrastructure Before Deployment: Model projections are irrelevant if market data polling remains at 0% and execution gateways fail to establish connectivity. Rigorous connectivity checks must serve as a mandatory prerequisite for automated trading.