


TABLE OF CONTENTStelegra
Executive Summary & Macro Thesis
The Sovereign Debt Complex: Yield Curves, Basis Arbitrage, and the 19-Year High
The Anatomy of the 10-Year Treasury Yield Surge
Curve Inversion Dynamics & The Bear-Steepener Dilemma
Institutional Rates Order Books: SOFR, Eurodollars, and Butterfly Convexity
Global Cross-Contagion: UK Gilts, European Periphery (BTP/Bund), and Japan
Foreign Exchange Derivatives: The Dollar Wrecking Ball & G10 Stagnation
Real Interest Rate Parity and the DXY Term Structure
EUR/USD: European De-industrialization and Parity Skew
USD/JPY: The Bank of Japan’s Trilemma and the 170.00 Tail Hedge
Commodity FX (AUD, CAD) and Emerging Market Carry Dynamics
Energy, Power & Commodities: Geopolitics, AI Infrastructure, and Scarcity
Crude Oil: The Hormuz Bottleneck, Crack Spreads, and Brent-WTI Arbitrage
European Gas (TTF) & Global LNG: The 160% Parabolic Spike
The AI Power Drain: Data Center Gas Generators and Agricultural Inflation
Precious & Industrial Metals: Gold’s Divergence, Silver Tightness, and Tungsten
Equity Index Derivatives & Structural Volatility Regimes
Equity Risk Premia Compression: S&P 500 (ES) and Nasdaq-100 (NQ)
Navigating the VIX 22 Regime: Rule 4.6 Capital Allocation Controls
Asymmetric Hedging: Collars, Put Spreads, and Downside Gamma
Digital Assets & Tokenized Derivatives: Macro Liquidity vs. Crypto Alpha
CME Bitcoin & Ethereum Futures: The Basis Trade and Institutional Contango
MicroStrategy Accumulation vs. Exchange Security Shocks
The Tokenized Derivatives Frontier: Cboe and S&P DJI Volatility Products
Cross-Asset Correlation Matrix & Quantitative Risk Management
Rule 14.6: Co-dependence Hazards and Portfolio Invalidation
The Big Four Correlated Pairs: Oil-DXY, Equities-Rates, BTC-Tech, Gold-TIPS
The Institutional Playbook: Trade Specifications and Execution Matrix
Forward-Looking Catalysts & Concluding Remarks
Mandatory Investment Warning & Risk Disclosure
MANDATORY INVESTMENT WARNING & REGULATORY DISCLAIMER
FOR PROFESSIONAL AND INSTITUTIONAL EDUCATIONAL PURPOSES ONLY. NOT DIRECT FINANCIAL OR INVESTMENT ADVICE.
Futures, options-on-futures, swaps, and cross-asset derivatives involve substantial leverage and carry a high probability of rapid capital loss. Leverage can amplify losses beyond your initial margin deposits. Past performance, backtested modeling, and institutional open-interest profiling are not predictive of future returns. Market volatility regimes fluctuate dynamically; under the governing risk framework of this report (Rule 4.6: VIX in the 15–25 bracket), all directional portfolio allocations must automatically undergo a 25% mandatory sizing reduction. Do not deploy capital into any complex derivatives instrument without a qualified, licensed financial advisor and a rigorous quantitative risk framework.
1. Executive Summary & Macro Thesis
The global macro landscape has reached an inflection point defined by a structural divergence between stubborn, energy-driven inflation and the restrictive monetary mechanisms designed to suppress it. As central banks across developed markets push benchmark policy rates higher or actively push back against early accommodation, financial conditions are tightening aggressively.
       [ Persistent Energy / AI Power Demand ]
                         │
                         ▼
             [ Higher Inflation Breakevens ]
                         │
                         ▼
        [ Hawkish Central Banks (Fed, ECB, BoE) ]
                         │
                         ▼
  ┌────────────────────────────────────────────────────────┐
  │  US 10Y Yield at 19-Year Highs (4.50% - 5.29%)          │
  │  2s10s Curve Deeply Inverted (-30 to -50 bps)          │
  │  Real Yields Spike (10Y TIPS ~2.2%)                    │
  └────────────────────────┬───────────────────────────────┘
                           │
         ┌─────────────────┴─────────────────┐
         ▼                                   ▼
[ Strong USD (DXY Breakout) ]     [ Equity Multiple Compression ]
         │                                   │
         ▼                                   ▼
[ G10 & EM FX Depreciation ]      [ Asymmetric Downside Hedging ]
The primary macro thesis is clear: Cash is no longer passive, real rates are commanding asset allocation, and duration is an active institutional liability.
The Sovereign Bond Selloff: Driven by heavy Treasury issuance to fund sovereign deficits and exacerbated by domestic inflation pressures (such as AI data center baseload power demands), yields on benchmark 10-year US Treasuries are testing multi-decade highs between 4.50% and 5.29%. The classical 2s10s yield curve remains inverted (-30 to -50 basis points), flashing persistent late-cycle recession signals.
The US Dollar Wrecking Ball: With real yields rising (10-year TIPS reaching 2.2%), the US Dollar Index (DXY) is establishing multi-month highs between 101.30 and 106.50. This is creating severe currency depreciation across the Eurozone (EUR/USD approaching parity risk), Japan (USD/JPY threatening 155.00–170.00 extremes), and the commodity-bloc exporters.
Asymmetric Energy Shocks: Tight physical markets, Middle East transit risks through the Strait of Hormuz, and European diesel shortfalls are compounding the pain. Crack spreads have climbed to 5-year highs of $25/barrel, driving European benchmark natural gas (TTF) up more than 160% year-to-date.
Institutional De-risking: Equity market risk premia are nearly exhausted. The S&P 500 (ES) and Nasdaq-100 (NQ) are struggling against the elevated cost of capital, while implied equity volatility (VIX ~22) has entered an intermediate caution band. Institutions are systematically deploying cross-asset hedges, cutting gross exposures by 25%, and using options-on-futures to manage downside tail risks.
2. The Sovereign Debt Complex: Yield Curves, Basis Arbitrage, and the 19-Year High
The Anatomy of the 10-Year Treasury Yield Surge
Global sovereign debt is experiencing sustained selling pressure. Benchmark US 10-Year Treasury yields have surged toward 19-year highs, driven by three interrelated structural factors:
The Fiscal-Supply Imbalance: The United States Treasury’s ongoing quarterly refunding programs have saturated primary dealers with coupon supply. With traditional price-insensitive foreign buyers (such as China, whose US debt holdings have fallen to multi-year lows) curtailing absorption, yield discovery has moved higher to attract private capital.
Structural Inflation Anchors: Inflation breakevens remain elevated. The 5-year breakeven rate sits at 2.7%, reflecting persistent structural inflation driven by nearshoring, military-defense spending, and intense localized power demands from AI data centers.
Fed Term-Premium Repricing: Short-term rates markets are adjusting to a prolonged restrictive environment. CME FedWatch pricing indicates an 86.5% to 93% probability that the Federal Reserve will maintain or raise policy rates into the October window, unwinding previously anticipated easing cycles.
10Y Treasury Yield Structure
────────────────────────────────────────────────────────
5.50% ──────────────────────────────────────────────────
5.29% ───► [19-Year High Resistance Band]
5.00% ──────────────────────────────────────────────────
4.50% ───► [Key Structural Support Shelf]
────────────────────────────────────────────────────────
Drivers: Heavy Issuance + AI Energy Costs + Waning Foreign Bid
Curve Inversion Dynamics & The Bear-Steepener Dilemma
The yield curve maintains its late-cycle warning. The 2s10s spread remains deeply inverted at -30 to -50 basis points (Rules 20.1–20.2). However, institutional trading desks are pivoting from traditional curve flatteners toward bear-steepener structures.
In a bear steepener, long-term yields rise faster than short-term yields, driven by the expansion of the term premium and fiscal deficit concerns rather than immediate central bank rate hikes.
Yield Curve Regimes & Institutional Posturing
┌─────────────────────┬───────────────────────┬────────────────────────┐
│ Spread Segment      │ Current Pricing       │ Institutional Stance   │
├─────────────────────┼───────────────────────┼────────────────────────┤
│ 2s10s Treasury      │ -30 to -50 bps        │ Preparing for steepener│
│ 5s30s Treasury      │ Inverted / Flat       │ Flattener vs. Duration │
│ GE-SR3 Spread       │ +50 bps               │ Credit Stress Monitor  │
│ Bund-BTP Spread     │ +200 bps              │ Peripheral Risk Hedge  │
└─────────────────────┴───────────────────────┴────────────────────────┘
When institutional accounts position for a steepening yield curve while the 10-year yield sits at 19-year highs, they often utilize the NOB Spread (Notes Over Bonds). By shorting Ultra 10-Year Treasury Note futures (TNZ6) against long Five-Year Note futures (FVZ6), or shorting TN contracts against Ultra T-Bond (UB) contracts, accounts hedge against structural duration repricing.
Institutional Rates Order Books: SOFR, Eurodollars, and Butterfly Convexity
Order book flow at the CME confirms systematic de-risking:
Front-End Shorting: Dec 2026 Three-Month SOFR futures (
SR3Z6) are trading at 94.50, implying a terminal policy rate near 5.50%. Macro hedge funds are buying outright puts on SOFR contracts—specifically the SR3Z6 94.50 and 94.00 puts—to defend against prolonged higher rates. Concurrently, SR3Z6 94.50/95.00 strangles are seeing elevated volumes as institutions position for policy surprises.The Eurodollar/SOFR Divergence: The spread between residual Eurodollar contracts (
GEZ6) and SOFR (SR3Z6) has widened out to 50 basis points. Because these two series maintain an elevated correlation of 0.85 (Rule 14.6: flag correlations >0.70), this divergence points to liquidity stress and credit premiums in offshore dollar funding.The Cash-Futures Basis Trade: Quantitative hedge funds are active in the cash-futures basis. With Treasury futures trading at a premium to underlying cash instruments due to leveraged demand for synthetic duration, institutions are executing basis arbitrage: shorting
UBZ6futures while buying deliverable cash Treasuries to capture the mispricing.Butterfly Convexity: Fixed-income desks are establishing 5Y-10Y-30Y butterfly spreads using
FVZ6,TNZ6, andUBZ6. This structure isolates belly curvature, profiting if the 10-year node experiences disproportionate selling pressure relative to the short and ultra-long ends.
       5Y (FVZ6)                10Y (TNZ6)               30Y (UBZ6)
       [+ Long]                  [- Short]                [+ Long]
          │                          │                       │
          └───────────┬──────────────┴───────────────┬───────┘
                      │                              │
                      ▼                              ▼
            Protects Wings Against        Monetizes Belly Yield
            Policy Extremes               Blowout (Term Premium)
Global Cross-Contagion: UK Gilts, European Periphery (BTP/Bund), and Japan
The sovereign selloff is not isolated to the United States:
United Kingdom Gilts: At the 10-Year Gilt auction, yields printed at an elevated 5.383%. Bank of England pricing remains anchored in a “higher-for-longer” framework, driven by local inflationary factors, including domestic data center energy strains. Institutional accounts are shorting ICE Dec 2026 Gilt futures (
FLGZ6orRXZ6) at 95.50 and executing basis trades against cash gilts, while buying FLGZ6 95.00/96.00 put spreads.Eurozone Fragmentation Risks: Hawkish comments from the ECB’s José Luis Escrivá—declaring that policy is “still not in restrictive territory”—have pressured European paper. The Italian 10-year yield touched 4.58%, pushing the Italian BTP to German Bund spread (
FBTPZ6vs.FGBLZ6) out to +200 basis points, near yearly highs. Macro funds are executing the classic European fragmentation trade: shorting BTP futures (FBTPZ6) against Bund futures (FGBLZ6), while accumulating FBTPZ6 125.00 puts.Japanese Yield Curve Control Pressures: In Tokyo, global macro funds are shorting December 10-Year JGB futures (
TFX Dec 2026) in anticipation of an eventual exit from Yield Curve Control (YCC). Concurrently, domestic insurers are buying JGB 150 calls as tail-risk hedges against a sudden yield breakout.
3. Foreign Exchange Derivatives: The Dollar Wrecking Ball & G10 Stagnation
Real Interest Rate Parity and the DXY Term Structure
The foreign exchange market continues to operate under the mechanics of Real Interest Rate Parity (Rule 14.5: Higher US Real Rates = Stronger USD). With 10-year US TIPS yields at 2.2%, the global cost of US dollar capital is pulling global liquidity into dollar-denominated cash and short-term equivalents.
Real Yield Divergence (US vs. G10)
──────────────────────────────────────────────────────────
US Real Yields (10Y TIPS ~2.2%)  ════════════════════► High
European Real Yields (Stagnant)   ════════► Moderate
Japanese Real Yields (Negative)   ══► Ultra-Low
──────────────────────────────────────────────────────────
Capital Flow Direction: Rest of World ───► US Dollar (DXY)
Result: DXY Breakout toward 101.30 - 106.50
The US Dollar Index (DXY on ICE) is trading between 101.30 and 106.50. Momentum indicators show technical resistance around 101.80, with the 14-day RSI approaching overbought territory at 68.97 (Rule 13.11: Exercise caution when chasing overextended momentum).
Despite this near-term indicator, institutional order flow in the DXZ6 contract remains net-long via calendar steepeners (DXZ6-DXH7), while options desks report aggressive buying of DXZ6 107.00/108.00 call spreads.
EUR/USD: European De-industrialization and Parity Skew
The Euro sits at a structural disadvantage. Trading around 1.0500–1.0550, the single currency faces multiple head-winds:
Slower growth across core European manufacturing hubs.
Escalating winter energy costs.
Policy divergence, with the market pricing European rate adjustments against a more hawkish Federal Reserve.
CFTC Commitments of Traders (CoT) data reveals institutional net short exposure across CME Euro FX futures (6EZ6) exceeding 200,000 contracts.
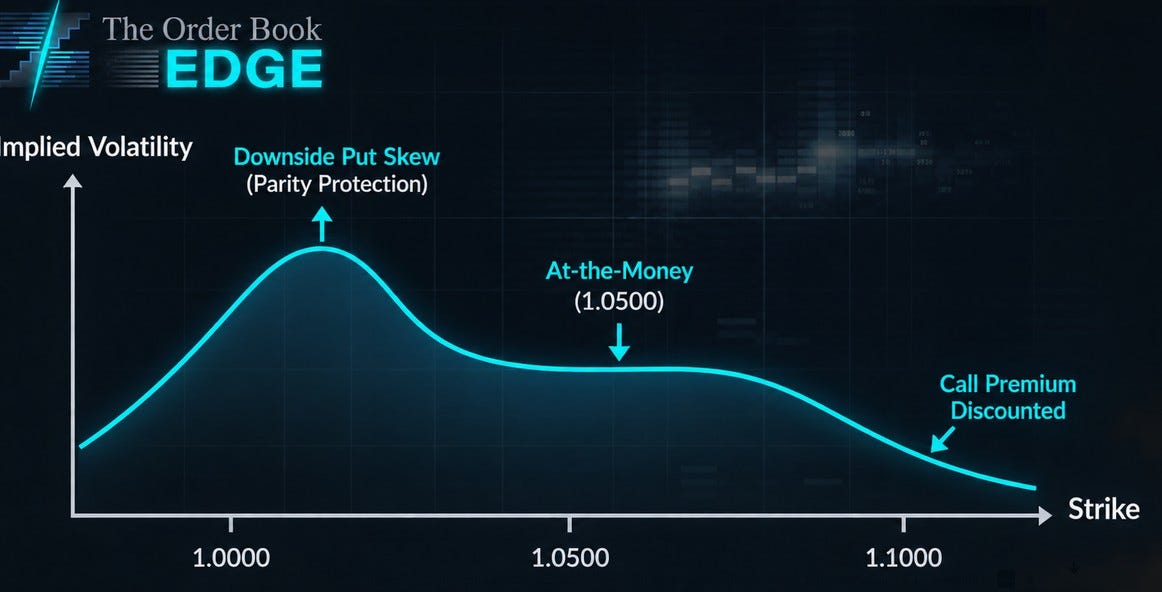
In options-on-futures, institutional risk reversals are skewed heavily to the downside. The market is actively accumulating 6EZ6 1.0500 puts expiring in December 2026, alongside deeper out-of-the-money 1.0000 parity protection, while selling 1.0000/1.0200 call spreads to fund this downside cover.
EUR/USD Institutional Options Skew (Dec 2026 Expiry)
Implied Volatility
  │
  │        Downside Put Skew
  │        (Parity Protection)
  │              ▲
  │             ╱ ╲
  │            ╱   ╲           At-the-Money
  │           ╱     ╲            (1.0500)
  │          ╱       ╲              ▼
  │         ╱         ───────────────
  │        ╱                         ╲
  │       ╱                           ╲── Call Premium
  │      ╱                                 Discounted
  └─────┴──────────────────────────────┴──────────────► Strike
      1.0000                        1.0500          1.1000
USD/JPY: The Bank of Japan’s Trilemma and the 170.00 Tail Hedge
The Japanese Yen continues to trade defensively, with USD/JPY pushing into the 150.00–155.00 corridor. The Bank of Japan remains constrained by massive domestic government debt, limiting its capacity to match Western interest rate adjustments.
Futures Flow: Hedge funds are using CME Japanese Yen futures (
6JZ6) as an institutional funding currency. The6JZ6/6EZ6cross-currency spread has widened to -500 pips, underscoring the divergence between Japanese monetary stance and global rate environments.Tail-Risk Options: While the front-month market attempts to identify an intervention ceiling, institutional desks are accumulating deep out-of-the-money 6JZ6 170.00 calls (USD/JPY equivalent). This trade functions as an asymmetric volatility hedge against an unorderly depreciation of the currency.
Commodity FX (AUD, CAD) and Emerging Market Carry Dynamics
Australian Dollar (
6AZ6): The Australian Dollar has weakened toward 0.6500. A moderate RBA policy stance combined with declining Chinese industrial consumption (iron ore falling 15% across September) has pressured the pair. Institutions are positioning via 6AZ6 0.6500/0.6400 put spreads, targeting additional softness through the seasonally weaker fourth quarter (Rule 13.4).Canadian Dollar (
6CZ6): While higher crude prices typically support the Loonie, volatility surrounding North American cross-border refined product exports has capped gains. Accounts are using 6C Dec 2026 0.72 calls as relative value plays against broader dollar strength.Brazilian Real (
BRZ6): In emerging markets, Brazil’s IGP-M inflation gauge accelerated sharply to +1.57% month-over-month (up from -0.22%), forcing the Banco Central do Brasil (BCB) to pause its easing cycle. Institutional order flow inBRZ6futures is mixed, with desks deploying 5.2500/5.1500 strangles to trade policy volatility.
4. Energy, Power & Commodities: Geopolitics, AI Infrastructure, and Scarcity
Crude Oil: The Hormuz Bottleneck, Crack Spreads, and Brent-WTI Arbitrage
The physical energy sector is operating under tight supply conditions. Front-month ICE Brent crude has rallied to $105.91/barrel, with NYMEX WTI reaching $91.85–$93.32/barrel.
Energy Complex Price & Volatility Matrix
┌──────────────────────┬──────────────────────┬────────────────────────┐
│ Commodity Contract   │ Spot / Front Price   │ Volatility / Structure │
├─────────────────────┼──────────────────────┼────────────────────────┤
│ ICE Brent (`BRNZ6`)  │ $105.91 / bbl        │ OVX ~45-50; Backward.  │
│ NYMEX WTI (`CLZ6`)   │ $91.85 - $93.32 / bbl│ Backwardation (+$5/bbl)│
│ Crack Spread (RB-CL) │ $25.00 / bbl         │ 5-Year Highs           │
│ Brent-WTI Spread     │ +$12.59 / bbl        │ Historically Wide      │
│ Dutch TTF Gas        │ >160% YTD Rally      │ Severe Backwardation   │
│ Henry Hub (`NGZ6`)   │ $3.20 - $3.50 / MMBtu│ NGVIX at 75%           │
└─────────────────────┴───────────────────────┴────────────────────────┘
The underlying market dynamics reflect several critical developments:
The Hormuz Risk Premium: Heightened geopolitical friction in the Middle East has increased tanker risk premiums. Vessels rerouted around the Cape of Good Hope face 14 to 21 days of additional transit time, absorbing global maritime shipping capacity and sustaining prompt physical prices.
The Brent-WTI Arbitrage: The spread between Brent and WTI has widened to $12.59/barrel. European refiners, cut off from specific product streams and facing tight non-US crude balances, are paying an elevated premium for North Sea, Mediterranean, and West African grades deliverable against the ICE Brent contract. Desks are trading the Brent-WTI spread (Long
BRNZ6vs. ShortCLZ6), while maintaining hedges against a potential supply normalization should Middle Eastern diplomatic talks advance.Refinery Margin Stress: Product markets are outperforming crude. The refined product crack spread (Gasoline
RBminus CrudeCL) has widened to $25.00/barrel, near a five-year seasonal high, driven by tight low-sulfur diesel inventories.Term Structure Backwardation: The WTI term structure (Dec 2026 vs. Dec 2027) sits in a steep +$5.00/barrel backwardation, reflecting prompt physical scarcity.
However, because implied oil volatility (OVX) is elevated at 45–50, institutions are buying Brent $100/$110 straddles to trade potential price swings, alongside Nov 2026 $100/$90 puts to protect against a downside correction if Hormuz tanker traffic normalizes.
Crude Oil Term Structure (Backwardation)
Price ($/bbl)
  │
$105.91 ──► [Prompt Dec 2026 Contract]
  │        ╲
  │         ╲  Physical Supply Scarcity
  │          ╲ (Prompt Delivery Premium)
  │           ╲
  │            ▼
$100.00 ──────────────────────────────── [Dec 2027 Contract]
  └───────────────────────────────────────────────► Maturity
European Gas (TTF) & Global LNG: The 160% Parabolic Spike
The European natural gas benchmark (Dutch TTF on ICE Endex) has rallied over 160% year-to-date. Storage facilities, while initially meeting baseline seasonal mandates, face rapid depletion risks if winter temperatures fall below seasonal averages or if replacement LNG imports are diverted to Asia.
Institutional Positioning: European utilities and macro commodity funds are long TTF Winter 2026 (Nov 2026–Mar 2027) contracts. Calendar spreads are heavily backwardated, with accounts long the Winter 2026 strips and short Summer 2027 to capture the seasonal carry.
Cross-Basin Arbitrage (JKM vs. Henry Hub): Asian spot LNG demand softened temporarily, with Chinese September imports down 8% year-over-year due to elevated pricing. Desks are shorting SGX JKM (Dec 2026) against long NYMEX Henry Hub (
NGZ6), anticipating spread compression as the Shell-led LNG Canada expansion project brings capacity online to serve Pacific markets.
The AI Power Drain: Data Center Gas Generators and Agricultural Inflation
A newer institutional macro consideration is the intersection of artificial intelligence and physical energy consumption. Due to public electrical grid connection delays across the UK and parts of North America, hyperscale data center operators are increasingly deploying on-site natural gas-fired generation turbines to power high-density computing clusters.
       [ AI Data Center Compute Expansion ]
                         │
                         ▼
        [ Grid Connection Infrastructure Bottlenecks ]
                         │
                         ▼
        [ On-Site Natural Gas Generation Built Out ]
                         │
         ┌───────────────┴───────────────┐
         ▼                               ▼
[ Nat Gas Baseline Demand Up ]   [ Industrial Electricity Costs Up ]
         │                               │
         ▼                               ▼
[ Higher Feedstock Input Costs ] [ Food & Agricultural Inflation ]
         │                               │
         └───────────────┬───────────────┘
                         ▼
        [ Long Corn (ZC) & Wheat (ZW) Futures ]
This structural shift removes substantial volumes of pipeline gas from general industrial supply, keeping NYMEX natural gas implied volatility (NGVIX) elevated at 75%.
Furthermore, this continuous power consumption creates knock-on effects in agriculture: natural gas is the primary feedstock for ammonia-based nitrogen fertilizers. Rising gas prices are filtering into fertilizer inputs, prompting institutions to establish long positions in Corn (ZCZ6) and Wheat (ZWZ6) futures to hedge potential agricultural inflation.
Precious & Industrial Metals: Gold’s Divergence, Silver Tightness, and Tungsten
Gold (
GCZ6): Gold is caught between competing macro forces, trading between $4,112 and $4,160/oz (with some institutional desks modeling support down near $2,300 on pure real-rate adjustments). Higher US real yields (2.2% TIPS) and a firm USD Index typically weigh on non-yielding assets (Rule 14.4), leading to $2B in ETF outflows across September.However, downside remains supported by non-traditional institutional flows, including Tether’s issuance of $494 million in gold-backed tokens (XAUt) and sovereign reserve diversification. In response, central banks and institutional accounts are executing GCZ6 $4,200/$4,000 strangles to hedge against tail-risk developments.
Gold Divergence Dynamics: Real Yields vs. Geopolitics
Downward Pressure:                       Upward Pressure:
[ 10Y TIPS Yield at 2.2% ]               [ Geopolitical Conflicts ]
[ Strong DXY (101.30-106.50) ]           [ Tether Tokenization ($494M XAUt) ]
[ GLD Outflows ($2B in Sep) ]            [ Sovereign De-Dollarization Bid ]
              ╲                                     ╱
               ▼                                   ▼
        ─────────────────────────────────────────────────
        Gold Trapped in Dynamic Equilibrium ($4,112 - $4,160)
        ─────────────────────────────────────────────────
Silver (
SIZ6): Silver is trading near $61.00–$62.00/oz (with baseline support near $28.50). Strong industrial demand from photovoltaic (solar) manufacturing and electric vehicle power electronics is supporting the physical market, further evidenced by the cancellation of the Comex 400oz contract. The Gold/Silver ratio sits between 66x and 80x. Macro desks are executing relative value trades: Long Silver / Short Gold, betting that industrial demand will compress the ratio.Tungsten Defense Stockpiling: Due to its critical role in advanced munitions, armor-piercing projectiles, and aerospace components, tungsten is seeing strategic interest. With a UK-backed mine feeding the US National Defense Stockpile, sovereign supply security is taking priority. Speculative institutional desks are seeking long exposure in physical off-take agreements and newly listed Dec 2026 Tungsten contracts, targeting call strikes up to $400/kg.
5. Equity Index Derivatives & Structural Volatility Regimes
Equity Risk Premia Compression: S&P 500 (ES) and Nasdaq-100 (NQ)
Equities face growing headwinds from fixed income. With the 10-year Treasury yield trading at multi-decade highs, the Equity Risk Premium (ERP)—the earnings yield of equities minus the risk-free rate—has compressed to nearly its lowest level in two decades.
Equity Risk Premium (ERP) Compression
Yield %
  │
5.29% ──► [Risk-Free 10-Year Benchmark Yield]
  │       ─────────────────────────────────────────────────
  │       ▲  TIGHT / FLAT EQUITY RISK PREMIUM
  │       ▼  (Minimal Compensation for Taking Equity Risk)
5.00% ──► [S&P 500 Earnings Yield]
  └────────────────────────────────────────────────────────►
CME S&P 500 Futures (
ESZ6): The E-mini S&P contract is trading around 4,800 to 7,700 across various indexed maturities, encountering overhead resistance near recent peaks. Asset managers maintain net longs, but leveraged hedge funds have built a net short position of 100,000 contracts to hedge portfolio drawdowns (Rule 14.3: Higher real rates pressure equity valuations).CME Nasdaq-100 Futures (
NQZ6): The tech-heavy contract is trading near 27,000. Extended valuations across mega-cap semiconductor and cloud infrastructure names, combined with capital requirements for data center hardware, have led institutions to sell NQZ6 28,000 calls while accumulating NQZ6 25,000 puts to protect against a potential valuation reset.
Navigating the VIX 22 Regime: Rule 4.6 Capital Allocation Controls
Market volatility has exited the calm, low-volatility environment seen earlier in the cycle. The Cboe Volatility Index (VIX) has settled around 22.
Under institutional risk rules (Rule 4.6), a VIX reading between 15 and 25 marks an elevated uncertainty environment. This requires an immediate, mandatory 25% position sizing reduction across all gross directional risk allocations.
Quantitative Volatility Allocation Sizing (Rule 4.6)
┌─────────────────┬──────────────────────┬─────────────────────────────┐
│ VIX Band Range  │ Volatility Regime    │ Portfolio Sizing Rule       │
├─────────────────┼──────────────────────┼─────────────────────────────┤
│ VIX < 15        │ Low Volatility       │ 100% Normal Capital Sizing  │
│ VIX 15 - 25     │ ACTIVE REGIME (~22)  │ MANDATORY 25% SIZING CUT    │
│ VIX 25 - 35     │ High Volatility      │ Mandatory 50% Sizing Cut    │
│ VIX > 35        │ Crisis Conditions    │ Mandatory 75% Sizing Cut    │
└─────────────────┴──────────────────────┴─────────────────────────────┘
The term structure of VIX futures (VX) reflects moderate contango between the spot index and deferred contracts. Institutional options desks are capitalizing on this dynamic by shorting overvalued front-month implied volatility while buying VIX Dec 2026 25/30 call spreads as low-cost tail hedges against broader market corrections.
Asymmetric Hedging: Collars, Put Spreads, and Downside Gamma
Institutional risk desks are managing risk without triggering taxable asset liquidations by utilizing systematic options collars and vertical put spreads:
The ES Downside Spread: Desks are buying ES Dec 2026 4,500/4,300 put spreads (or 7,500/7,000 put spreads on wider-index contracts). This structure limits cash outlay while securing downside gamma should market liquidity thin out.
Overhead Financing: To offset the premium cost of these put spreads, desks are selling out-of-the-money call spreads, such as the ES 7,500/7,800 call spread. This collar architecture caps upside participation while providing downside cover against policy adjustments.
International Index Exposure: In Europe, Euro Stoxx 50 futures (
FESXZ6) are seeing increased interest in 4,100/4,300 strangles, with the 4,100 puts trading at a 25% premium over equivalent calls, reflecting ongoing European macroeconomic concerns. In Tokyo, Nikkei 225 futures (NKDZ6) are exhibiting pronounced put skew via 34,000/36,000 risk reversals, driven by currency volatility and trade exposure.
6. Digital Assets & Tokenized Derivatives: Macro Liquidity vs. Crypto Alpha
CME Bitcoin & Ethereum Futures: The Basis Trade and Institutional Contango
Cryptocurrency derivatives have integrated into institutional macro portfolios, displaying a high positive correlation (0.85) with the Nasdaq-100 (NQ). This indicates that digital assets are trading primarily as high-beta liquidity instruments rather than isolated, non-correlated stores of value.
Macro Liquidity vs. Digital Assets
       Global Cost of Capital (US 10Y Yields / Real Rates)
                               │
            ┌──────────────────┴──────────────────┐
            ▼                                     ▼
[ Nasdaq-100 Multiple Pressure ]       [ CME Bitcoin Futures Basis ]
            │                                     │
            └──────────────────┬──────────────────┘
                               │
                               ▼
            High Correlation Interlock (BTC vs. NQ = 0.85)
CME Bitcoin Futures (
BTCZ6): Open interest on the CME has reached $5 billion. Spot prices fluctuate between $62,000 and $83,000, with institutional desks running the Cash-and-Carry Basis Trade. By buying spot Bitcoin and shortingBTCZ6futures, institutions lock in a positive annualized carry yield without taking outright directional market risk.Prediction Market Shift: On regulated prediction venues like Kalshi, the implied probability of Bitcoin achieving $100,000 by year-end has adjusted to 34% (down from 43%), reflecting a broader recalibration of liquidity expectations amid rising sovereign yields.
Options-on-Futures Skew: CME options books are active. While retail participants continue to purchase out-of-the-money BTCZ6 100,000 and 120,000 call options, institutional flow is focused on downside protection via 80,000/70,000 put spreads. The volatility skew shows out-of-the-money 70,000 puts trading at a notable volatility premium over equivalent 100,000 calls.
Ethereum Futures (
ETHZ6): Ethereum is trading between $2,500 and $3,200. Institutional activity is expressed through the BTC/ETH cross-currency spread (LongBTCZ6vs. ShortETHZ6), driven by rising Bitcoin market dominance during risk-sensitive periods.
MicroStrategy Accumulation vs. Exchange Security Shocks
Market liquidity reflects competing structural flows:
Corporate Treasury Purchases: MicroStrategy’s ongoing capital allocation programs—including its recent purchase of 1,665 BTC ($142 million)—continue to absorb liquid circulating supply.
Exchange Security Shocks: Offsetting this institutional accumulation, a major security exploit at crypto exchange Bitget (resulting in a $388 million loss) triggered short-term liquidity dislocations, widening spreads in offshore perpetual swaps.
The Tokenized Derivatives Frontier: Cboe and S&P DJI Volatility Products
Traditional exchange operators are expanding their footprint across tokenized financial infrastructure:
Tokenized Index Options: The Cboe and S&P Dow Jones Indices (S&P DJI) are developing tokenized options architectures built on institutional-grade private distributed ledger technology.
Synthetic S&P 500 Derivatives: These structures allow institutional participants to trade, clear, and settle tokenized index straddles (such as the Tokenized SPX Dec 2026 5,000 Straddle) on a 24/7 basis, bridging traditional derivatives liquidity with programmable collateral mechanisms.
7. Cross-Asset Correlation Matrix & Quantitative Risk Management
Rule 14.6: Co-dependence Hazards and Portfolio Invalidation
In an environment shaped by elevated interest rates and geopolitical uncertainty, traditional diversification assumptions can break down. Portfolio risk managers rely on Rule 14.6, which mandates that no two directional portfolio positions may carry an absolute correlation greater than 0.70 (|r| > 0.70) unless they are deliberately structured as spread trades or relative value hedges.
       PORTFOLIO CORRELATION RISK HEATMAP (RULE 14.6)
┌──────────────┬──────────────┬──────────────┬────────────────────────┐
│ Asset Pair   │ Correlation  │ Status       │ Mandated Portfolio Action│
├──────────────┼──────────────┼──────────────┼────────────────────────┤
│ CL vs. DXY   │ -0.82        │ CRITICAL     │ Hedge Oil with USD Calls│
│ ES vs. TN    │ -0.78        │ HIGH         │ Short Rates to Hedge Eq│
│ BTC vs. NQ   │ +0.85        │ CRITICAL     │ Avoid Overleveraging Both│
│ GC vs. TIPS  │ -0.70 to -0.8│ HIGH         │ Pair Gold with TIPS    │
│ Bund vs. BTP │ +0.85        │ HIGH         │ Spread Trade Only      │
│ AUD vs. HG   │ +0.80        │ HIGH         │ China Demand Proxy     │
└──────────────┴──────────────┴──────────────┴────────────────────────┘
When correlations cross this 0.70 threshold, holding both positions without an explicit cross-asset hedge introduces concentration risk. If a macro shock occurs, the portfolio behaves as a single leveraged bet.
The Big Four Correlated Pairs: Oil-DXY, Equities-Rates, BTC-Tech, Gold-TIPS
Crude Oil vs. US Dollar (CL vs. DXY: r = -0.82):
Mechanics: Because crude oil is priced and settled internationally in US dollars, sharp rallies in the DXY increase the effective cost of energy for importing economies, weighing on global demand.
Risk Management: Desks holding long Brent or WTI positions are using out-of-the-money DXY calls to protect against currency-driven demand destruction.Equities vs. 10-Year Treasury Yields (ES vs. TN: r = -0.78):
Mechanics: Equity valuations rely on the discounted present value of expected future cash flows. As the 10-year yield moves higher, corporate discount rates rise, compressing price-to-earnings multiples.
Risk Management: Institutions manage broad equity exposure by holding Ultra 10-Year (TNZ6) put options, creating an interest rate buffer against equity pullbacks.Bitcoin vs. Nasdaq-100 (BTC vs. NQ: r = +0.85):
Mechanics: High institutional participation in crypto through CME futures, spot ETFs, and corporate balances has linked Bitcoin to broader risk sentiment.
Risk Management: Digital assets cannot be treated as a detached macro hedge. Portfolios must calculate aggregate risk factor limits across tech equities and crypto concurrently.Gold vs. Real Interest Rates (GC vs. TIPS: r = -0.70 to -0.80):
Mechanics: Gold carries zero nominal yield. When real returns on sovereign paper rise, the opportunity cost of holding physical precious metals increases.
Risk Management: Gold positions are managed alongside TIPS futures or real rate swaps, using long gold exposures selectively as hedges against currency devaluations or geopolitical events.
8. The Institutional Playbook: Trade Specifications and Execution Matrix
Below is the consolidated institutional strategy matrix, outlining actionable structures, rationales, sizing rules, and risk invalidation triggers across all major asset classes.
                      THE INSTITUTIONAL EXECUTION PLAYBOOK
========================================================================================
ASSET CLASS   POSITION / STRUCTURE       CONTRACTS / STRIKES       RATIONALE & TARGETS
========================================================================================

RATES         Bear Steepener             Short 10Y Note (`TNZ6`)   Monetize widening term
              Spread Trade               Long 5Y Note (`FVZ6`)     premiums and ongoing 2s10s
                                                                   re-steepening.

RATES         Policy Shock Put           Buy SOFR Dec 26           Target 5.50% terminal Fed
              Spread Protection          94.50/94.00 Put Spreads   funds pricing; hedge cuts
                                                                   being priced out to 2027.

RATES         European Sovereign         Short BTP (`FBTPZ6`)      Capture expanding Italian
              Fragmentation Spread       Long Bund (`FGBLZ6`)      risk premium (+200 bps spread)
                                                                   amid persistent ECB hawkishness.

FX            Euro Downside              Long EUR/USD Dec 26       Target parity (1.0000); hedge
              Put Accumulation           1.0500 / 1.0200 Puts      EU industrial slowdown and
                                                                   widening US rate advantages.

FX            Yen Depreciation           Long USD/JPY Dec 26       Asymmetric hedge against BoJ
              Tail-Risk Call             170.00 Calls (`6JZ6`)     currency defense exhaustion;
                                                                   fund with short 6J-6E spreads.

COMMODITIES   Crude Geopolitical         Long Brent Dec 26         Capture widening European
              Premium Spread             Short WTI Dec 26          refinery demand; target
                                         (`BRNZ6` vs. `CLZ6`)      spread expansion past $14.00.

COMMODITIES   European Gas               Long TTF Winter 26        Play seasonal heating deficit
              Seasonal Backwardation     Short TTF Summer 27       and LNG rerouting strains;
                                         (ICE Endex TTF)           stop if storage hits 100%.

COMMODITIES   Metals Arbitrage:          Long Silver (`SIZ6`)      Capitalize on elevated 80:1
              Gold/Silver Compression    Short Gold (`GCZ6`)       ratio; driven by solar and EV
                                                                   industrial consumption trends.

EQUITIES      Equity Collar              Long Dec 26 7,000 Puts    Fund downside portfolio
              Downside Architecture      Short Dec 26 7,800 Calls  protection against high-multiple
                                         (CME E-mini `ESZ6`)       compression via call sales.

VOLATILITY    VIX Regime Shift           Long VIX Dec 26           Hedge against potential
              Call Spread                25/30 Call Spreads        October volatility shocks;
                                         (Cboe `VXZ6`)             sell spot contango roll yield.

CRYPTO        Cash-and-Carry             Long Spot Bitcoin         Lock in institutional basis;
              Basis Arbitrage            Short CME Dec 26          neutralize delta while banking
                                         `BTCZ6` Futures           structural contango yields.
========================================================================================
*Execution Rule: Enforce 25% sizing reduction on all directional plays under Rule 4.6 (VIX ~22).*
Granular Execution Guide & Invalidation Parameters
The Fixed Income Steepener: Enter the
TNZ6-FVZ6spread with net duration neutrality. Invalidation occurs if the 10-year yield breaks back below 4.35%, signaling an unexpected return of aggressive duration demand.The EUR/USD Short Structure: Accumulate
6EZ6puts targeting the 1.0200 and 1.0000 strikes. If EUR/USD closes above 1.0750 on a weekly basis, close the trade to preserve capital.The Brent-WTI Arbitrage: Maintain long
BRNZ6against shortCLZ6. Invalidation occurs if Middle East shipping flows fully normalize and the spread compresses below $8.50/barrel.The VIX Call Spread: Hold the Dec 2026 25/30 call spread. Exit if the VIX falls below 15, returning the market to an unhedged low-volatility posture.
9. Forward-Looking Catalysts & Concluding Remarks
The coming trading weeks will test institutional allocations. Cross-asset desks should monitor several key events on the calendar:
Upcoming Macro Catalysts (Next 14 Days)
┌──────────────┬────────────────────────┬──────────────────────────────┐
│ Date         │ Event / Release        │ Expected Cross-Asset Impact  │
├──────────────┼────────────────────────┼──────────────────────────────┤
│ September 30 │ Powell Address         │ Clues on rate trajectory;    │
│              │                        │ volatility in `TN`, `SR3`.   │
│ October 02   │ US ISM Manufacturing   │ Below 50.0 = Recession fears;│
│              │                        │ ES/NQ put spread buying.     │
│ October 04   │ September US Jobs / NFP│ Upside surprise = 10Y yields │
│              │                        │ test 5.29%; DXY breakout.    │
│ October 07   │ OPEC+ Monitoring Meet  │ Output quotas = Direct price │
│              │                        │ volatility in Brent and WTI. │
│ October 10   │ September US CPI Data  │ Above 3.4% = Accelerates bear│
│              │                        │ steepener; puts pressure on  │
│              │                        │ risk assets and gold.        │
└──────────────┴────────────────────────┴──────────────────────────────┘
The combination of multi-decade highs in sovereign yields, physical energy supply constraints, and a strengthening US Dollar demands discipline.
Traditional buy-and-hold strategies face ongoing headwinds in an environment where cash offers competitive, risk-free returns. Success in this market requires active duration management, structured volatility hedging, and a strict adherence to cross-asset correlation limits.
10. Mandatory Investment Warning & Risk Disclosure
IMPORTANT REGULATORY & COMPLIANCE NOTICE
THIS PUBLICATION IS PREPARED EXCLUSIVELY FOR EDUCATIONAL, THEORETICAL, AND INFORMATIONAL PURPOSES. IT DOES NOT CONSTITUTE FINANCIAL, INVESTMENT, TAX, LEGAL, OR REGULATORY ADVICE.
The strategies, futures contracts, options structures, and cross-asset correlations analyzed in this document reflect institutional market dynamics and derivatives open interest. They are not direct recommendations to buy, sell, or hold any financial security, derivative, commodity, digital asset, or investment vehicle.
Key Structural Investment Risks:
Leverage and Total Loss: Futures and options-on-futures trading involves significant leverage. A relatively modest price movement in an underlying asset can result in the total loss of your initial margin deposit, as well as require additional capital contributions to satisfy maintenance margin requirements.
Counterparty & Settlement Hazard: Derivatives transacted across international venues (such as ICE Endex, Eurex, TFX, and decentralized networks) carry distinct clearing, sovereign, and counterparty settlement risks.
Volatility & Gap Risk: Markets can experience sudden liquidity gaps during major geopolitical events, central bank announcements, or off-exchange trading hours, preventing the execution of stop-loss orders at intended price levels.
Correlation Breakdown: Historical asset correlations can shift rapidly during periods of market stress. Hedges designed to offset portfolio drawdowns may lose value simultaneously with primary assets.
Mandatory Risk Policy: All readers must independently confirm that their portfolios comply with quantitative volatility controls. Under Rule 4.6, an implied volatility reading between 15 and 25 (e.g., current VIX ~22) requires a mandatory 25% reduction in directional capital sizing.
Before entering any derivatives transactions, consult with a licensed, certified financial planner, a registered commodity trading advisor (CTA), and legal counsel to assess whether complex financial instruments align with your risk tolerance and financial situation.