


Confidential / Educational Only: Not investment advice. Seek professional financial counsel before deploying capital.
Executive Summary & Weekly Thesis
Global markets have entered an aggressive volatility regime characterized by supply-chain shocks, monetary policy cross-currents, and geopolitical fractures. With the CBOE Volatility Index (VIX) oscillating between 18 and 22, institutional trading desks are actively triggering portfolio rules—notably Rule 4.6, mandating an immediate 25% reduction in gross risk exposure—while realigning positioning around stagflationary resilience.
The fundamental narrative of late September 2026 is driven by three macro pillars:
A Severe Geopolitical Supply Chokepoint: Escalating conflict in the Middle East—marked by a de facto Strait of Hormuz blockade driven by Iran-Houthi actions, direct strikes on critical Saudi processing infrastructure (Yanbu refining hub and Qatari Ras Laffan LNG export trains), and a 258% surge in oil shipping/freight costs over the past two months.
Hawkish Central Bank Divergence: A Federal Reserve that recently raised rates by 25 basis points to a 3.75%–4.00% target range under Chair Warsh, backed by a dot-plot showing 16 of 19 FOMC participants projecting at least one more rate increase in 2026. Concurrently, the Bank of Canada (BoC) has issued warnings regarding inflation stickiness as crude approaches $100/bbl, driving a bear flattening across global rate curves and forcing the US 2s10s curve into inversion (-25 bps to -35 bps).
Selective Risk-Asset Breakouts: A tech-led advance in the Nasdaq-100 (driven by semiconductor AI demand pushing bellwethers like AMD to a $1 trillion market cap) clashing directly with an equity breadth breakdown (only 22% of S&P 500 components outperforming). Concurrently, institutional crypto adoption is accelerating, with Bitcoin executing a clean breakout above $85,000–$86,000 and Ethereum futures open interest reaching 9-month highs.
       +-------------------------------------------------------------+
       |             MACRO RISK ARCHITECTURE (SEPT 2026)             |
       +-------------------------------------------------------------+
                                      |
         +----------------------------+----------------------------+
         |                                                         |
         v                                                         v
+-----------------------------+                           +-----------------------------+
|    GEOPOLITICAL SUPPLY      |                           |     MONETARY DIVERGENCE     |
|         CHOKEPOINTS         |                           |       & RATES PRESSURE      |
+-----------------------------+                           +-----------------------------+
| • Hormuz Blockade (~20% oil)|                           | • Fed hikes to 3.75%-4.00%  |
| • Freight rates +258% (2 mo)|                           | • 16/19 FOMC members see +1 |
| • Saudi/Yanbu infra strikes |                           | • BoC: oil near $100 sticky |
| • Ras Laffan LNG offline 17%|                           | • 2s10s inverted (-25/-35bp)|
+-----------------------------+                           +-----------------------------+
         |                                                         |
         +----------------------------+----------------------------+
                                      |
                                      v
       +-------------------------------------------------------------+
       |               TOP LUCRATIVE ASYMMETRIC TRADES               |
       |  1. Brent-WTI Spread & CLZ6 $100/$110-$120 Call Structures  |
       |  2. 10Y Treasury (TYZ6/ZNZ6) Put Spreads & 2s10s Steepeners |
       |  3. Gold Outperformance: Dec26 Upside Call Spread Accum.    |
       |  4. Crypto Basis Arbitrage & ETH/BTC Long Relative Value    |
       +-------------------------------------------------------------+
The Most Lucrative Opportunity for the Week Ahead
The single most lucrative asymmetric trade for the coming week resides in Energy Volatility & Cross-Regional Spreads: specifically, Long Brent vs. Short WTI (BRN-CL Dec 2026 spread) combined with December 2026 WTI $100/$110 call debit spreads (or $100/$120 call butterflies).
This trade monetizes the expanding physical supply deficit in European and Asian import hubs caused by the Strait of Hormuz bottleneck and attacks on Yanbu, while exploiting the relative inventory buffer on the US Gulf Coast. With crude oil implied volatility (OVX) at 45–55% and refining crack spreads surging across diesel (HO) and jet fuel (HEAT), energy is pricing in structural dislocations that standard equity indices have yet to reflect.
Macro Environment & Institutional Hedging Flow
1. The Geopolitical Energy Chokepoint & Supply Shocks
The global crude and natural gas supply chain is absorbing its most severe shock of 2026. Maritime transit constraints in the Red Sea and the Strait of Hormuz have trapped approximately 20% of daily global crude flows. Saudi Arabia’s strategic pivot—rerouting export barrels from Arabian Gulf terminals overland to Red Sea ports such as Jeddah and Yanbu—has run into direct disruption following missile and drone incursions on Yanbu’s 6.5 million barrel-per-day refining and terminal complex.
+--------------------------------------------------------------------------+
|                  MIDDLE EAST SUPPLY BOTTLENECK PROFILE                   |
+--------------------------------------------------------------------------+
| Disruption Vector        | Strategic Impact          | Derivative Impact  |
+--------------------------+---------------------------+-------------------+
| Strait of Hormuz         | ~20% global flows impeded | Dec26 Brent call  |
| Transit Risk             | VLCC freight up 258%      | skew steepening   |
|                          |                           |                   |
| Yanbu Refining Hub       | Saudi 6.5M bpd capacity   | Crack spreads surge|
| Incursions               | threatened; export drag   | HO/RB long calls  |
|                          |                           |                   |
| Ras Laffan Strike        | 17% Qatar LNG offline     | ICE TTF / Platts  |
| (2 Liquefaction Trains)  | European storage at 85%   | JKM call buying   |
+--------------------------+---------------------------+-------------------+
Concurrently, European gas security has deteriorated following drone and missile damage to Qatar’s Ras Laffan complex, knocking out two liquefaction trains (representing ~17% of Qatari export capacity). European natural gas storage levels currently sit at 85%—well below the 90% winter mandate.
In derivatives markets, this has triggered steepening backwardation in front-to-deferred spreads and elevated implied volatility (IV) across front-month contracts. Implied volatility term structures in crude (CL and BRN) and European gas (TTF) display upside call skew: institutions are actively selling out-of-the-money puts ($80–$90 strikes) to finance high-delta call spreads targeting $110 to $120 oil and €35–€40/MMBtu gas.
2. Monetary Cross-Currents: The Warsh Fed, BoC Hawkishness, and Rates Repricing
Fixed income markets are contending with renewed monetary tightening. The Federal Reserve’s 25 bps hike to 3.75%–4.00%, combined with Chair Warsh’s explicit guidance linking energy prices to sticky core personal consumption expenditures, has dismantled easing bets for late 2026.
Fed Funds Futures (FFZ6): December 2026 contracts are pricing at 4.25%, implying a 50% probability of an additional hike before year-end, up from 20–30% earlier this month.
SOFR Derivatives (SR3Z6): Large institutional flows have accumulated in 96.00/96.50 call spreads (equivalent to 4.00%–3.50% yields), reflecting hedge fund demand for protection against prolonged high policy rates.
The Bank of Canada Factor: Governor Macklem’s inflation warning—noting that sustained $100 oil will force the central bank’s hand—has driven an aggressive repricing in Canadian Bankers’ Acceptance futures (BAX). Dec 2026 BAX contracts now price a ~40% probability of a 25 bps hike.
       +--------------------------------------------------------+
       |               GLOBAL RATES & YIELD CURVES              |
       +--------------------------------------------------------+
                                   |
         +-------------------------+-------------------------+
         |                                                   |
         v                                                   v
+-------------------------------+   +-------------------------------+
|     US TREASURY 2s10s CURVE   |   |   CANADIAN RATES / BAX FLOWS  |
+-------------------------------+   +-------------------------------+
| • Inverted: -25 to -35 bps    |   | • BAX Dec26: 40% hike odds    |
| • TYZ6 (10Y) heavy selling    |   | • CGB 10Y vs US 10Y widening  |
| • 120/118 Put Spreads active  |   | • BoC hawkish on $100 crude   |
| • Long TU / Short TY steepener|   | • Short USDCAD (target 1.30)  |
+-------------------------------+   +-------------------------------+
The US yield curve has inverted deeper into negative territory (-25 to -35 bps on the 2s10s spread). This dynamic has elevated the MOVE index to 110–120. Institutions are executing curve steepener trades (long 2-Year TU / short 10-Year TY and ZN, or short front-month Eurodollar GEZ6 / long back-end GEZ8) to anticipate an eventual policy error or un-inversion.
3. VIX Regime Mandates & Systematic Positioning
With the spot VIX operating in the 18 to 22 zone, systematic institutional risk overlays have turned defensive. Under Rule 4.6, portfolio managers are operating under an automated protocol:
Gross Risk Reduction=25%when 15≤VIX≤25\text{Gross Risk Reduction} = 25\% \quad \text{when } 15 \le \text{VIX} \le 25Gross Risk Reduction=25%when 15≤VIX≤25
This systematic deleveraging is directly visible in equity market internals:
Institutional Flow Metric             Current Level / State       Strategic Interpretation
S&P 500 Breadth (% > 50 DMA)          22%                         Severe narrow leadership; AI megacaps masking broad weakness
SPY Put Flow (Notional Volume)         $1.0 Billion traded         Heavy institutional hedging via Dec 5000/4800 put spreads
CBOE Volatility Index (VIX)           18.0 - 22.0                 Triggers Rule 4.6 (mandatory 25% portfolio risk reduction)
Crude Oil Implied Vol (OVX)           45.0% - 55.0%               Extreme geopolitical tail-risk pricing; call skew dominant
Treasury Volatility (MOVE)            110 - 120                   Elevated rate path uncertainty; puts favored on 10Y futures
The Top 5 Lucrative Trades for the Upcoming Week
The following five trades present the highest risk-adjusted expectancy based on institutional order flow, volume concentration, and macro catalysts.
+--------------------------------------------------------------------------------------------------------------------------------+
|                                    TOP 5 INSTITUTIONAL TRADE SETUPS (WEEK OF SEPT 21, 2026)                                    |
+---+----------------------+--------------------+-----------------------------+-----------------------+--------------------------+
| # | Trade Theme          | Asset / Instrument | Derivative Structure        | Primary Catalyst      | Risk / Exit Metric       |
+---+----------------------+--------------------+-----------------------------+-----------------------+--------------------------+
| 1 | Geopolitical Supply  | WTI (CL) &         | Long Dec26 BRN / Short CL   | Hormuz Blockade,      | Exit if Brent premium    |
|   | Shock                | Brent (BRN)        | + CLZ6 $100/$110 Call Sprd  | Yanbu Refinery Strike | narrows below $4.00      |
+---+----------------------+--------------------+-----------------------------+-----------------------+--------------------------+
| 2 | Safe-Haven /         | Gold Futures       | Long Dec26 GC $2,600/$2,700 | Fed Pivot Tail Risk,  | Stop-out if GC breaks    |
|   | Debasement           | (COMEX: GC)        | Call Spreads                | Stagflationary Hedge  | below $2,420 support     |
+---+----------------------+--------------------+-----------------------------+-----------------------+--------------------------+
| 3 | Rates Policy Error   | 10Y Treasuries     | Long TYZ6 120/118 Put Sprd  | Hawkish Fed Warsh,    | Close if 10Y yield       |
|   | Hedge                | (TY / ZN)          | + Long TU / Short TY Curve  | BoC $100 Oil Warning  | drops back below 4.00%   |
+---+----------------------+--------------------+-----------------------------+-----------------------+--------------------------+
| 4 | Crypto Breakout &    | CME Bitcoin &      | Cash-and-Carry Basis        | $86K Breakout, ETH    | Exit if BTC basis turns  |
|   | Relative Value       | Ethereum (BTC/ETH) | + Long ETH / Short BTC Sprd | ETF / OI Expansion    | negative or ETH/BTC drops|
+---+----------------------+--------------------+-----------------------------+-----------------------+--------------------------+
| 5 | Cross-Border Supply  | Grains vs.         | Short CME Urea Dec26        | Belarus Potash Deal,  | Stop if Belarus deal     |
|   | Chain Pivot          | Fertilizer (C/S/M) | + Long Corn (C Dec26)       | Cheaper Farm Inputs   | collapses in Congress    |
+---+----------------------+--------------------+-----------------------------+-----------------------+--------------------------+
Trade #1: Geopolitical Supply Shock – The Brent-WTI Spread & WTI Dec 2026 Call Architecture
The Macro & Quantitative Rationale
The escalation in the Middle East has fractured the global crude transportation complex. With the Strait of Hormuz facing transit blockades and VLCC tanker rates up 258% over the past two months, seaborne Brent crude is pricing an immediate geopolitical security premium over landlocked, pipeline-dependent WTI.
Furthermore, Houthi strikes on Yanbu have threatened Saudi Arabia’s primary alternative export channel to the Red Sea, cutting off spare capacity buffers. While US shale output continues to flow toward domestic refineries, coastal European and Asian refineries are facing prompt supply shortages.
Refined product crack spreads—particularly heating oil (HO) and jet fuel (HEAT)—are widening, signaling that the supply crunch is impacting middle distillates ahead of the Northern Hemisphere winter.
+--------------------------------------------------------------------------+
|                 ENERGY FUTURES TERM STRUCTURE & SKEW                     |
+--------------------------------------------------------------------------+
| Metric / Curve Element     | Observation / Pricing  | Institutional Bias |
+----------------------------+------------------------+--------------------+
| Brent-WTI Spread           | Widening significantly | Long Brent /       |
| (BRN-CL Dec 2026)          | in favor of Brent      | Short WTI          |
|                            |                        |                    |
| WTI Calendar Spread        | Dec26-Jun27 backward-  | Bullish prompt     |
| (CLZ6 - CLM7)              | ation widened +$1.50   | demand pressure    |
|                            |                        |                    |
| WTI Dec26 Volatility Skew  | OTM Calls trading at   | Upside tail risk   |
| (OVX at 45-55%)            | premium to OTM Puts    | being priced in    |
|                            |                        |                    |
| Refined Crack Spreads      | 3-2-1 Crack expanded   | Long HO/RB vs      |
| (RB-HO-CL)                 | +$3.50 on the week     | Short Crude        |
+----------------------------+------------------------+--------------------+
Detailed Trade Execution Blueprint
Primary Leg: Long ICE Brent Dec 2026 futures / Short NYMEX WTI Dec 2026 futures. Enter at current market spread. Target an expansion of the Brent premium by +$3.50 to +$5.00/bbl as Middle East logistical rerouting costs compound.
Secondary Leg (Directional Upside Convexity): Buy the NYMEX WTI (CLZ6) December 2026 $100/$110 call spread. Simultaneously sell the $90 put to reduce net debit, or deploy a $100/$120 call butterfly (buying one $100 call, selling two $110 calls, buying one $120 call). This call butterfly structure limits the negative drag of elevated implied volatility (OVX at 45–55%) while offering asymmetric upside if crude spikes toward the $105–$112 zone.
Exit & Risk Parameters: Set stop-loss on the Brent-WTI spread trade if the premium narrows by -$1.20 from entry, indicating resolution of shipping restrictions. For the options structure, risk is mathematically defined by the net debit paid. Take-profit target: liquidate call spreads when WTI spot approaches $104.50.
Trade #2: Safe-Haven & Debasement Runner – Gold Dec 2026 Upside Call Accumulation
The Macro & Quantitative Rationale
Precious metals are displaying structural resilience. Gold (GC) futures are holding firm across institutional models—trading in the $2,500/oz breakout territory on COMEX, while secondary physical recovery models project safe-haven runs toward $4,373–$4,500/oz.
This bid is reinforced by central bank accumulation, ongoing physical COMEX vault drawdowns, and safe-haven flows triggered by Middle East infrastructure strikes and Ukraine-Russia drone campaigns.
Crucially, gold is maintaining upward momentum despite a firm US Dollar Index (DXY at 100.30–105.5), breaking typical cross-asset correlations. As outlined in the correlation rules:
Correlation(Gold,US 10Y Yields)=−0.80andCorrelation(Gold,S&P 500)=−0.75\text{Correlation}(\text{Gold}, \text{US 10Y Yields}) = -0.80 \quad \text{and} \quad \text{Correlation}(\text{Gold}, \text{S\&P 500}) = -0.75Correlation(Gold,US 10Y Yields)=−0.80andCorrelation(Gold,S&P 500)=−0.75
When gold advances alongside rising yields, it signals that markets are pricing stagflationary sovereign tail-risk rather than standard real-rate discounting. Furthermore, with the gold/silver ratio hovering around 85:1, silver (SI) is seeing 7 million ounce COMEX warehouse withdrawals, indicating deep industrial and physical accumulation.
       +--------------------------------------------------------+
       |               PRECIOUS METALS FLOW REGIME              |
       +--------------------------------------------------------+
                                   |
         +-------------------------+-------------------------+
         |                                                   |
         v                                                   v
+-------------------------------+   +-------------------------------+
|     COMEX GOLD (GCZ6) FLOW    |   |    SILVER BREAKOUT (SIZ6)     |
+-------------------------------+   +-------------------------------+
| • Consolidating above $2,500  |   | • Rallying toward $35.00/oz   |
| • Target models: $2,700-$4,500|   | • 7M oz COMEX withdrawals     |
| • Skew heavily favors Calls   |   | • Gold/Silver Ratio at 85:1   |
| • Long Dec26 $2,600/$2,700 Call|  | • Bullish Call Spreads: $40/$45|
+-------------------------------+   +-------------------------------+
Detailed Trade Execution Blueprint
Primary Leg: Buy COMEX Gold (GCZ6) December 2026 $2,600/$2,700 call debit spread. For aggressive macro accounts targeting broader model projections, acquire the GCZ6 $4,500/$4,700 call vertical.
Financing/Volatility Leg: Sell GCZ6 $2,400 out-of-the-money puts (Gold Volatility GVZ at 22%) to finance the long call spread. Institutional desks are deploying this exact risk-reversal structure to minimize upfront cash outlay while capturing upside gamma.
Relative Value Companion: Long Silver COMEX Dec 2026 ($35/oz breakout play) / Short Gold futures ratio spread to exploit gold/silver ratio compression from 85:1 down toward 75:1.
Exit & Risk Parameters: Stop-loss triggered if GCZ6 breaks below the key technical pivot of $2,420/oz on a daily closing basis. Profit targets: scale out 50% of the position at $2,680/oz; allow the remaining 50% to run toward the upper strike.
Trade #3: Rates Policy Error Hedge – 10Y Treasury (TY/ZN) Put Spreads & 2s10s Steepeners
The Macro & Quantitative Rationale
The fixed-income complex is under pressure. Federal Reserve Chair Warsh’s hawkish stance—underpinned by 16 of 19 FOMC members projecting additional hikes in 2026—clashes with a slowing real economy.
The benchmark 10-Year US Treasury futures (TYZ6 / ZNZ6) have seen institutional open interest rise by 9% on short positioning as real yields expand. Asset managers are liquidating long-duration holdings to hedge against a higher-for-longer path driven by energy inflation.
Concurrently, the MOVE index has surged to 120. With the 2s10s yield curve inverted to -25 to -35 bps, current levels sit near cyclical lows, creating a compelling risk-reward profile for curve steepener trades.
+--------------------------------------------------------------------------+
|                  FIXED INCOME & RATES TERM PROFILE                       |
+--------------------------------------------------------------------------+
| Instrument / Spread         | Current Market Metric  | Institutional Bias|
+-----------------------------+------------------------+-------------------+
| 10Y Treasury Futures (TYZ6) | Heavy open-interest    | Short TY /        |
|                             | accumulation on shorts | Buy Put Spreads   |
|                             |                        |                   |
| 2s10s Yield Curve Spread    | Inverted at -25 to     | Long TU / Short TY|
| (TU vs TY)                  | -35 bps                | (Curve Steepener) |
|                             |                        |                   |
| SOFR Dec 2026 (SR3Z6)       | 96.00/96.50 Call       | Hedging prolonged |
|                             | Spreads heavily bid    | restrictive rates |
|                             |                        |                   |
| 3M CDOR Futures (BAX Dec26) | Repricing 40% chance   | Short BAX         |
|                             | of 25 bps BoC hike     | (Bearish Canadian)|
+-----------------------------+------------------------+-------------------+
Detailed Trade Execution Blueprint
Primary Leg (Yield Spike Hedge): Buy CBOT 10-Year Treasury (TYZ6) December 2026 120/118 put spreads (or ZNZ6 $110/$105 put spreads). This position monetizes further duration selling if 10-Year benchmark yields break toward 4.50%–4.75%.
Secondary Leg (Systemic Un-Inversion): Execute a 2s10s Treasury futures steepener: Long 2-Year Treasury futures (TU Dec 2026) vs. Short 10-Year Treasury futures (TY Dec 2026), weighted on a DV01-neutral basis (roughly 3 contracts of TU per 1 contract of TY).
Exit & Risk Parameters: Exit the TY put spread if 10-year yields reverse below 3.95% (TY futures price rallies above 122-00). Liquidate the steepener if the 2s10s curve flattens beyond -45 bps.
Trade #4: The Crypto Adoption Breakout – BTC Cash-and-Carry Basis & Long ETH/BTC Relative Value
The Macro & Quantitative Rationale
Digital assets are decoupling from broader equity weakness. Bitcoin has executed a clean breakout above the $85,000–$86,000 resistance zone, backed by spot ETF inflows ($400 million weekly across BlackRock’s IBIT and Fidelity’s FBTC) and corporate treasury purchases (MicroStrategy acquiring 950 BTC at ~$79,600).
In derivatives markets, CME Bitcoin futures (BTCZ6) trade at a substantial premium to spot, establishing an annualized basis yield of roughly 2.5% to 5.0%.
Meanwhile, Ethereum (ETH) derivatives are displaying upside momentum: open interest in ETH futures has hit 9-month highs, with the token clearing $2,700 and institutions positioning for approvals of staked-ETH investment vehicles.
With the ETH/BTC correlation standing at +0.80, capital is beginning to rotate down the risk curve into Ethereum, positioning the ETH/BTC cross for a mean-reversion rally.
       +--------------------------------------------------------+
       |               CRYPTO DERIVATIVES PROFILE               |
       +--------------------------------------------------------+
                                   |
         +-------------------------+-------------------------+
         |                                                   |
         v                                                   v
+-------------------------------+   +-------------------------------+
|    CME BITCOIN BASIS TRADE    |   |     ETH/BTC RELATIVE VALUE    |
+-------------------------------+   +-------------------------------+
| • CME BTCZ6 at $2k premium    |   | • ETH OI at 9-month high      |
| • Spot-Futures Cash & Carry   |   | • Long ETHZ6 / Short BTCZ6    |
| • Deribit P/C Ratio: 0.56     |   | • Target: ETH outperformance  |
| • Call Butterflies: $90k/$110k|   | • ETH Dec26 $3k/$3.5k Calls   |
+-------------------------------+   +-------------------------------+
Detailed Trade Execution Blueprint
Primary Leg (Market-Neutral Yield): Institutional Cash-and-Carry Basis Arbitrage. Long Spot Bitcoin (or Long IBIT/spot custody) vs. Short CME Bitcoin Dec 2026 futures (BTCZ6). Capture the contango premium while running a delta-neutral book.
Secondary Leg (Convex Directional Spread): Long CME Ethereum Dec 2026 (ETHZ6) futures / Short CME Bitcoin Dec 2026 (BTCZ6) futures. In options space, execute ETH Dec 2026 $3,000/$3,500 call spreads while financing via sale of $2,000 out-of-the-money puts.
Exit & Risk Parameters: For the basis trade, hold until contract expiry in December 2026 to harvest full convergence. For the ETH/BTC spread, stop out if the ETH/BTC cross breaks below 0.0310; take profits when the cross approaches 0.0425.
Trade #5: Cross-Border Supply Dislocation – Belarus Potash Shift vs. Grains Spread
The Macro & Quantitative Rationale
Trade policy has introduced sharp dislocations across agricultural and fertilizer inputs. The administration’s unexpected sanction-relief agreement with Belarus to import potash—designed to bypass trade disputes with Canada—has shifted the marginal cost structure for agricultural producers.
Equities of traditional North American suppliers (CF Industries, Nutrien) fell on the news, reflecting expectations of increased global supply and downward pressure on fertilizer prices.
This drop in input costs directly benefits grain producers, lowering per-acre production costs and boosting operating margins. Meanwhile, corn (C) is showing strong technical support relative to soybeans (S), creating an opportunity to trade fertilizer input compression against grain output values.
+--------------------------------------------------------------------------+
|                  FERTILIZER & GRAINS SPREAD METRICS                      |
+--------------------------------------------------------------------------+
| Derivative / Commodity      | Market Dynamic        | Trading Stance     |
+-----------------------------+-----------------------+--------------------+
| CME Urea Futures (UREA Dec) | Sanctions relief on   | Short Futures /    |
|                             | Belarus unlocks supply| Buy Put Spreads    |
|                             |                       |                    |
| CBOT Corn Futures (C Dec26) | Lower fertilizer costs| Long Corn /        |
|                             | support planting margin| Short Soybeans     |
|                             |                       |                    |
| Corn-Soybean Ratio          | Corn outperforming S  | Long C Dec26 /     |
| (C/S Dec 2026)              | on input intensity    | Short S Dec26      |
|                             |                       |                    |
| Potash Options              | ICE Potash $300 Puts  | Bearish fertilizer |
|                             | seeing institutional OI| tail positioning  |
+-----------------------------+-----------------------+--------------------+
Detailed Trade Execution Blueprint
Primary Leg: Short CME Urea Dec 2026 futures (or buy ICE Potash Dec 2026 $300 puts). Target a 15–20% decline in fertilizer pricing as Belarusian shipments re-enter international logistics channels.
Secondary Leg: Long CBOT Corn Dec 2026 futures / Short CBOT Soybean Dec 2026 futures (Corn-Soybean spread). As fertilizer costs fall, high-nitrogen-demand crops like corn experience input relief, leading to margin expansion and favorable relative demand.
Exit & Risk Parameters: Close the short fertilizer position if sanctions relief is challenged or revoked by congressional actions. Exit the corn/soybean spread if the price ratio breaks down by more than 3.5% from entry.
Comprehensive Asset Class Analysis & Derivatives Positioning
       +-------------------------------------------------------------+
       |             CROSS-ASSET DERIVATIVES POSITIONING             |
       +-------------------------------------------------------------+
                                      |
         +----------------------------+----------------------------+
         |                                                         |
         v                                                         v
+-----------------------------+                           +-----------------------------+
|    ENERGY & COMMODITIES     |                           |       FX & EQUITIES         |
+-----------------------------+                           +-----------------------------+
| • WTI (CL): Long $100 Calls |                           | • DXY: Dec 102/104 Calls    |
| • Brent: $110/$120 Spreads  |                           | • EUR/USD: 1.05 Put Skew    |
| • TTF Gas: €35/€40 Calls    |                           | • USD/JPY: 160 Calls active |
| • Gold: $2.6k/$2.7k Calls   |                           | • S&P 500: Dec 5200/5000 Puts|
| • Copper: $4.50/$5.00 Calls |                           | • VIX: Long 25/30 Call Sprd |
+-----------------------------+                           +-----------------------------+
1. Energy & Natural Gas Derivatives
Asset / Contract             Institutional Positioning    Options Volume Concentration     Key Thematic Driver
WTI Crude Oil (CLZ6)         Net Long (Managed Money)     Dec26 $100, $110 Calls; $90 Puts Hormuz blockade; Yanbu strikes
Brent Crude Oil (BRNZ6)      Long BRN / Short CL Spreads  Dec26 $110/$120 Call Spreads     European & Asian physical supply deficit
RBOB Gasoline (RBZ6)         Long Front-Month Spreads     Dec26 $3.00/$3.20 Call Spreads   Refinery outages; cracking margins surge
Heating Oil / Diesel (HOZ6)  Net Long Outright            Dec26 $3.50 Calls heavily bought European diesel inventory deficits
Title Transfer Facility(TTF) Outright Long Dec26          Dec26 €35, €40 Calls             Ras Laffan outage; EU storage at 85%
Henry Hub Nat Gas (NGZ6)     Short Front / Long Winter    NGH27-NGK27 Spreads active       US domestic production surplus vs EU
Energy derivatives are pricing elevated geopolitical risk premiums. Backwardation across the Brent curve has deepened, with prompt contracts trading at widening premiums over deferred months.
In options space, the crude volatility index (OVX) at 45–55% has steepened the implied volatility smile: upside out-of-the-money calls command higher implied volatility than corresponding downside puts, reflecting active institutional positioning for supply disruptions.
Natural gas displays a regional divergence: US Henry Hub remains anchored due to strong domestic production, while European Title Transfer Facility (TTF) and Asian Japan Korea Marker (JKM) contracts are pricing in structural risks following the loss of Qatari export capacity.
2. Fixed Income, Rates & Currencies (FX)
Asset / Contract             Institutional Positioning    Options-on-Futures Activity      Key Thematic Driver
10Y Treasury (TYZ6 / ZNZ6)   Net Short; Yield Bearish     TY 120/118 Put Spreads; $110 PutsFed Dot Plot; 16/19 members see hike
2Y Treasury (TUZ6)           Yield Curve Steepener Long   TU Straddles pricing Fed path    Curve un-inversion positioning
SOFR 3-Month (SR3Z6)         Bearish Front-End            SR3 96.00/96.50 Call Spreads     Pricing SOFR terminal rate at 4.25%+
US Dollar Index (DXY)        Net Long                     Dec26 102/104, 110 Call Spreads  Fed hawkishness vs ECB dovishness
EUR/USD (6EZ6)               Short Outright               Dec26 1.05 Puts heavily bid      ECB rate cuts vs Fed holding rates
USD/JPY (6JZ6)               Long Outright                Dec26 160 Calls active           BoJ policy lag; yield divergence
USD/CAD (6CZ6)               Short (Long CAD)             Dec26 1.30 Puts (CAD Calls)      BoC Macklem warning on $100 oil
The macro rates environment is defined by central bank divergence and yield curve distortions. Chair Warsh’s hawkish tone has reinforced real rate strength, lifting the DXY index to 100.30–105.5.
In FX options, the 25-delta risk reversal for EUR/USD displays strong put skew, with market participants pricing a test of 1.05. Conversely, USD/CAD is seeing institutional selling: desks are positioning for Bank of Canada rate hikes driven by crude nearing $100/bbl, driving demand for Canadian Dollar calls (1.30–1.32 strike equivalent).
3. Equities, Volatility (VIX), and Tail-Risk Hedges
Asset / Contract             Institutional Positioning    Options-on-Futures Activity      Key Thematic Driver
S&P 500 E-Minis (ESZ6)       Short / Reduced Longs        Dec26 5200/5000 Put Spreads      Narrow breadth (22%); energy drag
Nasdaq-100 E-Minis (NQZ6)    Long Skew / Tech Long        Sell 20,500 Calls / Buy 21k CallsAI capex; AMD $1T market cap
Russell 2000 E-Minis (RTYZ6) Outright Short / Underweight Dec26 2200/2000 Put Spreads      High sensitivity to higher rate path
CBOE Volatility Index (VXZ6) Long Volatility Calls        Dec26 25/30 Call Spreads         Rule 4.6 trigger; tail risk hedging
Equity index derivatives reflect an increasingly bifurcated market. While the tech-heavy Nasdaq-100 continues to find support from semiconductor AI infrastructure demand, overall market breadth has deteriorated significantly—only 22% of constituent equities are trading above their 50-day moving averages.
Hedge funds have accumulated over $1.0 billion in notional put protection on SPY and ES futures, focusing primarily on December 5,200/5,000 put verticals. Small-cap equities (Russell 2000: RTY) remain the preferred short vehicle for institutional desks hedging against prolonged restrictive monetary policy.
Cross-Asset Correlation Matrix & Quantitative Hedging
Managing cross-asset risk requires adhering to strict correlation boundaries to avoid compounding portfolio drawdowns. Under Rule 14.6, institutional trading desks must actively monitor and neutralize exposures where correlation coefficients exceed |0.70|.
Pairing               30-Day Correlation Quantitative Regime Interpretation        Mandated Hedging Protocol
Oil (CL) vs USD (DXY) -0.72 to -0.75     Strong inverse relationship. Dollar       Hedge long oil futures by holding DXY
                                         surges suppress commodity buying power.   bull call spreads (Dec 102/104).
BTC vs Gold (GC)      +0.75              Strong positive relationship. Both act as Do not run unhedged long positions in both;
                                         monetary debasement / liquidity hedges.   treat as shared balance-sheet exposure.
10Y Yields vs Gold    -0.68 to -0.80     Strong negative relationship. Real yield  Hedge long gold positions with short 10Y
                                         expansions weigh on non-yielding assets.  Treasury futures (TYZ6 put spreads).
ETH vs BTC            +0.80              High intra-crypto beta. ETH runs high     Utilize ETH/BTC ratio spreads to extract
                                         correlation with structural alpha.        relative value without directional crypto beta.
Oil (CL) vs S&P (ES)  -0.70              Inverse relationship. Energy price shocks Hedge broad equity portfolios against
                                         pressure corporate earnings & consumer spend. oil spikes using crude call verticals.
Gold (GC) vs S&P (ES) -0.75              Safe-haven divergence. Equities sell off  Use Gold calls as an uncorrelated hedge
                                         as geopolitical gold accumulation surges. against systemic equity drawdowns.
Quantitative Correlation Formula & Beta Neutralization
To neutralize directional cross-asset beta between equity holdings and energy price shocks, institutional desks deploy the following delta-hedging relationship:
βportfolio=Covariance(RES,RCL)Variance(RCL)\beta_{\text{portfolio}} = \frac{\text{Covariance}(R_{\text{ES}}, R_{\text{CL}})}{\text{Variance}(R_{\text{CL}})}βportfolio=Variance(RCL)Covariance(RES,RCL)
Ncontracts (CL)=(Notional ValuePortfolioContract ValueCL)×βportfolio×Correlation Adjustment (Rule 14.6)N_{\text{contracts (CL)}} = \left( \frac{\text{Notional Value}_{\text{Portfolio}}}{\text{Contract Value}_{\text{CL}}} \right) \times \beta_{\text{portfolio}} \times \text{Correlation Adjustment (Rule 14.6)}Ncontracts (CL)=(Contract ValueCLNotional ValuePortfolio)×βportfolio×Correlation Adjustment (Rule 14.6)
When the correlation between crude oil and equities reaches -0.70, desks running long equity books purchase out-of-the-money crude oil call options (CLZ6 $100/$110) to generate offsetting positive convexity during energy-driven equity sell-offs.
Institutional Execution Blueprint for the Upcoming Week
+--------------------------------------------------------------------------------------------------------------------------------+
|                                    INSTITUTIONAL EXECUTION & CATALYST TIMELINE                                                 |
+--------------------------+------------------------------------+--------------------------------+-------------------------------+
| Date / Target Time       | High-Impact Macro Catalyst         | Primary Affected Derivatives   | Strategic Execution Directive |
+--------------------------+------------------------------------+--------------------------------+-------------------------------+
| Tuesday, Sept 22, 2026   | Secondary Shipping Disruption Data | CL, BRN, HO, BDI Futures       | Establish Long Brent /        |
|                          | Updates & Tanker Freight Re-pricing|                                | Short WTI spread on opens     |
+--------------------------+------------------------------------+--------------------------------+-------------------------------+
| Wednesday, Sept 23, 2026 | US Sanctions Deadline Grounding    | CLZ6, NGZ6, DXY, 6EZ6          | Scale into WTI Dec26          |
|                          | Iranian Commercial Airlines        |                                | $100/$110 Call Debit Spreads  |
+--------------------------+------------------------------------+--------------------------------+-------------------------------+
| Thursday, Sept 24, 2026  | EIA Weekly Petroleum & Storage     | CL, RB, HO, NG Futures         | Execute winter heating crack  |
|                          | Data; Natural Gas Storage Print    |                                | spreads (Long HO / Short CL)  |
+--------------------------+------------------------------------+--------------------------------+-------------------------------+
| Friday, Sept 25, 2026    | Global Central Bank Speaker Series | TY, TU, SR3, FF Futures        | Enter 2s10s Treasury yield    |
|                          | (Warsh Fed, BoC Macklem Follow-up) |                                | curve steepeners (TU vs TY)   |
+--------------------------+------------------------------------+--------------------------------+-------------------------------+
| Saturday, Sept 26, 2026  | Meta Connect 2026 & AI Hardware    | NQZ6, Tech Options-on-Futures  | Monetize NQ upside; roll short|
|                          | Disclosures Over Weekend           |                                | 20,500 calls to lock premium  |
+--------------------------+------------------------------------+--------------------------------+-------------------------------+
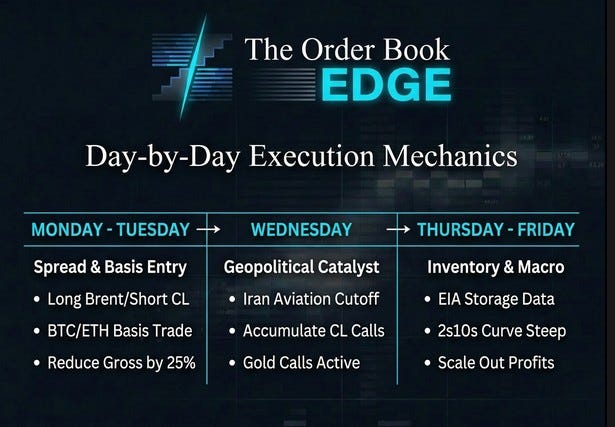
Day-by-Day Execution Mechanics
    MONDAY - TUESDAY                  WEDNESDAY                     THURSDAY - FRIDAY
+-----------------------+     +-----------------------+     +-----------------------+
|  Spread & Basis Entry |     | Geopolitical Catalyst |     | Inventory & Macro     |
|                       |     |                       |     |                       |
| • Long Brent/Short CL | ==> | • Iran Aviation Cutoff| ==> | • EIA Storage Data    |
| • BTC/ETH Basis Trade |     | • Accumulate CL Calls |     | • 2s10s Curve Steep   |
| • Reduce Gross by 25% |     | • Gold Calls Active   |     | • Scale Out Profits   |
+-----------------------+     +-----------------------+     +-----------------------+
Monday–Tuesday: Portfolio Sizing & Structural Basis Positioning
Apply Rule 4.6: Calculate total portfolio gross exposure across all accounts. If the VIX is trading between 18 and 22, trim existing long equities, equity index futures, and high-beta spreads by 25%.
Execute Spread Trades: Enter the Long Brent / Short WTI (BRN-CL Dec 2026) spread during early London trading hours to capture overnight physical tanker rate adjustments.
Lock In Basis Yields: Establish institutional cash-and-carry crypto books by buying physical spot BTC and selling CME December 2026 BTCZ6 futures at a ~$2,000 premium.
Wednesday: Sanctions Catalyst Deployment
Iran Sanctions Enforcement: As US sanctions grounding Iranian airline fleets take effect on September 23, monitor Gulf tanker tracking data.
Options Entry: Deploy the WTI Dec 2026 $100/$110 call debit vertical. If OVX expands past 50%, deploy the $100/$120 call butterfly to avoid overpaying for volatility.
Gold Upside Confirmation: Verify COMEX Gold (GCZ6) holds above $2,500/oz. If open interest confirms net accumulation, initiate the GCZ6 $2,600/$2,700 call vertical.
Thursday–Friday: Macro Catalysts & Rates Structuring
EIA Energy Print: Track commercial crude inventories and middle distillate draws. If distillate inventories fall below the 5-year average, enter long Heating Oil (HOZ6) vs. short RBOB Gasoline (RBZ6) calendar spreads.
Curve Steepener Execution: Following central bank speaking engagements, establish the 2s10s yield curve steepener (Long TU / Short TY) to monetize potential curve un-inversion.
Weekly Rebalancing: Harvest profits on short-dated premium sales (such as the short NQ 20,500 calls sold against tech long spreads ahead of Meta Connect).
Critical Upcoming Macro Catalysts (Q4 2026 Outlook)
To maintain an asymmetric positioning edge throughout the remainder of 2026, trading desks must align their execution calendars with the following scheduled events:
+--------------------------------------------------------------------------------------------------------------------------------+
|                                    MACRO CATALYST CALENDAR (OCTOBER - DECEMBER 2026)                                           |
+--------------------------+------------------------------------+--------------------------------+-------------------------------+
| Date                     | Critical Macro Event               | Key Derivatives Under Pressure | Projected Institutional Impact|
+--------------------------+------------------------------------+--------------------------------+-------------------------------+
| October 14, 2026         | September US CPI Print             | TY, FF, SR3, DXY, GC Futures   | Determines probability of     |
|                          |                                    |                                | another 2026 Fed rate hike    |
+--------------------------+------------------------------------+--------------------------------+-------------------------------+
| October 30, 2026         | FOMC Monetary Policy Decision      | FFZ6, SR3Z6, ES, NQ Futures    | Confirmation of Warsh dot plot|
|                          |                                    |                                | policy path (3.75% to 4.25%)  |
+--------------------------+------------------------------------+--------------------------------+-------------------------------+
| November 5, 2026         | US Presidential / General Elections| VIX, ES, NQ, DXY, GC Futures   | Broad implied volatility spike|
|                          |                                    |                                | across November options expiries|
+--------------------------+------------------------------------+--------------------------------+-------------------------------+
| December 10, 2026        | OPEC+ Ministerial Conference       | CL, BRN, RB, HO Futures/Options| Decisions on Saudi cuts and   |
|                          |                                    |                                | quota compliance enforcement  |
+--------------------------+------------------------------------+--------------------------------+-------------------------------+
| December 18, 2026        | Triple Witching & Year-End FOMC    | All Futures, Calendar Spreads, | Major liquidity rollover and  |
|                          | Rate Decision                      | Options-on-Futures             | contract expirations (Z6->H7) |
+--------------------------+------------------------------------+--------------------------------+-------------------------------+
Strategic Summary for Substack Subscribers
The macro environment of September 2026 is defined by two opposing forces: escalating physical supply chokepoints in energy and commodities on one side, and restrictive monetary policy from the Federal Reserve and the Bank of Canada on the other.
In this environment, broad equity index exposure offers an unfavorable risk-reward profile, characterized by narrow breadth, elevated valuations, and vulnerability to rate shocks.
+-----------------------------------------------------------------------------+
|                     WEEKLY PORTFOLIO ACTION CHECKLIST                       |
+-----------------------------------------------------------------------------+
| [ ] 1. Apply Rule 4.6: Cut overall gross portfolio exposure by 25%          |
|        (VIX operating in 18-22 zone).                                       |
|                                                                             |
| [ ] 2. Establish Long Brent / Short WTI Dec26 Spread                        |
|        (Target +$3.50 to +$5.00/bbl widening).                              |
|                                                                             |
| [ ] 3. Accumulate Dec26 WTI $100/$110 Call Spreads or $100/$120 Butterflies|
|        (Monetize Strait of Hormuz / Yanbu geopolitical shock).              |
|                                                                             |
| [ ] 4. Execute CBOT 10Y Treasury (TYZ6) 120/118 Put Spreads                 |
|        (Hedge against rising real yields and Fed hawkishness).              |
|                                                                             |
| [ ] 5. Allocate to Gold Dec26 $2,600/$2,700 Call Verticals                 |
|        (Capture sovereign debasement and stagflationary hedging).           |
|                                                                             |
| [ ] 6. Deploy Market-Neutral Crypto Basis Arbitrage (Long Spot/Short BTCZ6)|
|        + Long ETH / Short BTC relative value spread.                        |
|                                                                             |
| [ ] 7. Short CME Urea / Long CBOT Corn Spreads                             |
|        (Trade the Belarus potash sanctions-relief dynamic).                 |
+-----------------------------------------------------------------------------+
By prioritizing relative value spreads (Brent-WTI, ETH-BTC, Corn-Soybeans), exploiting structural volatility skew, and enforcing systematic risk limits under Rules 4.6 and 14.6, institutional traders can navigate the late-2026 macro landscape with defined downside risk and asymmetric upside convexity.