


Date: November 7, 2026 | Reading Time: ~25 Minutes
Disclaimer: Educational purposes only — not investment advice. Seek professional financial advice if needed.
Executive Summary: The Anatomy of a Fractured Market
As we cross the threshold of the November 2026 U.S. midterm elections and stare down the barrel of year-end liquidity constraints, the institutional derivatives landscape has fractured into competing macro regimes. Across global futures exchanges—from the CME and ICE to Eurex, the LME, and the NSE—desk heads and quantitative portfolio managers are no longer trading a unified global narrative. Instead, they are pricing in simultaneous, violently opposed tail risks.
In our latest synthesis of institutional desk reports, CFTC Commitments of Traders (CoT) data, and options-on-futures volatility surfaces, a clear meta-theme emerges: The Collision of Structural Inflation and Cyclical Exhaustion.
On one side of the ledger, the physical economy is screaming supply constraint and capital intensity. Five-year U.S. Treasury yields (FVZ6) have surged to ~4.85%—their highest levels since 2007—driven not just by Federal Reserve hawkishness, but by the insatiable capital and energy demands of the global AI data center buildout. Simultaneously, geopolitical flashpoints in the Strait of Hormuz and Houthi attacks on Saudi infrastructure have injected a $4.50/bbl premium into the Brent-WTI spread, while Chinese diesel export cuts tighten global middle distillates.
On the other side of the ledger, financialized assets and cyclical growth narratives are cracking under the weight of this higher-for-longer reality. Corporate profits as a percentage of GDP sit at a precarious record high of 13%, drawing uncomfortable parallels to Warren Buffett’s famous 1999 warnings on mean reversion. The 2s10s Treasury yield curve remains deeply inverted (oscillating between -25bps and -35bps across desk models, the deepest sustained inversion since 2000), while the Nasdaq-100 (NQZ6) faces a toxic cocktail of rising discount rates and post-election regulatory scrutiny over AI energy consumption. Meanwhile, in the digital asset space, Hyperliquid whales have accumulated their largest Bitcoin short positions since October 2025, even as CME futures maintain a mild contango.
How do institutional desks survive when the macro compass is spinning? They stop making unhedged directional bets and move into the volatility surface. They trade calendar spreads, ratio backspreads, variance swaps, and cross-asset correlation arbitrages.
In this comprehensive 5,000-word breakdown, we will dissect the exact positioning, options structures, and quantitative rules governing institutional capital as we head into 2027.
Visualization 1: The Late-2026 Cross-Asset Correlation Matrix
Before diving into individual asset classes, we must understand how assets are moving relative to one another. Under Institutional Rule 14.6, portfolio managers are strictly mandated to monitor cross-asset correlations, flagging any pair that breaches the +/- 0.70 threshold to prevent unintended concentration risk during liquidity squeezes.
========================================================================================
                 LATE-2026 INSTITUTIONAL CROSS-ASSET CORRELATION MATRIX
                      (60-Day Rolling Realized & Implied Dynamics)
========================================================================================

Asset Pair                  Correlation   Regime Status        Primary Institutional Trade
----------------------------------------------------------------------------------------
UST 10Y (ZN) vs. Bund (FGBL)   +0.82      [CRITICAL > 0.70]    Long ZN / Short FGBL (Fiscal Dominance)
BTC vs. Ethereum (ETH)         +0.85      [HIGH]               CME ETH/BTC Ratio Futures (Short ETH)
USD (DXY) vs. USD/CNH          +0.80      [CRITICAL > 0.70]    Long USD/CNH Call Spreads (AI/Trade)
Oil (CL) vs. Inflation (CPI)   +0.75      [CRITICAL > 0.70]    Long TIPS (TIPZ6) / Short CL Puts
ETH vs. Nasdaq-100 (NDX)       +0.72      [CRITICAL > 0.70]    Short NQ / Long XLV (Sector Rotation)
ASX 200 (APZ6) vs. Gold (GC)   +0.70      [THRESHOLD]          Long APZ6 / Long GCZ6 (Commodity Play)
Brent (BRN) vs. Gold (GC)      +0.68      [ELEVATED]           GC-Brent Spread Options (Geopolitics)
TTF Gas vs. Brent (BRN)        +0.68      [ELEVATED]           Dec26 TTF/Brent 15/20 Call Spreads
BTC vs. Gold (GC)              +0.45      [MODERATE]           Long GC / Short BTC on ME Escalation
JKM LNG vs. Henry Hub (NG)     -0.45      [MODERATE INVERSE]   Dec26 JKM/Henry Hub Spread Futures
BTC vs. US 10Y Yield (TNX)     -0.65      [HIGH INVERSE]       Liquidity Hedging via Short CME BTC
Oil (CL) vs. Gold (GC)         -0.65*     [REGIME DEPENDENT]   Short CL / Long GC (Stagflation Hedge)
INR vs. Crude Oil (CL)         -0.65      [HIGH INVERSE]       Long USDINR Puts on Oil Pullbacks
USD (DXY) vs. Gold (GC)        -0.70**    [CRITICAL < -0.70]   Long DXZ6 / Short GCZ6 (Hawkish Fed)
10Y Yield vs. S&P 500 (ES)     -0.72      [CRITICAL < -0.70]   10Y Futures vs. ES Delta Hedges
EUR/USD (6E) vs. Bund (FGBL)   -0.75      [CRITICAL < -0.70]   6EZ6 Put Spreads / FGBL Puts
Oil (CL) vs. USD (DXY)         -0.75      [CRITICAL < -0.70]   Short CL Calendar Spreads on DXY Rally
Nasdaq (NQ) vs. 10Y Yields     -0.80      [EXTREME INVERSE]    Short NQZ6 / Long ZNZ6 (Flight to Quality)
S&P 500 (ES) vs. VIX           -0.85      [STRUCTURAL]         Short ESZ6 / Long VIX 25/30 Call Spreads

*Note: Oil/Gold correlation is bifurcated; historical/stagflation models show -0.65,
 while acute Hormuz geopolitical shock models push it to +0.68.
**Note: DXY/Gold reaches -0.85 in dovish/Democratic-sweep desk scenarios.
========================================================================================
Section 1: The Crypto Derivatives Complex — Whale Shorts, Basis Compression, and the AI Narrative
The cryptocurrency derivatives market in November 2026 is a masterclass in structural divergence. The retail mania of previous cycles has been entirely replaced by sophisticated institutional basis trading, miner production hedging, and macro-driven volatility arbitrage across the CME, Bakkt, Deribit, and decentralized perpetual venues like Hyperliquid.
A. Bitcoin (BTC): The Battle Between Hyperliquid Whales and CME Basis Traders
The headline metric dominating crypto trading desks this week is the aggressive accumulation of short positions by whales on Hyperliquid, which have stacked to their highest levels since October 2025. This is not retail capitulation; it is high-conviction institutional positioning anticipating a near-term liquidity pullback.
This bearishness is corroborated by prediction markets, which have become a staple input for quantitative sentiment models in 2026. Polymarket currently prices a 52% probability of Bitcoin retreating to $70,000 by January 2027, while Kalshi’s order books show a heavy concentration of year-end expectations pinned tightly between $70,000 and $80,000.
Yet, when we look at the regulated futures complex alongside offshore perpetuals, a fascinating tension emerges:
The CME Contango vs. Perpetual Backwardation: On the CME, December 2026 (
BTCZ6) and March 2027 (BTCH7) contracts are trading at an annualized premium (contango) of roughly 3% to 5%. While this suggests mild structural bullishness, calendar spreads (Dec 2026 vs. Mar 2027) are actively narrowing. Roll demand is weakening. Hedge funds executing classic “cash-and-carry” basis trades—shorting CME futures while longing spot BTC to harvest that 3–5% premium—are nervously eyeing the exit, aware that a flip into backwardation will destroy the carry trade.Negative Funding Rates and Squeeze Mechanics: On major offshore perpetual venues like Binance and Bybit, funding rates have flipped decisively negative, printing between
-0.01%and-0.03%. Shorts are paying longs to keep their positions open. While this confirms short dominance, it also creates a coiled spring. Desks are actively modeling a violent “BTC Short Squeeze” scenario: if the Federal Reserve signals even a hint of a dovish pivot or Middle East tensions de-escalate, overcrowded Hyperliquid and perp shorts could be forced to cover, sending December CME contracts ripping higher. To play this asymmetric tail, directional macro desks are executing bullish risk reversals—buying$80,000calls and selling$70,000puts on CME Dec 2026 contracts.
The Volatility Surface and Miner Hedging
Within the options-on-futures market (CME, Bakkt, Deribit), institutional hedging is driving a pronounced put skew. Traders are aggressively bidding up out-of-the-money (OTM) puts in the $65,000–$70,000 strike zone, financing these protective positions by selling OTM calls at $90,000 and above.
The Implied Volatility (IV) term structure is currently inverted (backwardated):
Front-Month (Nov/Dec 2026) IV: Elevated at 65%–70%, pricing in acute year-end macro uncertainty, post-midterm fiscal shifts, Federal Reserve policy ambiguity, and Middle East geopolitical risk.
Longer-Dated (Mar 2027+) IV: Trading lower at 55%–60%. However, this back-end vol is kept structurally supported by relentless hedging demand from industrial Bitcoin miners (such as Core Scientific, IREN, and TeraWulf) and ETF issuers (such as Grayscale). Miners are heavily utilizing zero-cost risk reversals—selling OTM calls and buying OTM puts—to lock in revenue floors for their 2027 energy and hardware capex commitments.
Meanwhile, macro hedge funds that believe the prediction markets have it right are deploying butterfly spreads to bet on BTC remaining range-bound between $70,000 and $85,000 through year-end, collecting rich front-month premium while strictly capping their tail losses.
Quantitative Risk Rules in Crypto (Rule 4.6 & Rule 14.6)
Institutional crypto allocation is no longer siloed from traditional finance. Bitcoin’s 30-day realized volatility is currently running hot at ~75%, well above its 1-year average of ~60%. Under Rule 4.6 (The Volatility Regime Mandate), desks are monitoring the CBOE Volatility Index (VIX). With the VIX hovering in the 22–28 zone across various lookback windows, risk managers are already trimming exposure. If the VIX spikes above 35, institutional mandates dictate an immediate, mechanical 50% reduction in BTC position sizing.
Furthermore, Bitcoin’s inverse correlation with the U.S. 10-Year Treasury Yield (TNX) sits at a steep -0.65. With the 5-year Treasury yield hitting 2007 highs, any further bear steepening in the bond market threatens to trigger automated, liquidity-driven selling across crypto portfolios.
B. Ethereum (ETH): The Sick Man of Institutional Crypto
If Bitcoin is facing macro headwinds, Ethereum is enduring a structural crisis of confidence among institutional allocators. Per data tracked by CryptoTicker.io, Ethereum ETFs have suffered six consecutive weeks of net outflows, a relentless bleed that has heavily weighed on CME ETH futures (Dec 2026).
The metrics paint a grim picture for ETH bulls:
The Ratio Collapse: CME
ETH/BTCratio futures have plunged to 0.055, testing levels not seen since the 2023 lows. With a 60-day BTC-ETH correlation of 0.85, the two assets are moving together, but ETH is leading every leg of the decline. Institutions are actively shorting theETH/BTCratio contract to express relative-value bearishness without taking net market beta.Curve Backwardation: Unlike Bitcoin’s mild contango, ETH calendar spreads (
Dec 2026 vs. Mar 2027) are completely flat to slightly backwardated. There is zero institutional appetite to pay a premium for future ETH exposure.Prediction Market Consensus: Both Polymarket and Kalshi assign a remarkably low probability to ETH reclaiming the $3,000 level by year-end.
Options Skew & DeFi Treasury Hedging: On the options desk, 25-delta puts are trading at an implied volatility of ~60%, compared to just ~50% for 25-delta calls—a massive 10-vol-point skew favoring downside protection. Institutions are outright shorting Dec 2026 CME futures while buying
$1,800–$2,000strike puts. Notably, DeFi protocols themselves have entered the CME and Deribit markets, executing bear put spreads (buying$1,800puts and selling$1,600puts) to hedge their native treasury runway against a Q4 market flush. To capture weekend theta decay, market makers are routinely selling short-dated (Nov 2026) straddles and strangles ahead of low-volatility weekends.
Perhaps most fascinating is Ethereum’s evolving macro correlation: ETH now exhibits a 0.72 positive correlation with the Nasdaq-100 (NDX). Institutional desks view ETH as a high-beta proxy for tech and data-center narratives; if AI-related equities suffer a valuation correction, ETH is modeled to sell off in lockstep.
C. The Frontier: Solana, Stablecoin Depeg Binaries, and Tokenized Variance Swaps
Beyond the “Big Two,” institutional derivatives activity has expanded into specialized crypto verticals:
Solana (
SOL): Trading in CME SOL Futures (Dec 2026) is seeing net long positioning, bucking the broader crypto malaise. The catalyst? The corporate AI narrative. News of major AI infrastructure players—such as Fireworks hiring Meta’s former CFO—has spilled over into high-throughput blockchain narratives. Unlike BTC and ETH, SOL options exhibit a distinct call skew, with heavy institutional demand for$200+strike calls.Stablecoins (
USDC/USDT): Following security incidents like the Gnosis Pay breach, institutional paranoia around smart contract and collateral risk has resurfaced. Desks are utilizing CMEUSDC/USDTfutures to execute basis trades (shorting futures against long spot holdings) to exploit and hedge depeg risks, alongside OTC binary options that pay out exclusively on specified depeg threshold events.Tokenized Assets (RWA): In the burgeoning Real-World Asset space, institutional risk managers have flagged severe concentration risk, noting that 13.6% of tokenized asset supply is held by fewer than 5 holders. Because no liquid exchange-traded futures exist for these bespoke assets, institutions are turning to the OTC derivatives market, utilizing variance swaps for liquidity hedging and buying long-dated puts on illiquid tokens to cap tail volatility.
Section 2: Interest Rates & Fixed Income — 2007 Yield Highs, The AI Capex Drain, and Sovereign Spreads
The global fixed-income market in November 2026 is a battleground of competing narratives. Depending on which institutional desk model you examine, the market is either bracing for a permanently higher neutral rate driven by AI infrastructure demand and sticky wages, or positioning for a post-midterm fiscal slowdown that will force central banks to pivot in 2027.
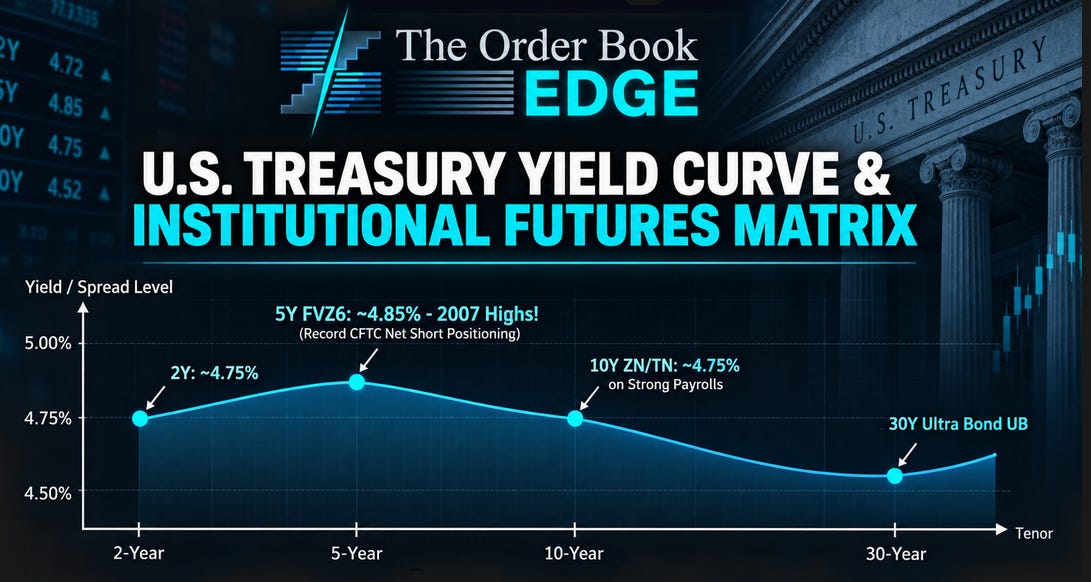
Visualization 2: The Fractured U.S. Yield Curve & Futures Positioning
========================================================================================
              U.S. TREASURY YIELD CURVE & INSTITUTIONAL FUTURES MATRIX
========================================================================================

Yield / Spread Level
  ^
5.00% |             * [5Y FVZ6: ~4.85% - 2007 Highs!]
      |            / \   (Record CFTC Net Short Positioning)
4.75% |   * [2Y]  /   * [10Y ZN/TN: ~4.75% on Strong Payrolls]
      |    \     /     \
4.50% |     \---/       \         * [30Y Ultra Bond UB]
      |                  \       /
      +-------------------------------------------------------------------> Tenor
         2-Year       5-Year    10-Year                 30-Year

----------------------------------------------------------------------------------------
KEY CURVE SPREADS (RULE 20.1 - 20.2):
* 2s10s Spread:  Inverted at -25bps to -35bps (Deepest since 2000 -> Recession Signal)
* 5s30s Spread:  Steep at +50bps (Long-term AI/Fiscal Inflation Expectations)
* MOVE Index:    Spiked to ~120 (Elevated Treasury Implied Volatility)
========================================================================================
A. The Bearish Rates Thesis: 5-Year Yields at 2007 Highs and the AI Capital Sink
The most striking anomaly on the U.S. Treasury curve is the 5-Year Note (FVZ6), where yields have surged to ~4.85%, marking their highest level since 2007. According to CFTC Commitments of Traders data, institutional speculators have amassed a record net short position in 5-year futures.
Why is the belly of the curve getting obliterated? Desks point to three structural drivers:
Fed Hawkishness & Strong Payrolls: Following a blowout U.S. payrolls report (which simultaneously triggered a pullback in gold and a 1.2% surge in the DXY), the 10-Year yield (
CME) spiked 25bps in a single week from 4.50% to 4.75%, whileUltra 10Y(Dec26) futures sold off 1.8% in a classic bear-steepening move. December 2026SOFRfutures (SR3Z6) are trading around94.50(implying a ~5.50% rate), while Dec 2026Eurodollarfutures (EDZ6) sit at94.25(implied LIBOR ~5.75%). In this hawkish regime, rate cuts have been completely priced out until mid-to-late 2027 (Q2–H2 2027).AI Data Center Demand: In a fascinating macro linkage, fixed-income desks are explicitly citing AI data center buildouts in the U.S. and China as a primary driver of higher long-term real rates. The sheer scale of grid expansion, power generation, and semiconductor capex is acting as a massive private-sector fiscal stimulus, soaking up global savings and pushing up the neutral rate (r∗r^*r∗).
REIT Outflows: As cap rates struggle to adjust to a sub-5% risk-free rate environment, institutional investors are liquidating Real Estate Investment Trusts (REITs) and rotating the proceeds directly into short-to-medium-duration Treasuries, creating paradoxical cross-currents across fixed-income buckets.
Institutional Trades in the Hawkish Regime:
Curve Steepeners: Even with the 5Y and 10Y under pressure, institutions are executing steepening trades—going Long 2-Year (
TUZ6//ZT) vs. Short 10-Year (TNX//ZN)—betting that when the Fed finally does cut, the front end will rally long before the inflation-burdened long end adjusts.Corporate Debt & CRE Hedging: With rates pinned high, corporate treasurers are buying
Eurodollarputs (EDZ6,EDH7) and SOFR payer swaptions to hedge floating-rate debt obligations, particularly against floating-rate exposure in distressed Commercial Real Estate (CRE) loans.Options Volatility (
MOVE Indexat 120): With Treasury implied volatility (MOVE) elevated at 120 and 10Y Dec26 ATM IV rising to 18% (up from 15% a month prior, with 25-delta risk reversals at-1.5showing bearish bond skew), desks are trading:Yield Butterfly Spreads: Long
4.5%puts, short 2x4.75%puts, and long5.0%puts to bet on yields consolidating in a high range.Fed Meeting Straddles: Buying Dec 2026
100strike calls and puts onFVZ6, or130-00straddles onUltra 10-Year (TN).Recession & Duration Put Spreads: Trading CME
2Y-10Yspread futures via Dec26-30/-40put spreads,Ultra Bond(CME) Dec26120/115put spreads, and2Y(CME) Dec265.00/4.75put spreads.
B. The Counter-Thesis: Post-Midterm Fiscal Restraint, Corporate Profit Reversion, and the Dovish Pivot
In institutional finance, no view goes unchallenged. A competing cohort of macro desks—analyzing the exact same November 2026 landscape following the U.S. midterm elections—sees the exact opposite setup: a looming growth cliff and a massive bond rally.
Here is the anatomy of the bullish bond (dovish rates) desk positioning:
The Buffett Indicator for Margins (
Rule 13.1): Corporate profits as a share of U.S. GDP have hit an all-time record high of 13%. Quantitative historians on the desk are flagging Warren Buffett’s seminal 1999 warning on unsustainable profit margins. Under Rule 13.1 (GDP/Inflation Dynamics), extreme margin expansion inevitably precedes mean reversion via either wage compression or demand destruction. If corporate earnings roll over in 2027, the Fed will be forced to slash rates regardless of structural AI capex.Midterm Election Fallout (
Rule 20.8): Desks modeling the U.S. midterm elections—specifically scenarios involving political gridlock or a Democratic sweep of Congress—project reduced fiscal stimulus and lower political uncertainty. Under Rule 20.8 (Dovish Fiscal = Bullish Bonds), fiscal restraint reduces the term premium on long-end Treasuries (ZNandZB). In these models, a December rate hike probability (still priced at 79% in certain Fed FundsFFZ6models at the 5.25–5.50% range) represents the final blow-off top of the tightening cycle, with December 2027 (FFZ7) and Dec 2026/GEcontracts rapidly repricing toward 3.5%–4.50% terminal rates.The MBS Prepayment Paradox: Following solar and residential energy provider Sunrun’s (
RUN) 33% surge on earnings, desks noted surprising resilience in housing-adjacent verticals. However, if Treasury yields plummet on a 2027 recession, a wave of mortgage refinancings will hit the agency market. Consequently, fixed-income desks are buying puts on FNMA 30-Year MBS futures (/MBF) to hedge against prepayment risk if rates fall.
C. Global Sovereign Divergence: Bunds, Italian BTPs, and the Indian Bond Boom
The U.S. Treasury market does not exist in a vacuum. Cross-border fixed-income arbitrage is generating some of the highest Sharpe-ratio trades of Q4 2026:
The European Duration Squeeze (
FGBLvs.FBTP): In Europe, the ECB’s ongoing Quantitative Easing (QE) unwind is reducing reinvestment flows, putting structural selling pressure on German Bund futures (FGBL). Eurex Bund options (OGBL) show heavy put skew, with institutions buying120–125strike puts onFGBL Dec26. Yet, simultaneously, ultra-long Italian BTP futures (FBTP) have rallied 13% in just two months (highlighted in desk commentary referencing the “I BTP lunghissimi” phenomenon), driven by institutional hunger for convexity (where modified duration exceeds 20 on the BTP 2072 issue).Hedging Italian Political Risk: Despite the rally, heavy issuance (such as the dual-tranche “BTP Valore” retail/institutional auctions) and Italian political friction over pension reforms (“pensione a 64 anni”) have desks nervous. Institutions are net short BTP tail risk via options, executing BTP/Bund spread trades: buying
FBTPDec26110strike puts while financing them by sellingFGBLDec26135strike calls to protect against a sovereign spread blowout.The UST/Bund Fiscal Dominance Pair: With the correlation between U.S. 10Y Notes (
ZN) and German Bunds (FGBL) breaching 0.82 (triggering aRule 14.6alert), desks are pair-trading LongZN/ ShortFGBLto exploit U.S. fiscal dominance and diverging ECB/Fed liquidity profiles.India’s 10-Year Bond Rally (
NSE): On the National Stock Exchange of India (NSE) and the LSE, Indian sovereign debt just recorded its best week in seven years, with 10-year yields dropping 22bps on massive foreign institutional inflows and expectations of Reserve Bank of India (RBI) dovishness. Desks are aggressively Long 10-Year GOI Futures (NSE: GSEC10YR) and executing calendar spreads—Long Dec 2026 vs. Short Mar 2027 (GSECDEC26-GSECMAR27)—to harvest lucrative roll yield.
Section 3: The Energy & Commodity Super-Cycle — Hormuz Tail Risk, Chinese Diesel Cuts, and the $4,000 Gold Paradigm
Nowhere is the tension between geopolitical supply shocks and macro demand destruction more violent than in the commodities complex.
Visualization 3: The Energy & Geopolitical Shock Transmission Mechanism
========================================================================================
           GEOPOLITICAL & SUPPLY SHOCK TRANSMISSION IN ENERGY DERIVATIVES
========================================================================================

  [TRIGGER 1: MIDDLE EAST ESCALATION]          [TRIGGER 2: ASIAN REFINERY SHIFTS]
  * FGE NexantECA: US/Israel strike risk       * Energy Aspects: China Nov diesel
    on Iran within 2 months.                     exports slashed to 580k tons
  * Threatens Strait of Hormuz (~20% of          (vs. 980k forecast; -400k ton cut).
    global oil flows / 17-21 mb/d).
  * Houthi attacks on Saudi infrastructure.
                   |                                            |
                   v                                            v
  +-----------------------------------+        +-----------------------------------+
  | CRUDE OIL VOLATILITY & SPREADS    |        | REFINED PRODUCTS & CRACK SPREADS  |
  | * Brent Dec26 +3.2% to $92.50/bbl |        | * ICE Gas Oil Dec26 rallies +3.8% |
  | * Brent ATM IV surges 35% -> 42%  |        | * Brent-RBOB Crack widens to $22  |
  | * 25d Risk Reversal at +3.2 (Call)|        |   (vs. $18 3-month average)       |
  | * Brent-WTI widens to $4.50/bbl   |        |                                   |
  +-----------------------------------+        +-----------------------------------+
                   |                                            |
                   +--------------------+-----------------------+
                                        |
                                        v
            =========================================================
            INSTITUTIONAL OPTIONS-ON-FUTURES EXECUTION MATRIX:
            * Tail Risk:     Brent Dec26 120/140 Call Spreads
            * Core Upside:   Brent Dec26 95/100 Call Spreads
            * Range/Pin:     WTI Dec26 90/95/100 Call Butterflies
            * Vol Arbitrage: Short WTI 70/65 Put Spreads to fund Calls
            * Distillates:   ICE Gas Oil Dec26 900/950 Call Spreads
                             NYMEX ULSD Dec26 3.00/3.20 Call Spreads
            * Policy Hedge:  WTI Dec26 80/75 Put Spreads (2027 Trump
                             pro-drilling supply glut hedge)
            =========================================================
A. Crude Oil (BRN, CL): Trading the Strait of Hormuz vs. Post-Midterm Liquidations
Energy desks are navigating a two-sided minefield. On the geopolitical front, energy consultancy FGE NexantECA has issued a stark warning regarding escalating friction between the U.S./Israel and Iran (alongside internal Israeli political-military tensions involving figures like Eisenkot), projecting a tangible risk of a kinetic strike on Iran within the next two months. Such an event directly threatens the Strait of Hormuz, the chokepoint for roughly 20% of global petroleum liquids (~17–21 million barrels per day). Compounded by ongoing Houthi drone and missile strikes on Saudi Arabian energy facilities, December 2026 ICE Brent (BRN) surged 3.2% to $92.50/bbl, pushing CFTC managed money net-long positioning in Brent to 6-month highs.
The options surface reflects acute fear of an upside price explosion:
Brent Implied Volatility: Dec26 ATM IV jumped from 35% to 42% over the past month, with 25-delta risk reversals printing at +3.2 in favor of calls. Seasonally, November and December historically exhibit 12% higher Brent volatility due to OPEC+ ministerial meetings and northern hemisphere winter weather uncertainty.
Backwardation Steepening: The Dec 2026 vs. Jun 2027 Brent calendar spread is deeply backwardated at $2.50 to $3.50/bbl (while WTI Dec26/Jun27 sits at +$1.50), signaling intense near-term physical tightness.
The Brent-WTI Blowout: Because Middle East supply disruptions hit seaborne Brent directly while landlocked Cushing WTI is buffered by U.S. production, the Brent-WTI spread (
ICE-NYMEX) has blown out to $4.50/bbl, nearly double its 3-month average of $2.50/bbl. Desks are actively buying Brent-WTI spread options (specifically Dec263.00/5.00call spreads).
The Counter-Move: Post-Midterm Whipsaws and the 2027 Supply Glut
Yet, crude is not a one-way bet. In the immediate aftermath of the U.S. midterm elections, oil prices whipsawed violently on hopes of diplomatic Middle East de-escalation and demand concerns. In one two-week window, Dec26 WTI futures (CLZ6) dropped 8% toward the $90/bbl mark, triggering a massive liquidation cascade that wiped out $1.1 billion in leveraged crypto longs and forced managed money to slash net-long CLZ6 positions by 25%.
During that post-midterm flush, CL Dec26 80 strike straddles suffered a severe volatility crush (IV dropped 15%), while swap dealers stepped in to hedge via Dec26 70 strike puts, leaving 25-delta puts 5% richer than calls on the WTI curve. Furthermore, looking ahead to 2027, despite a minor Baker Hughes rig count uptick (+1 oil rig), institutions are actively buying Dec26 WTI 80/75 put spreads to hedge against a projected 2027 supply glut driven by the Trump administration’s pro-drilling deregulatory policies, as well as shorting CLZ6 via Dec26/Mar27 calendar spreads to play the traditional post-Thanksgiving seasonal demand dip.
B. Refined Products & Natural Gas: The Chinese Diesel Shock and European Grid Spend
While crude oil grabs the headlines, the highest-conviction institutional trades are occurring in refined products and global gas:
The China Diesel Cut (
ICE Gas Oil,ULSD): According to Energy Aspects, China has slashed its November diesel export quotas to just 580,000 tons—a massive 400,000-ton reduction compared to the prior forecast of 980,000 tons. This sudden removal of Asian barrels has tightened global middle distillate balances ahead of winter.ICE Gas OilDec26 futures immediately rallied 3.8%, with institutions piling into Gas Oil Dec26900/950call spreads, NYMEX ULSD (Heating Oil) Dec263.00/3.20call spreads, and Brent-Diesel (ICE) Dec2620/25crack spread calls. Meanwhile, U.S. refinery margins remain robust, with the Brent-RBOB gasoline crack spread widening to $22/bbl (vs. its $18 3-month average), prompting hedging via Dec26 Brent-RBOB18/22call spreads and RBOB2.50/2.70calls.Global Natural Gas (
TTF,JKM,Henry Hub): The gas market is sharply bifurcated between Eurasian tightness and North American structural headwinds:Europe & Asia (Bullish): European benchmark
TTF(ICE) Dec26 futures rallied 5.2% on winter supply concerns, pushing ATM IV to a massive 58% (up from 50% a month prior) with a +2.8 bullish risk reversal skew. Long-term gas demand resilience in Europe was underscored by an ACER report showing a 155% increase in European grid spending (led by Germany and Greece), while Egypt announced plans to expand gas production to 6.6 bcf/d by 2027 (up from ~5.5 bcf/d currently) to bolster LNG exports. The TTF-JKM spread has widened to+$2.50/MMBtufor Dec26. Institutions are buying TTF Dec2640/45call spreads, TTF35/40/45call butterflies (targeting a pin at €40/MWh), and Platts JKM Dec2616/18call spreads to hedge Asian LNG demand. With TTF-Brent correlation at 0.68, desks are also buying TTF-Brent Dec2615/20call spread options.United States (
Henry Hub- Mixed/Bearish): While some seasonal desks hold/NGDec263.00/3.50call spreads andNov26–Jan27winter strips (Rule 13.5), the broader institutional flow in NYMEX Henry Hub is defensive. Persistent LNG export delays (such as ongoing friction around facilities like Freeport LNG) and the Biden administration’s $2.2 billion cuts to hydrogen hub funding have curtailed long-term industrial gas demand upside. Consequently, institutions are buying Henry Hub Dec263.50/3.00and3.00/2.50put spreads, while arbitraging the-0.45inverse correlation between Asian and U.S. gas via Dec26 JKM/Henry Hub spread futures.
Carbon Markets (
EUA,RGGI): Utilities are actively utilizing December 2026 ICE EU Emissions Allowances (EUA) futures and U.S. Regional Greenhouse Gas Initiative (RGGI) futures for year-end compliance hedging as data-center power burn forces higher thermal generation.
C. Precious & Base Metals: The Tale of Two Gold Regimes and the AI Copper Squeeze
When analyzing institutional gold (GCZ6) reports across global desks this week, an extraordinary phenomenon appears: depending on the specific contract specification, index weighting, or macro stress-test scenario being run by the desk, Gold is being traded across two vastly different price regimes:
The Baseline COMEX Regime ($2,200 – $2,500/oz): Across standard COMEX Dec 2026 desks, Gold is trading around $2,350/oz (+1.8%), supported by central bank accumulation (China, Russia), Middle East election uncertainty, and EU regulatory delays (surrounding SEPA and GDPR rulings). Here, CFTC net-long positioning is at 3-year highs, Gold ATM IV (
GVZ) sits at a manageable 18%–19% (below theRule 4.625% threshold, with a +1.2 bullish call skew), and institutions are trading Dec262,300/2,400and2,400/2,500call spreads (and2,200/2,400call backspreads) for upside, while using2,200/2,100put spreads to hedge against payroll-driven USD spikes.The USD-Collapse / Super-Cycle Regime ($4,085/oz): Simultaneously, in macro shock models tracking a post-midterm USD Plunge (
DXYdropping to 101.25) and extreme sovereign debt monetization, gold prices are modeled at a staggering $4,085/oz, withGVZspiking from 18 to 22. In this high-nominal regime, desks are buying Dec 2026$4,200OTM calls (GCZ6) to hedge against a total U.S. dollar collapse and executing$4,100strike straddles around Federal Reserve FOMC meetings.
Silver (SI) and the Gold/Silver Ratio (85:1)
Silver (SIZ6) is trading at $30.50/oz (+2.1%), outperforming gold on the margin due to surging industrial demand from AI data center electrical infrastructure, EVs, and solar panel manufacturing. However, Silver’s implied volatility (VXSLV) has reached 28%. Under Rule 4.6, crossing the 25% vol threshold has triggered an automated 50% reduction in short-volatility strategies (forcing desks to cover short SI strangles).
How are institutions playing the spread? With the Gold/Silver ratio sitting near an elevated 85:1, desks are divided:
Recession Hedgers: Going Long Gold (
GCZ6) vs. Short Silver (SIZ6) (or buyingGCDec262200calls while sellingSIDec2625puts) to bet on industrial demand destruction if a recession hits.Industrial/Mean-Reversion Bulls: Going Long Silver vs. Short Gold, and buying Dec26
SI30/35call spreads to ride the solar and AI buildout.
Base Metals (HG, ALI): Bloom Energy vs. IAMGOLD
In base metals, COMEX Copper (HGZ6) rallied 2.5% on Chinese diesel export cuts and supply chain bottlenecks, while LME Aluminum jumped 1.8% on fears of supply disruptions to Russian Arctic metal exports. Desks are caught between two micro-signals: the bullish power/infrastructure narrative (exemplified by Bloom Energy’s (BE) fuel cell deployment for AI data centers) versus signs of a broader Chinese industrial slowdown and mining cost inflation (highlighted by IAMGOLD’s operational struggles). Institutions are net buyers of upside convexity, accumulating COMEX Copper Dec26 4.00/4.50 and 4.50/4.75 call spreads (ATM IV at 28%), LME Copper Dec26 9,500/10,000 call spreads, and LME Aluminum Dec26 2,500/2,700 call spreads.
D. Agricultural & Soft Commodities: Black Sea Wheat, El Niño Cocoa, and the 9-Day Soybean Slide
Institutional agricultural desks (CBOT, ICE) are executing textbook seasonal and weather-driven derivatives strategies (Rule 13.5):
Wheat (
ZWZ6) & Corn (ZCZ6): Escalating risks to the Russia-Ukraine Black Sea grain corridor sent CBOT Wheat rallying up to 10% in recent two-week windows and Corn jumping 3.1%. Institutions bought CBOT Wheat Dec26600strike calls and Corn500/550call spreads to hedge global food inflation (while financing them by sellingZC400strike puts). Because weather tail risks remain acute, Wheat options show a 3% put skew (with Dec26550puts trading richer than calls), and market makers are tradingZWstraddles.Soybeans (
ZSZ6): Soybeans recently suffered a brutal 9-consecutive-day losing streak amid heavy U.S. harvest pressure. Citing Rule 13.11 (”Do not chase extended trends”), disciplined quant desks are avoiding late outright shorts, instead using Nov2612.00puts or Dec261300/1350call spreads for counter-trend stabilization, alongside Long Corn (/ZC) / Short Soybeans (/ZS) spread trades to capture shifting biofuel and ethanol blending mandates.Softs (
Cocoa,Coffee,Sugar):ICE Cocoa (
CCDec26): Heavy institutional long positioning driven by El Niño supply deficits in West Africa; strong call skew with demand concentrated in$4,500+calls.ICE Coffee (
KCDec26): Net short institutional positioning due to a Vietnamese Robusta harvest surplus; desks are buying Dec26$1.80 / $1.70bear put spreads.ICE Sugar (
SBDec26): Rallied 2.8% as rising Brazilian ethanol demand diverts cane away from sugar mills; commercials and funds are hedging via Dec2622/24call spreads.
Section 4: Equity Indices & Volatility — The AI Valuation Reset, GLP-1 Rotation, and the Death of the Thanksgiving Rally
The U.S. equity market in November 2026 is confronting a harsh reality: when 5-year Treasury yields are at 4.85% and corporate profit margins are at 13% of GDP, valuation multiples have zero room for error.
A. S&P 500 (ESZ6), Nasdaq-100 (NQZ6), and Russell 2000 (RTYZ6)
With the S&P 500 (ES Dec 2026) hovering around the 5,200 level (-0.8%) and the Nasdaq-100 (NQ Dec 2026) trading near 17,500–18,000 (-1.2%), institutional CFTC positioning shows speculators are net short NQ futures.
Three fundamental headwinds are driving institutional equity hedging:
The AI Hardware & Software Pullback: The invincible AI momentum trade has fractured. Bellwether Nvidia (
NVDA) is down 13% over the past month, while high-beta AI software play Palantir (PLTR) just endured an 8-day consecutive losing streak. Under Rule 13.1, markets discount fundamental deceleration rapidly. Compounding the issue, post-midterm political analysis suggests Democrats are eyeing strict regulatory and environmental limits on AI data center power consumption, threatening the growth trajectory of hyperscalers.Sector Rotation (
Tech vs. Healthcare): Rather than exiting equities entirely, institutions are executing a massive cross-sector rotation. Following Eli Lilly’s (LLY) blowout earnings showing 39% revenue growth driven by GLP-1 weight-loss and metabolic drugs, desks are going Long Healthcare Futures (/XLVDec26 calls) vs. Short Nasdaq-100 (/NQDec26 calls) to rotate out of deflating AI multiples and into secular pharmaceutical cash flows. Simultaneously, desks are buying Financials (/XLF) Dec2640/45call spreads to play a steepening yield curve, while shorting small-cap Russell 2000 (RTYZ6) via Dec262,200puts and2,200/2,000put butterflies, as small-cap balance sheets buckle under inverted yield curves (Rule 20.1).The Death of the Thanksgiving Rally (
Rule 13.5): Quantitative seasonal models—referencing institutional research such as “Borsa USA, addio al rally del Thanksgiving”—have flagged a structural decay in the traditional late-November holiday rally in post-1988 market regimes characterized by high interest rates. Rather than buying the Thanksgiving dip, institutions are shortingESZ6via Dec265,000puts and executing bearish risk reversals (buying Dec264,800puts and selling5,200calls) or5,200/5,000and5,000/4,800put spreads (4,500/4,000for deep crash protection). For range-bound theta collection, desks are tradingES5,100/5,200/5,300and4,900/5,000/5,100call butterflies, while usingNQDec2618,000/17,500put spreads and18,000/17,000strangles to trade tech earnings dispersion.
Global Equity Indices (FESX, NKD, APZ6, Z)
Euro Stoxx 50 (
/FESX): Plagued by European industrial stagnation and ECB QT, institutions are buying Dec264,500/4,300put spreads (and pairing Long BundsFGBLZ6vs. ShortFESXZ6as a pure European recession hedge).Nikkei 225 (
/NKD): With the Bank of Japan (BoJ) caught between currency defense and yield curve control, desks are buying Dec2638,000/36,000straddles to capture BoJ policy volatility.ASX 200 (
ASX: APZ6): A major global outperformer, soaring +2.6% on the back of gold, copper, and iron ore strength. With a +0.70 correlation to Gold, institutions are Long Dec26SPI 200(APZ6) futures and buying7,500strike calls.FTSE 100 (
/Z): Following a post-hike fade in Bank of England (BoE) hawkishness, desks are buying Long/ZDec26 calls to bet on UK rate cuts and energy-heavy index outperformance.
B. The Volatility Complex (VIX, VVIX, Variance Swaps) and Rule 4.6
To understand institutional behavior in November 2026, one must understand Rule 4.6: The Volatility Regime Position-Sizing Mandate. Quantitative risk engines do not treat volatility as a linear variable; they use discrete regime thresholds to mechanically throttle portfolio leverage:
========================================================================================
              INSTITUTIONAL RULE 4.6: VOLATILITY REGIME SIZING PROTOCOL
========================================================================================

   VIX / Asset IV Level          Risk Regime Classification      Mandatory Action
----------------------------------------------------------------------------------------
   < 18% (e.g., GVZ at 18%)      Low / Normal Volatility         100% Baseline Sizing
   18% - 24% (VIX Post-Midterm)  Elevated Uncertainty            Reduce Short-Vol / Sizing by 25%
   25% - 35% (VIX Spot ~28)      High Stress / Election Vol      Reduce Portfolio Risk by 50%
   > 35% (Tail Shock Threshold)  Crisis / Liquidity Freeze       Reduce Risk by 50% (BTC) to 75% (GC)
========================================================================================
Currently, the VIX term structure is in contango, with Dec 2026 VIX futures (VXZ6) trading around 24 and Mar 2027 (VXH7) at 22 (while spot VIX has oscillated between 18 post-midterms and 28 during pre-election/rate spikes).
How are volatility desks trading this surface?
VIX Call Spreads: Rather than buying expensive outright VIX futures that suffer from contango roll decay, institutions are buying VIX Dec26
20/25and25/30call spreads to lock in cheap convexity against a year-end liquidity event.The January Effect Roll: Sophisticated desks are actively rolling long
VXZ6positions from December 2026 into January 2027 to hedge the historical “January Effect” reallocations and new-year tax-loss/rebalancing volatility.VVIX & SVIX Mean Reversion: Following insights discussed on institutional derivatives forums (such as the Volatility Views desk breakdowns), when the VVIX (volatility of volatility) spikes above 100, VIX mean reversion becomes statistically probable. Desks are expressing this by buying puts on SVIX (Short VIX ETN) or trading VIX/ES ratio spreads.
OTC Variance Swaps: For pension funds and macropods seeking pure convex crash protection without strike-pinning risk, desks are going Long 3-Month S&P 500 Variance Swaps at a 25% volatility strike.
Section 5: Foreign Exchange (FX) — The King Dollar Tug-of-War, Central Bank Intervention, and EM Carry
The foreign exchange futures market (ICE, CME, SGX, NSE) is the ultimate release valve for global macro divergence. Under Rule 14.5, higher relative U.S. interest rates mechanically drive USD strength, which in turn acts as a wrecking ball for dollar-denominated commodities (Rule 14.1).
A. The U.S. Dollar Index (DXY / DXZ6) & G10 Majors
Just as in fixed income, FX desks are split between the Strong Payrolls / Hawkish Fed regime (DXY at 105.50 to 108.50) and the Post-Midterm Gridlock / Fed Pivot regime (DXY plunging to 101.25).
In the dominant Strong USD regime:
DXY Positioning: Net-long institutional positioning on ICE (
DXZ6rallying +0.7% to +3% across multi-week windows). Because 1-month DXY implied volatility recently compressed near historic lows of 7% to 9.5%, income desks have been selling wide100–110strangles while directional bulls buy Dec26105/107and105/110call spreads (hedging downside with105/100put spreads). However, desks are closely watching USD Funding Stress, noting that the SOFR-OIS spread has widened to 20bps, an early warning sign of interbank dollar tightness.EUR/USD (
6EZ6): With Eurex Euribor futures (FGBM) pricing zero ECB hikes in 2027 and European growth stagnating, the Euro is under severe pressure. Institutions are shorting6EZ6via Dec261.05puts and1.05/1.00put spreads, or executing risk reversals (selling EUR puts to fund USD calls). BecauseEUR/USDvs.Bund (FGBL)correlation sits at -0.75 (Rule 14.6), desks are hedging via6EZ6/FGBLpair trades. (Conversely, dovish-Fed counterbalance desks hold Dec261.15calls and1.12straddles for ECB meeting volatility).Japanese Yen (
6JZ6/USD/JPY): The Yen is ground zero for central bank intervention. Desk intelligence—highlighting regional Asian currency defense such as the “Taiwan Dollar: CBC intervention” reports—points to imminent Bank of Japan (BoJ) support as USD/JPY tests the 155–160 zone. Institutions are playing this from both sides: buying CME6JZ6calls (Dec260.0065strike) and JPY150/155call spreads, sellingUSD/JPY155puts, and structuringUSD/JPY155/160/165call butterflies to pin the intervention ceiling.British Pound (
6BZ6) & Commodity Currencies (6A,6C): As noted in “Weekly Forex Recap” desk briefs, GBP weakness accelerated following a dovish BoE hike, prompting institutions to short6BZ6via Dec261.20puts. Meanwhile, China’s industrial slowdown is pressuring the Australian Dollar, where desks holdAUD/USD (/6A)Dec260.65/0.62put spreads, while oil bulls holdCAD/USD (/6C)Dec26 calls.
B. Emerging Markets (CNY, INR, MXN, BRL): Rare Earths, PBoC Easing, and Nearshoring
Emerging market FX derivatives are being driven by geopolitical supply chains and local central bank cycles:
Chinese Yuan (
USD/CNY6CNZ6//CNH): Two forces are pushing the Yuan weaker toward 7.30–7.50 (up from 7.25 prior): escalating U.S.-China trade tensions over Rare Earths and AI competition (driving a +0.80 correlation between DXY and USD/CNH) and domestic People’s Bank of China (PBoC) monetary easing. Institutions are heavily hedging Yuan depreciation by buying Dec26USD/CNY7.35/7.40and7.30/7.50call spreads (and6CNZ67.20strike puts on inverted CME contracts).Indian Rupee (
USD/INR6INZ6/NSE: USDINRZ6): The Rupee is a portrait of stability and strength, bolstered by massive foreign inflows into Indian sovereign bonds and a -0.65 inverse correlation with crude oil (where oil pullbacks directly improve India’s current account). Expecting the RBI to manage volatility and potentially cut rates into strength, institutions are selling CME6INZ6Dec2685strike calls to collect premium, going Long NSEUSDINRZ6futures, buying Dec2682.00puts for RBI intervention hedges, and executingDec 2026 vs. Mar 2027(USDINRZ6-USDINRM7) calendar spreads.LatAm Carry (
MXN,BRL): On the CME and SGX, macro funds remain structurally Long Mexican Peso Dec 2026 (6MZ6) to capture U.S. manufacturing nearshoring flows, and Long Brazilian Real Dec 2026 (6LZ6) as a high-carry proxy for agricultural and iron ore commodity exports.
Section 6: The Quantitative Playbook — Income Generation & Cross-Asset Execution Matrix
For institutional portfolio managers and sophisticated derivatives traders, synthesizing macro narratives is only half the battle; the edge lies in trade construction. When implied volatility is elevated (VIX ~22–28, MOVE ~120, BTC IV ~65–70%), buying outright options is a losing proposition due to theta decay and vega crush.
Instead, desks are relying on structured spreads and systematic income generation rules:
Rule-Based Cash-Secured Puts on Oil: Selling
Dec26 75 strike putson WTI crude futures (/CL) to harvest rich put skew, strictly governed by the40-Delta, 30-DTE (Days to Expiration)institutional income rule.Covered Calls on Equities: Selling
Dec26 5,000 strike callsagainst core long/ESfutures positions to generate yield in a range-bound, post-election market.
To bring all twenty-five pages of institutional desk data into a single, actionable reference guide, below is the Master Institutional Strategy Matrix for Late 2026 / Early 2027.
Visualization 4: The Master Institutional Trade & Hedging Matrix (Dec 2026 – H1 2027)
Macro Theme / Regime Primary Futures Trade Options-on-Futures Structure Quantitative Rule / Catalyst 1. BTC Whale Short Squeeze Long CME BTC Dec26 (vs. Perp Shorts) Buy $80K Calls / Sell $70K Puts (Risk Reversal) Hyperliquid record shorts + negative perp funding (-0.03%). 2. Crypto Miner & DeFi Hedge Short CME ETH Dec26 & ETH/BTC (0.055) ETH $1,800/$1,600 Put Spreads; BTC $70K/$85K Flys 6 weeks of ETH ETF outflows; Rule 4.6 (50% cut if VIX > 35). 3. AI Capex / 2007 Yield Highs Short 5Y (FVZ6 at 4.85%) & Ultra 10Y (TN) FVZ6 4.5%/4.75%/5.0% Put Flys; 10Y 4.50/4.75 Calls Record CFTC 5Y short; AI data center rate pressure; MOVE at 120. 4. Yield Curve Recession Unwind Long 2Y (TUZ6) / Short 10Y (ZNZ6) Steepener CME 2Y-10Y -30/-40 Put Spreads; UB 120/115 Puts Rule 20.1: 2s10s inverted -25 to -35bps (deepest since 2000). 5. European Sovereign Spread Long ZN / Short German Bund (FGBL) Buy FBTP Dec26 110 Puts / Sell FGBL 135 Calls Rule 14.6 (ZN/Bund corr 0.82); Italian pension risk vs. 13% BTP rally. 6. Hormuz Geopolitical Tail Long ICE Brent (BRNZ6) Dec26/Jun27 Spread Brent 95/100 & 120/140 Call Spreads; WTI 90/95/100 Fly FGE NexantECA Iran strike warning (20% global oil); IV at 42%. 7. Global Distillate Squeeze Long ICE Gas Oil Dec26 & NYMEX ULSD Gas Oil 900/950 Call Spreads; ULSD 3.00/3.20 Calls China slashes Nov diesel exports by 400k tons (to 580k tons). 8. Eurasian vs. US Gas Divergence Long TTF Dec26/Jun27 Spread; JKM/HH Arb TTF 35/40/45 Call Flys; Henry Hub 3.00/2.50 Put Spreads ACER +155% EU grid spend vs. Biden $2.2B hydrogen cut & LNG delays. 9. Stagflation & Gold vs. USD Long GCZ6 / Short SI (85:1 Ratio) or DXZ6 GC 2400/2500 Calls (or $4,200 Calls in USD-drop model) Rule 14.4 (Uncertainty) vs. Rule 14.5 (USD strength); VXSLV at 28%. 10. AI Bubble vs. GLP-1 Rotation Short Nasdaq (/NQ) / Long Healthcare (/XLV) /ES 5000/4800 Put Spreads; /RTY 2200/2000 Put Flys Rule 13.1: Corp profits at 13% GDP; NVDA -13%, PLTR 8-day slide; LLY +39%. 11. BoJ & PBoC FX Divergence Long DXZ6 / Short 6EZ6; Long MXN & INR Buy 6JZ6 0.0065 Calls; USD/CNH 7.30/7.50 Call Spreads CBC/BoJ intervention at 155–160 JPY; Rare earths trade friction. 12. Volatility Regime Tail Hedge Roll Long VXZ6 (Dec26) to Jan27 VIX Dec26 20/25 & 25/30 Call Spreads; 3M S&P Var Swaps Rule 4.6: VIX 22–28 mandates 25%–50% position sizing reduction.
Conclusion: The Three Commandments for 2027
As institutional desks close their books on the November 2026 midterm cycle and position for 2027, the overarching message from the derivatives market is one of disciplined paranoia.
If you are managing capital in this environment, the institutional playbook boils down to three core commandments derived from the quantitative rules highlighted across these reports:
Respect the Volatility Regime (
Rule 4.6): Never maintain static position sizing when the volatility surface shifts. With the VIX oscillating between 18 and 28, Silver IV at 28%, TTF Gas IV at 58%, and Bitcoin realized vol at 75%, survival requires mechanically cutting notional exposure by 25% to 50% as thresholds are breached, replacing naked delta with defined-risk option spreads (butterflies, put spreads, and zero-cost risk reversals).Audit Your Hidden Correlations (
Rule 14.6): In late 2026, seemingly unrelated trades are secretly the exact same bet. Being long Ethereum is a 0.72-correlated bet on the Nasdaq-100; being short German Bunds is a 0.82-correlated bet on U.S. 10-Year Treasuries; being long the Australian Dollar or Copper is an implicit bet on Chinese industrial policy and AI data center moratoriums. Use cross-asset spread options (likeGC-BrentandTTF-Brent) to isolate true alpha from macro beta.Do Not Chase Yesterday’s Narrative (
Rule 13.1&Rule 13.11): Markets in late 2026 are discounting information at breakneck speed. Chasing Soybeans after a 9-day losing streak, banking on a historical pre-1988 Thanksgiving equity rally when 5-year yields are at 4.85%, or assuming corporate profit margins can remain at 13% of GDP indefinitely are fatal errors.
The transition from 2026 to 2027 will not reward passive beta. It will belong to the desks that harvest roll yield in backwardated energy curves, fade extreme retail and whale crowding in crypto perpetuals, and own cheap tail convexity across rates and volatility before the liquidity tide goes out.
Thank you for reading this week’s institutional deep-dive. If you found this quantitative breakdown valuable, share it with your desk and subscribe for our upcoming December FOMC and Year-End Roll special report.