

For most of 2025 the story was simple: inflation was cooling, the Fed was cutting, and the yield curve was climbing out of a long inversion. In 2026 that story broke. Inflation reaccelerated, the Fed reversed course and raised rates, and the 10-year Treasury yield traded above 5%.
Six series from FRED, the free economic database run by the Federal Reserve Bank of St. Louis, tell most of the story. For each chart below you’ll get what it measures, where it stands and how it got there, plus a plain-language “explain it like I’m 5” version, what it means for the US, and what it means for the global economy. Then I put them all together.
All data is from FRED, pulled November 10, 2026. Where the source agency had a newer print than FRED, I say so.
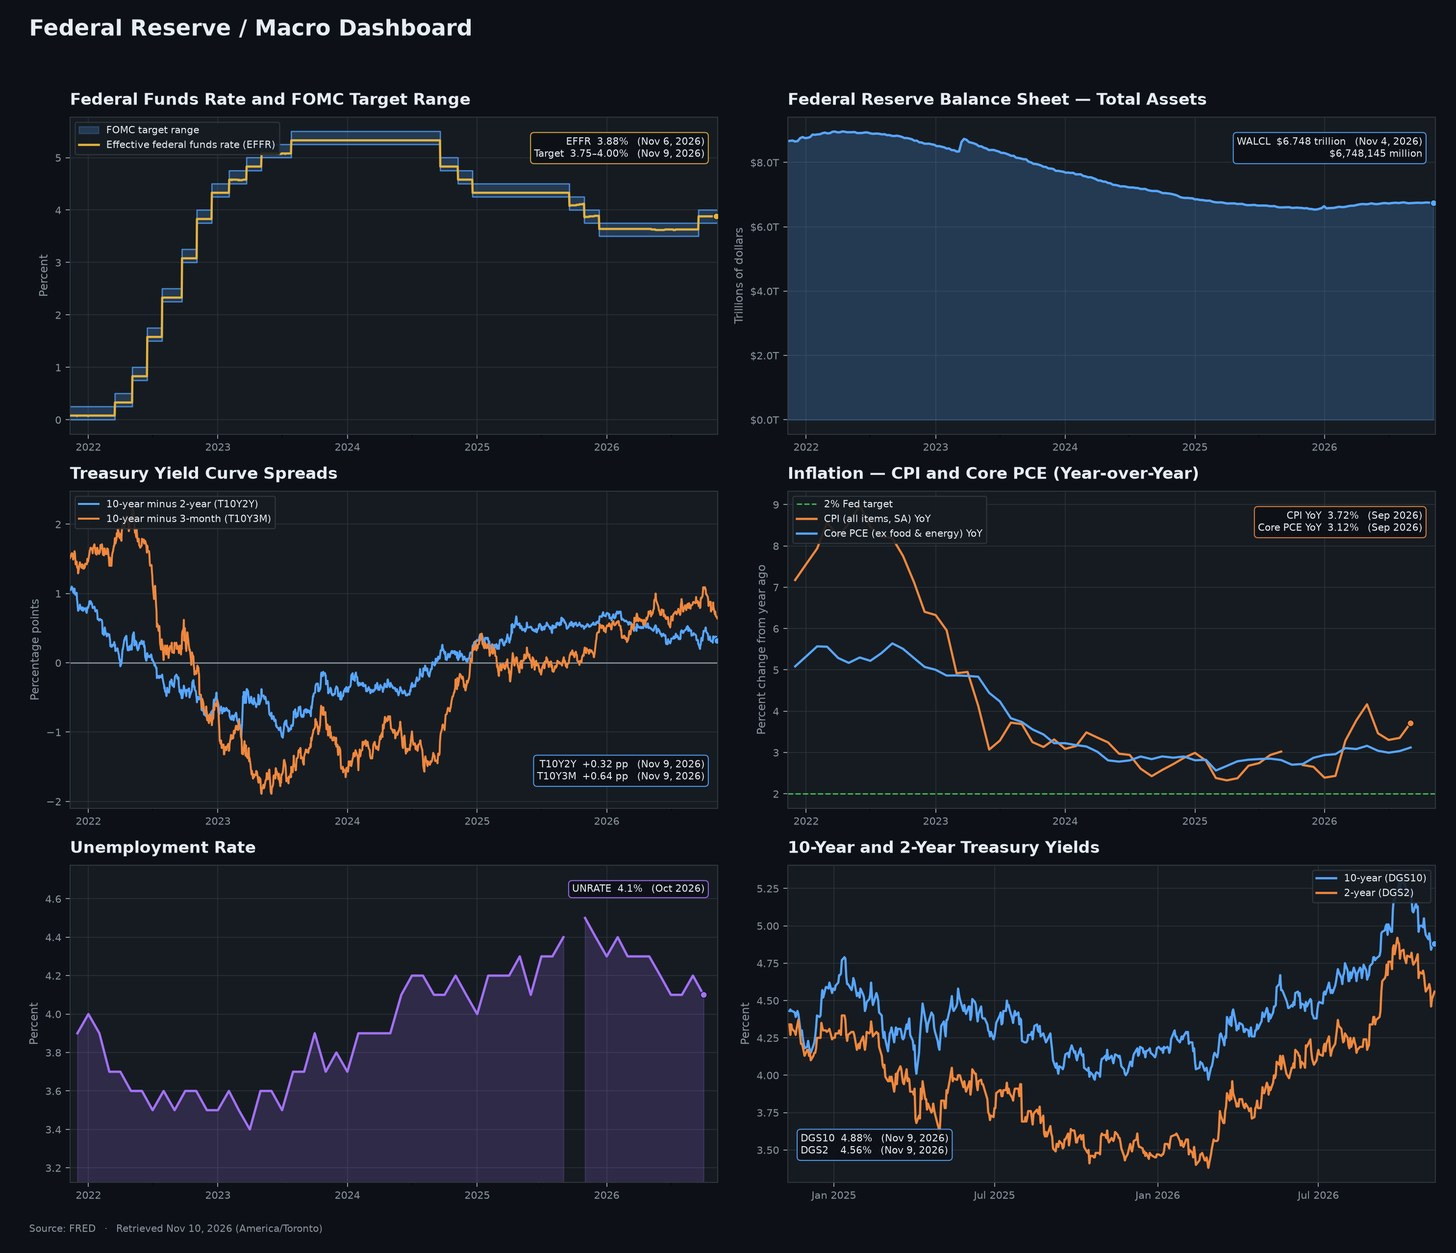
The full dashboard: policy rate, balance sheet, curve spreads, inflation, unemployment and Treasury yields. Five-year view, two years for yields.
1. The policy rate: a cutting cycle that ended in a hike
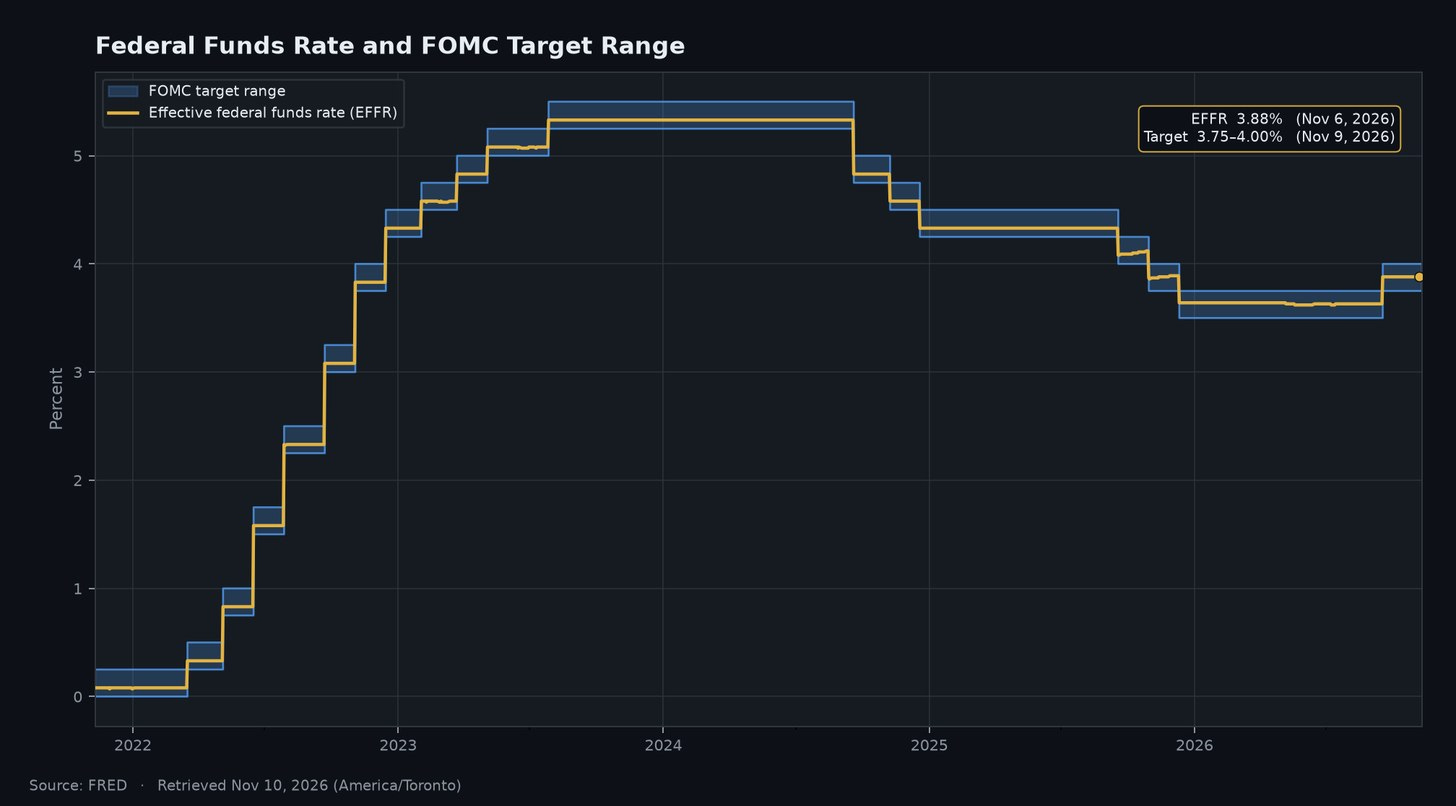
What it is. The shaded band is the FOMC’s target range for the federal funds rate (FRED DFEDTARU for the upper bound and DFEDTARL for the lower). The gold line is the effective federal funds rate (EFFR), the rate banks actually pay each other overnight, published daily by the New York Fed.
Where it stands. The target range is 3.75%–4.00%. The EFFR printed 3.88% on November 6, in the middle of the band.
How it got here. The chart has three acts:
Hiking (2022–2023). From March 2022 the FOMC lifted the range from near zero to 5.25%–5.50% by late July 2023. The EFFR peaked at 5.33%.
Cutting (September 2024 to December 2025). The range came down in stages to 3.50%–3.75%, a total of 175 basis points.
Reversal (2026). The range held through most of 2026. Then, in mid-September, FRED records a 25-basis-point increase to 3.75%–4.00%. The EFFR moved from 3.63% to 3.88% the same day.
Why it matters for traders. A hike nine months after the last cut tells you the Committee decided inflation (chart 4) was a bigger risk than the labor market (chart 5). The funds rate anchors the front end: SOFR futures, the 2-year note and the cost of carry. Once a central bank shows it will reverse, the market has to price a two-sided path, and front-end volatility usually rises.
Explain it like I’m 5
Imagine the Fed runs a lemonade stand that lends money instead of lemonade. The fed funds rate is the price of borrowing for one night. When things get too expensive in the toy store, the Fed raises that price so people borrow and spend a bit less. In September it raised the price a little, because prices in the toy store started climbing again.
What it means for the USA
Households feel this through credit card rates, auto loans and adjustable-rate loans, which tend to follow the policy rate. Businesses that borrow on floating rates pay more to finance inventory and payrolls. The government feels it too: short-term Treasury bills reprice quickly, so a higher policy rate raises the interest cost of the federal debt.
What it means for the global economy
The fed funds rate is, in effect, the world’s base rate. A higher US rate tends to make dollar deposits and bills more attractive, which can pull capital toward the US and support the dollar. Other central banks then face a choice: follow the Fed to defend their currencies, or accept weaker exchange rates and more imported inflation.
2. The balance sheet: no longer shrinking
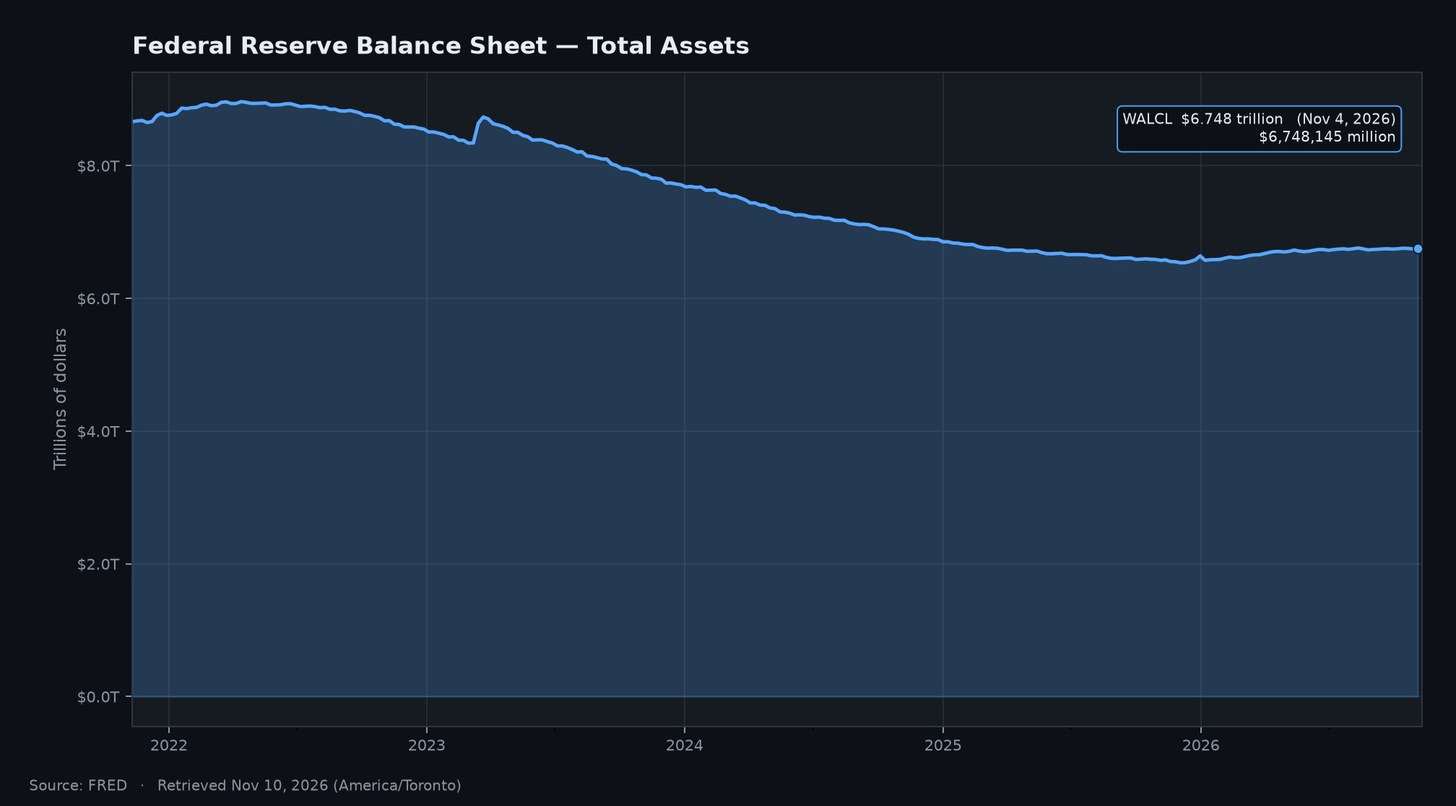
What it is. WALCL is total assets on the Federal Reserve’s balance sheet, reported weekly in the H.4.1 release. It is the simplest measure of how much liquidity the Fed’s asset holdings provide.
Where it stands. $6.748 trillion ($6,748,145 million) as of November 4, 2026.
How it got here. WALCL peaked at about $8.965 trillion in April 2022. Quantitative tightening (QT) then let securities roll off, and the chart shows a long, steady slide. The one visible bump is the March 2023 emergency lending during the regional bank stress.
The slide ended in late 2025. The post-2023 low was $6.536 trillion on December 3, 2025. Since then the line has drifted up, and it is about $175 billion higher than a year ago ($6.573 trillion on November 5, 2025).
Why it matters for traders. This is the most interesting split in the dashboard. On rates the Fed is tightening, but its balance sheet is no longer shrinking, so reserves are not being drained the way they were from 2022 to 2025. Policy is tighter on price and roughly neutral on quantity.
Explain it like I’m 5
Think of the Fed’s balance sheet as a giant bathtub of money. In 2020 and 2021 the Fed poured lots of water in. From 2022 it pulled the plug and let water drain out slowly. Since late 2025 the plug has been back in, and the water level is creeping up a little.
What it means for the USA
The Fed’s bond holdings help keep long-term borrowing costs, including mortgage rates, lower than they would otherwise be. Shrinking the balance sheet removed that support; holding it steady stops the drain. For the Treasury, a Fed that is no longer letting bonds roll off means private investors don’t have to absorb as much new government debt.
What it means for the global economy
Dollar liquidity is global plumbing. Foreign banks, companies and governments borrow and settle trade in dollars, so when the Fed drains reserves, dollar funding gets tighter worldwide. A balance sheet that has stopped shrinking eases that pressure at the margin. It reduces the risk of a dollar shortage, which tends to hit emerging markets first.
3. The yield curve: out of inversion, and choppy
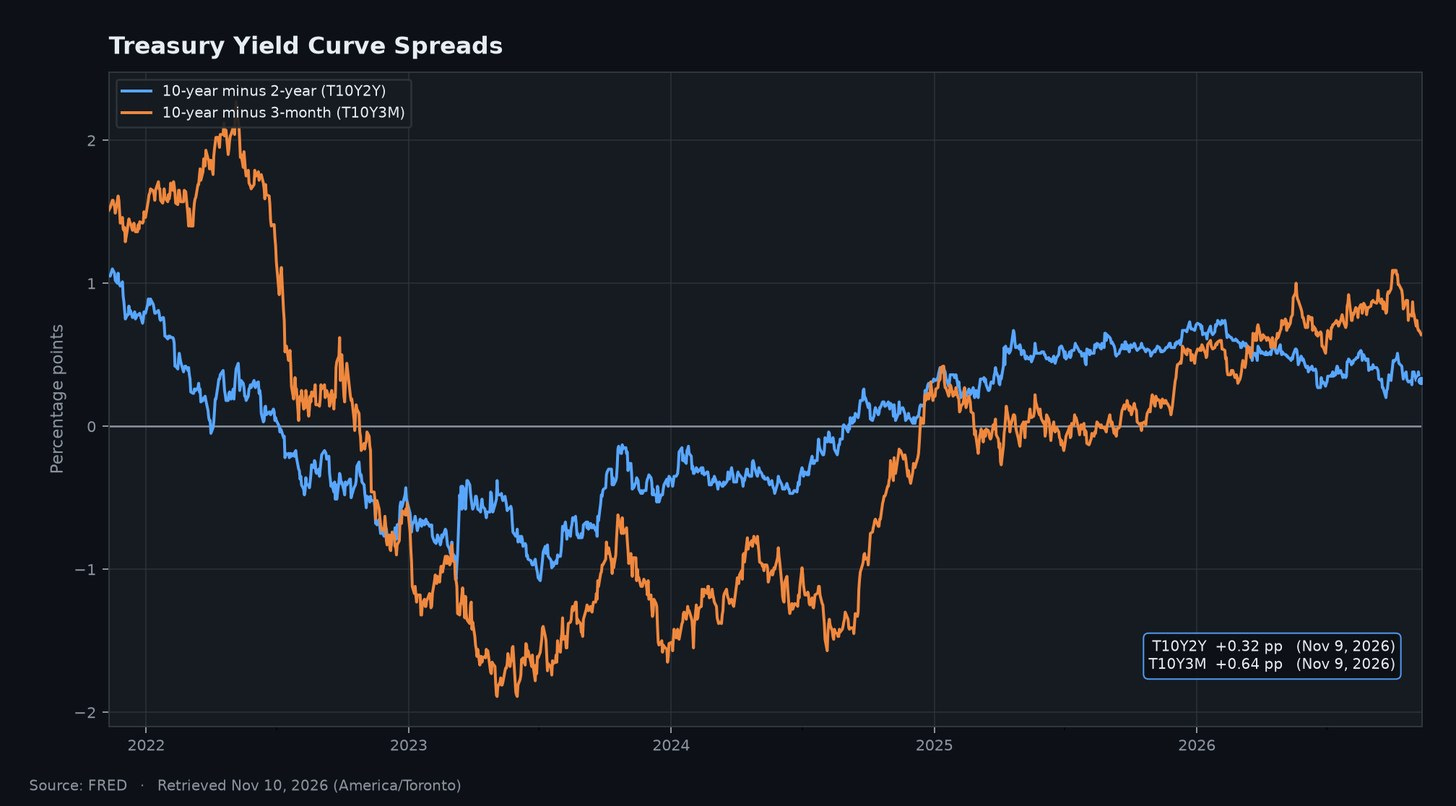
What it is. Two classic recession-signal spreads, both daily and in percentage points:
T10Y2Y: the 10-year Treasury yield minus the 2-year.
T10Y3M: the 10-year minus the 3-month.
Where it stands. On November 9: T10Y2Y +0.32 and T10Y3M +0.64. Both are positive, so the curve slopes upward.
How it got here.
T10Y2Y went negative in April 2022, bottomed at −1.08 in July 2023 and last closed below zero in early September 2024. It steepened to +0.74 on January 30, 2026, then flattened as the 2-year climbed. It dipped to about +0.20 around the September hike, bounced to near +0.50 in early October, and is +0.32 now.
T10Y3M, which many economists prefer as a recession indicator, inverted in October 2022 and went much deeper, to −1.89 in May 2023. It hovered near zero for much of 2025 and last closed negative in mid-October 2025. It then steepened to +1.09 on September 30, 2026, before easing to +0.64.
Why it matters for traders. First, the recession that inversion seemed to predict has not shown up in unemployment. Joblessness rose modestly and has eased this year (chart 5).
Second, the two spreads are telling different stories. 10s-2s flattened through 2026 because the 2-year rose faster than the 10-year. That is a bear flattener, the signature of a market pricing a more hawkish Fed. 10s-3m widened because the 3-month bill moves only when the Fed does, while the 10-year priced in more inflation and term premium. Since early October, both spreads have narrowed as long yields came off their highs.
Explain it like I’m 5
Normally, if you lend your piggy bank money to a friend for ten years, you ask for a bigger reward than if you lend it for a few months, because ten years is a long time to wait. When short loans pay more than long loans, the line is “upside down,” and grown-ups worry. From 2022 to 2024 it was upside down. Now it’s right side up again, but only just.
What it means for the USA
Banks borrow short and lend long, so a positive curve helps their lending margins and their willingness to lend. A flattening curve squeezes that margin again. For households, the long end drives mortgage rates while the short end drives savings rates.
What it means for the global economy
The US curve is a benchmark for pricing debt around the world. A steep US curve driven by higher long-term yields tends to push borrowing costs up in other bond markets too. An inverted curve has historically been read worldwide as a warning about US demand, and the US is a major buyer of the world’s exports.
4. Inflation: the second wave
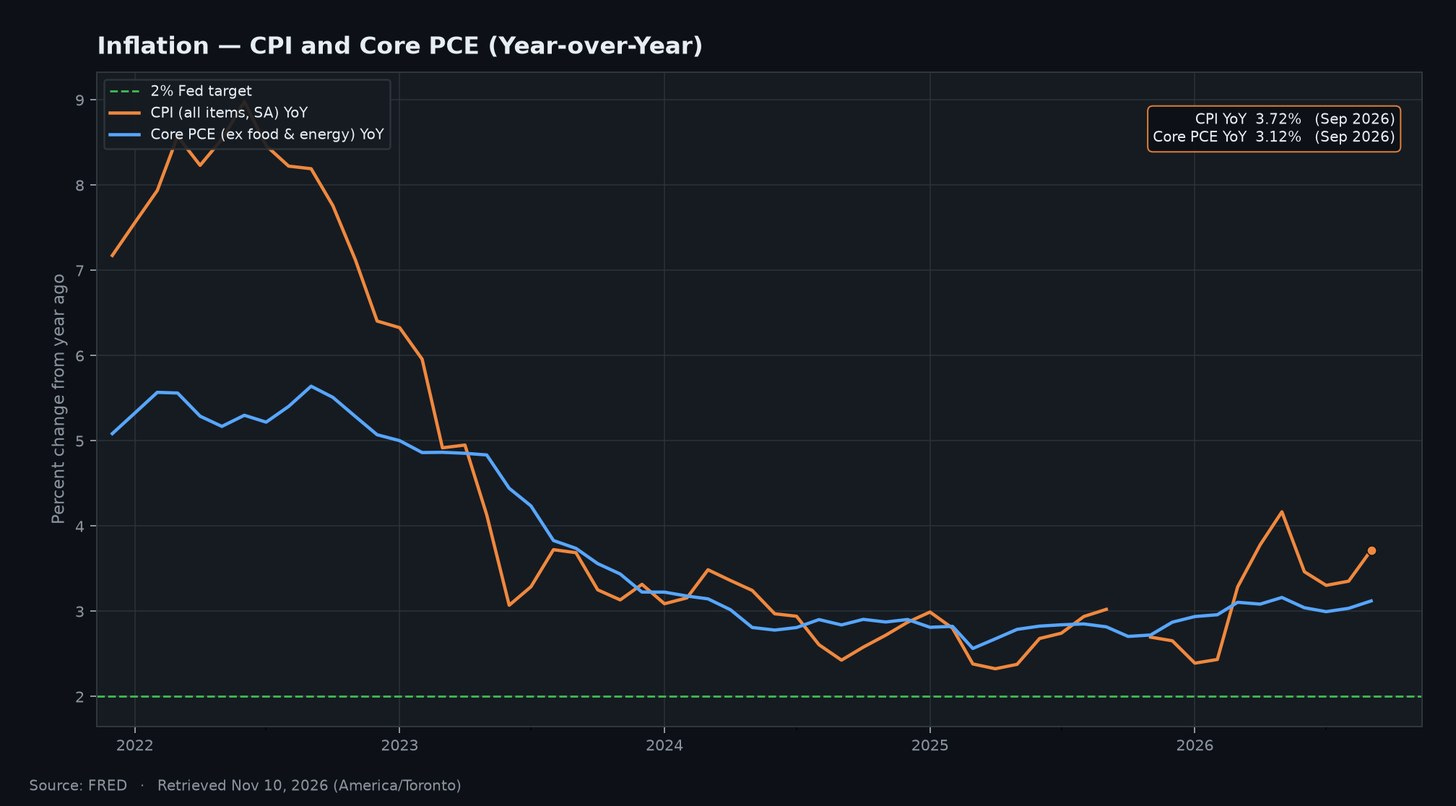
What it is. Two measures, shown as year-over-year percent change:
CPIAUCSL: headline Consumer Price Index (BLS, seasonally adjusted).
PCEPILFE: the PCE price index excluding food and energy (BEA). Core PCE is the measure closest to the Fed’s 2% target.
Where it stands. For September 2026, headline CPI is up 3.72% year over year and core PCE is up 3.12%.
How it got here. Headline CPI peaked at 8.98% in June 2022 and core PCE at 5.64% in September 2022. Both fell through 2023 and 2024. Then:
Core PCE stalled in the high 2s through 2025. It crossed 3% in March 2026 and has stayed above 3% in six of the last seven months.
Headline CPI fell back to 2.39% in January 2026, then jumped to 4.17% by May. It cooled to about 3.3% over the summer and rebounded to 3.72% in September. On a monthly basis, CPI rose 0.65% in September, and the last three months annualize to about 4.6%.
There is no October 2025 CPI observation in FRED, so the chart shows a gap there.
Why it matters for traders. This chart explains chart 1. With core inflation stuck above 3% and headline running hotter, a central bank with a 2% target doesn’t get the benefit of the doubt. CPI and PCE days are once again where the front end reprices, and real yields and breakevens deserve as much attention as nominal yields.
Explain it like I’m 5
Inflation is how much more your favorite snack costs this year than last year. If a $1.00 snack now costs about $1.04, that’s about 4% inflation. The Fed wants it to be about 2 cents more each year. Right now snacks are getting more expensive faster than the Fed wants.
What it means for the USA
Inflation above 3% erodes paychecks unless wages keep up, and it hits lower-income households hardest because more of their budget goes to essentials. Businesses face rising input costs and have to decide whether to pass them on. For markets, sticky inflation means higher rates for longer.
What it means for the global economy
US inflation travels. It keeps the Fed tighter, which keeps the dollar firmer, which makes dollar-priced commodities more expensive in other currencies. Countries that import heavily from the US, or price their trade in dollars, can import some of that inflation. At the same time, other central banks fighting their own inflation find it harder to cut rates while the Fed is hiking.
5. The labor market: softened, then stabilized
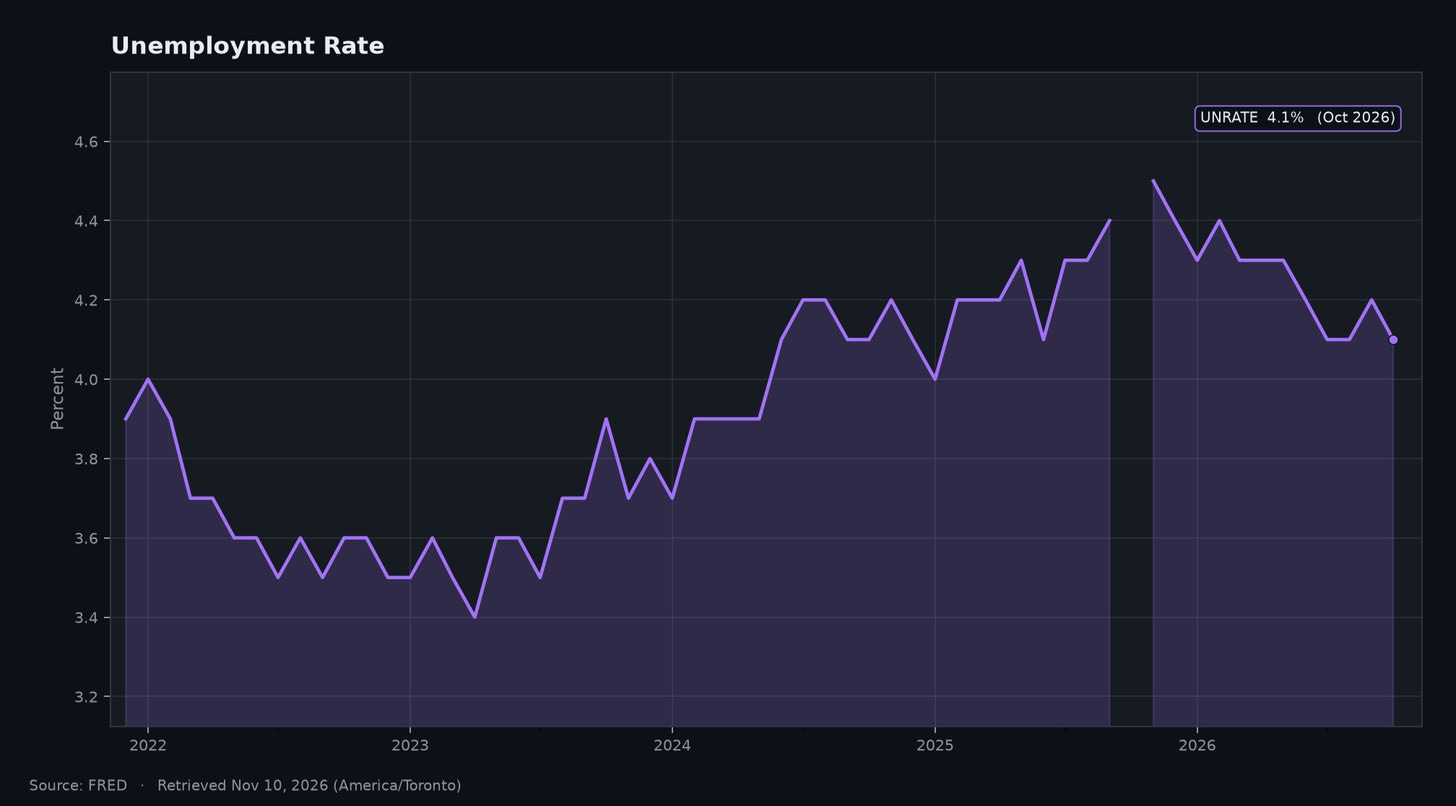
What it is. UNRATE is the civilian unemployment rate from the BLS household survey, monthly and seasonally adjusted.
Where it stands. 4.1% in October 2026.
How it got here. Unemployment bottomed at 3.4% in April 2023, rose slowly through 2024 and 2025, and peaked at 4.5% in November 2025. It has since eased: 4.3%–4.4% early in 2026, then 4.1%–4.2% since July. October 2025 is missing in FRED, which leaves a gap in the line.
Why it matters for traders. The 1.1-point rise from the low was a big reason the Fed kept cutting through December 2025. The reversal since then is what gave it room to hike. At 4.1%, the employment side of the dual mandate looks roughly balanced. The price side doesn’t, and that asymmetry is the whole policy case.
Explain it like I’m 5
Imagine 100 grown-ups who want a job. Right now about 4 of them are looking and can’t find one yet. Last year it was a few more. When fewer people are stuck looking, families have more money to spend, and the Fed can worry more about prices.
What it means for the USA
A 4.1% unemployment rate means most people who want work can find it, which supports consumer spending, the largest part of the US economy. For businesses, a tight labor market means steady demand but also wage pressure. For the government, more workers mean more tax revenue and fewer safety-net payments, which helps the deficit.
What it means for the global economy
US consumers are among the world’s biggest buyers of goods and services, so a steady US job market supports exporters in Asia, Europe and the Americas. If US unemployment started rising sharply, weaker US demand would spread through trade, even before any change in Fed policy.
6. Treasury yields: the 10-year breaks 5%
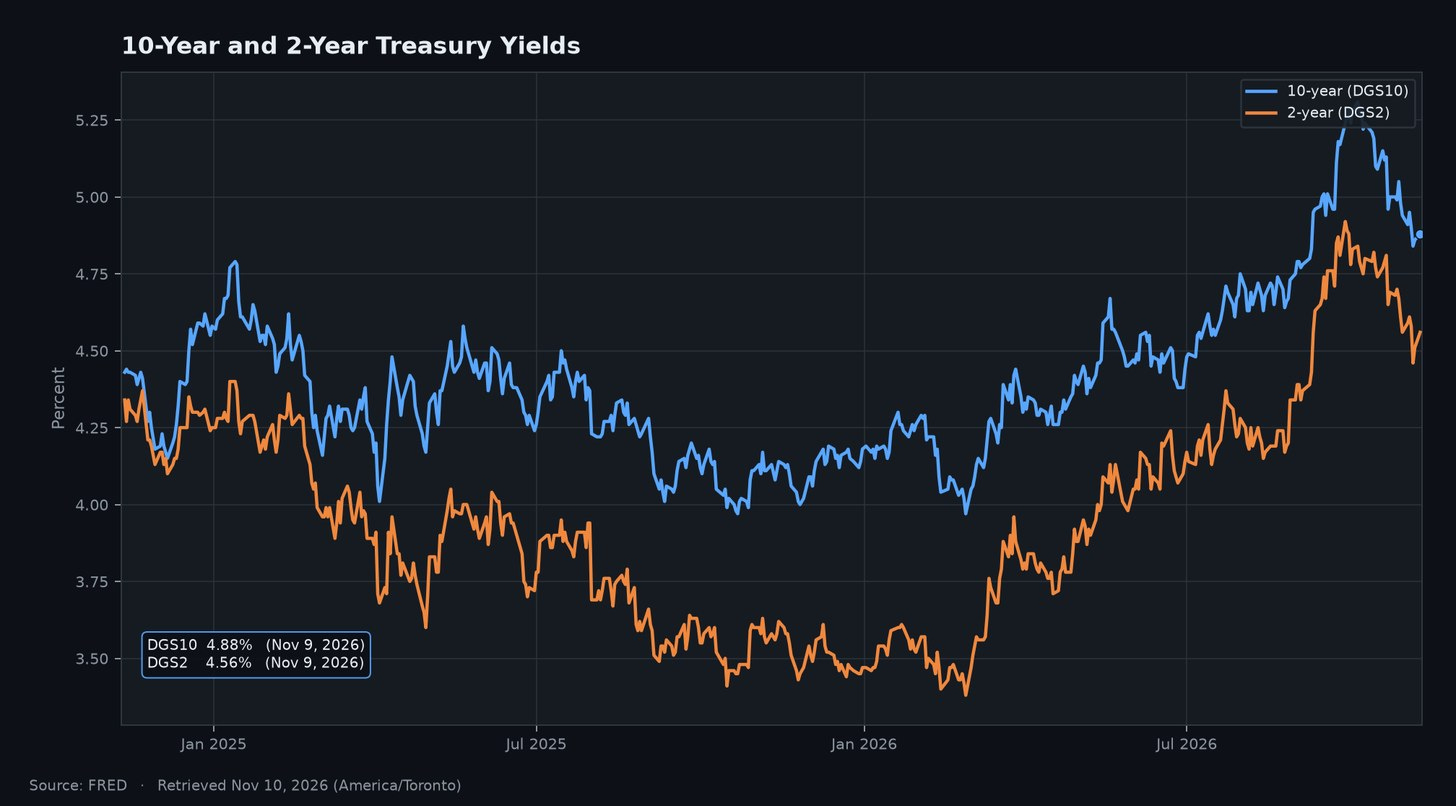
What it is. DGS10 and DGS2 are the 10-year and 2-year Treasury constant-maturity yields from the Federal Reserve’s H.15 release. The window is two years so the 2026 move is easier to see.
Where it stands. The US Treasury’s daily par yield curve for November 9 shows the 10-year at 4.88% and the 2-year at 4.56%. FRED’s latest H.15 observations (November 6) are 4.86% and 4.51%. FRED usually updates with a lag of about one business day.
How it got here. A year ago (November 10, 2025) the 10-year was 4.13% and the 2-year 3.58%. The 2-year bottomed at 3.38% on February 27, 2026, when markets still expected cuts. Then both climbed:
The 2-year rose steadily, then jumped in September (from 4.34% to 4.88% by month-end) and peaked at 4.92% on September 28.
The 10-year first closed above 5% on September 16 and peaked at 5.31% on October 5, the high of the five-year window. It closed above 5% on 23 trading days, the last on October 28.
Since those peaks, the 10-year is down about 40 basis points and the 2-year about 35.
Why it matters for traders. The 10-year is the economy’s discount rate: mortgages, corporate borrowing and equity valuations all key off it. Going from about 4% to over 5% in roughly eight months is a major tightening of financial conditions, stacked on the policy hike. The pullback since October suggests the market thinks the Fed is close to done.
Explain it like I’m 5
When the government needs money, it borrows by selling IOUs. The yield is the reward it promises to pay. The 2-year IOU is a short promise; the 10-year IOU is a long one. This year both rewards went up a lot, which means borrowing became much more expensive for everyone, not just the government.
What it means for the USA
Mortgage rates tend to move with the 10-year, so a jump above 5% makes buying a home harder and slows housing. Companies pay more to issue bonds, which can delay investment. For the government, every new bond it sells now locks in a higher interest rate for years, raising future interest costs.
What it means for the global economy
The 10-year Treasury is the world’s reference safe asset. When it yields more, global investors can earn more by holding US debt, which tends to pull money out of other markets and strengthen the dollar. That raises borrowing costs for governments and companies abroad, especially emerging markets that borrow in dollars.
What it all means
Taken together, the charts describe an economy that dodged the recession the curve warned about, but paid for it with a second round of inflation.
Policy stance versus inflation. With the EFFR at 3.88% and core PCE at 3.12%, the real policy rate is about 0.8 percentage points. Against headline CPI it is close to zero. In 2024, by the same arithmetic, it averaged about 2.2 points (5.15% EFFR minus 2.95% core PCE). Seen that way, the September hike was the Fed rebuilding a real rate that inflation was eroding.
The labor market gives the Fed room. Unemployment falling from 4.5% to 4.1% is what made a hike possible. The two mandates are not pulling equally hard.
The curve is repricing the Fed, not signaling a recession. Neither spread is inverted. A new inversion, especially in 10s-3m, would be the market saying policy has gone too far.
Liquidity is the quiet offset. The balance sheet is no longer shrinking. That probably helps explain why markets haven’t shown more stress, even with the 10-year above 5% for much of October.
The global angle. Put the charts together and the US is exporting tight money. A Fed that has just hiked, a 10-year near 5% and sticky inflation all tend to support the dollar and draw capital toward US assets. That combination usually makes life harder for emerging markets with dollar debt, for importers paying for commodities priced in dollars, and for central banks that would rather be cutting. The one offset is the balance sheet: with the Fed no longer draining dollar liquidity, the risk of a global dollar-funding squeeze is lower than it was during QT.
Three scenarios. These are framings, not forecasts:
Inflation rolls over. Monthly CPI has been noisy in 2026: a decline in June, then +0.65% in September. Calm prints would make September look like a one-off insurance hike, and the front end would rally.
Sticky inflation, solid jobs. The Fed has shown it will hike. More hikes would lift the 2-year and flatten 10s-2s toward zero.
Jobs crack, inflation sticks. This is the hardest case. The two mandates would pull in opposite directions, and volatility across the curve would probably be the main trade.
What to watch next
CPI and core PCE. Is September’s 0.65% monthly CPI rise a trend or a blip?
The jobs report. Does UNRATE hold near 4.1%?
The next FOMC statement. Does it frame September as a one-off or the start of a series?
Thursday’s H.4.1. Does WALCL keep drifting higher?
The 10-year versus 5.31%. Breaking above the October high would mean financial conditions tightening again.
10s-2s versus zero. A return to inversion would be the clearest warning that policy is too tight.
Sources
All data is from FRED, Federal Reserve Bank of St. Louis, retrieved November 10, 2026. The November 9 10-year and 2-year yields come from the US Treasury’s daily par yield curve because FRED hadn’t published them yet.
DFEDTARU, fed funds target range, upper limit: https://fred.stlouisfed.org/series/DFEDTARU
DFEDTARL, fed funds target range, lower limit: https://fred.stlouisfed.org/series/DFEDTARL
EFFR, effective federal funds rate: https://fred.stlouisfed.org/series/EFFR
WALCL, Fed total assets: https://fred.stlouisfed.org/series/WALCL
T10Y2Y, 10-year minus 2-year spread: https://fred.stlouisfed.org/series/T10Y2Y
T10Y3M, 10-year minus 3-month spread: https://fred.stlouisfed.org/series/T10Y3M
CPIAUCSL, CPI, all urban consumers: https://fred.stlouisfed.org/series/CPIAUCSL
PCEPILFE, core PCE price index: https://fred.stlouisfed.org/series/PCEPILFE
UNRATE, unemployment rate: https://fred.stlouisfed.org/series/UNRATE
DGS10, 10-year Treasury yield: https://fred.stlouisfed.org/series/DGS10
DGS2, 2-year Treasury yield: https://fred.stlouisfed.org/series/DGS2
The original publishers are the Federal Reserve Board, the Federal Reserve Bank of New York, the BLS, the BEA and the US Treasury. Year-over-year rates and real-rate figures are my own calculations from FRED data. Charts by The Order Book Edge.
This article is for educational purposes only and is not investment advice. Nothing here is a recommendation to buy or sell any security or futures contract.
If this was useful, subscribing to The Order Book Edge is free.