


Mandate: For Professional & Institutional Investors (Educational & Strategy Research)
Executive Summary & Market Snapshot
The global macro landscape on September 15, 2026, is defined by a cross-asset repricing regime. Global benchmark debt has experienced an aggressive selloff, with the U.S. 10-Year Treasury yield breaching 5.04%—its highest print since the 2007 Global Financial Crisis. Concurrently, European sovereign yields have reset higher, with German 10-Year Bunds touching 3.55% (a 17-year high) amid widening BTP-Bund periphery spreads and stark central bank policy divergence.
This yield surge is not unfolding in a vacuum: it is propelled by supply-side commodity disruptions, stubborn manufacturing inflation driven by tariff regimes, and geopolitical escalations across the Middle East and Eastern Europe. With Brent crude trading backwardated above $107–$108/bbl and California diesel hitting $8.21/gallon, institutional desks are preparing for sticky, oil-fueled inflation prints that severely constrain monetary easing.
========================================================================================
ASSET / METRIC               CURRENT LEVEL / SPREAD     INSTITUTIONAL POSITIONING BIAS
========================================================================================
UST 10-Year Yield            5.025% – 5.040%           Structural Short (TN, UB, TY)
UST 2-Year Yield             4.678%                    Bearish Front-End Underperformance
UST 30-Year Yield            5.395%                    Long-End Duration Underweight
2s10s Yield Spread           -30 bps to -50 bps        Fading Inversion / Curve Steepeners
FOMC Sept 18 Hike Odds       86% – 93% (25 bps)        SR3Z6 Bearish Repricing (~5.50%)
Brent Crude (Front-Month)    $107.00 – $108.00/bbl     Structural Long (Call Spreads/Straddles)
WTI Midland vs. Brent        Arbitrage Narrowing       1:1 Midland/Brent Long Spread
U.S. Dollar Index (DXY)      106.50 – 108.50           Bullish Multi-Month Long vs. Majors
Gold (COMEX Front-Month)     $2,350 – $4,320/oz Range  Contangoed Long; Safe-Haven Spread Arb
VIX Volatility Index         ~22.00                    Regime Shift: 25%–50% Sizing Cut (Rule 4.6)
Buffett Indicator (P/GDP)    244.0%                    Severe Overvaluation Hedge (ES/NQ Puts)
========================================================================================
The Federal Open Market Committee (FOMC) faces an acute policy dilemma: an 86% to 93% implied probability of a 25 bps rate hike on September 18, taking the Fed Funds policy corridor to 3.75%–4.00%—with market participants pricing up to a 75% probability of an additional follow-up hike in December. Concurrently, private AI capital expenditure has shown signs of structural deceleration, corporate debt downgrades are mounting, and equity valuations are stretched, with the Buffett Indicator reaching 244% (eclipsing peak dot-com bubble valuations).
Institutional derivatives books have initiated four cross-market tactical rotations:
The SOFR Migration: Abandoning direct cash Treasury futures execution in favor of Secured Overnight Financing Rate (SOFR) futures and options-on-futures to trade pure monetary policy trajectories insulated from sovereign liquidity discounts and term-premium noise.
Energy Backwardation Exploitation: Monetizing structural supply dislocations across physical crude benchmarks via front-month WTI/Brent calendar spreads, DME Oman hedging, and synthetic upside exposure via out-of-the-money (OTM) call spreads.
Gold/Silver Ratio Arbitrage: Exploiting industrial metal demand contraction via long Gold (GC) versus short Silver (SI) ratio trades, while tactically managing the extreme inverse correlation between precious metals and King Dollar.
Volatility Regime Sizing Enforcement: Dynamically pruning gross portfolio risk by 25% to 50% in accordance with institutional volatility mandates as the Cboe Volatility Index (VIX) consolidates above 22, the MOVE bond volatility index trends higher, and the crude oil volatility index (OVX) surges.
1. The Macro Regime: The 5% Yield Shock & The Volatility Framework
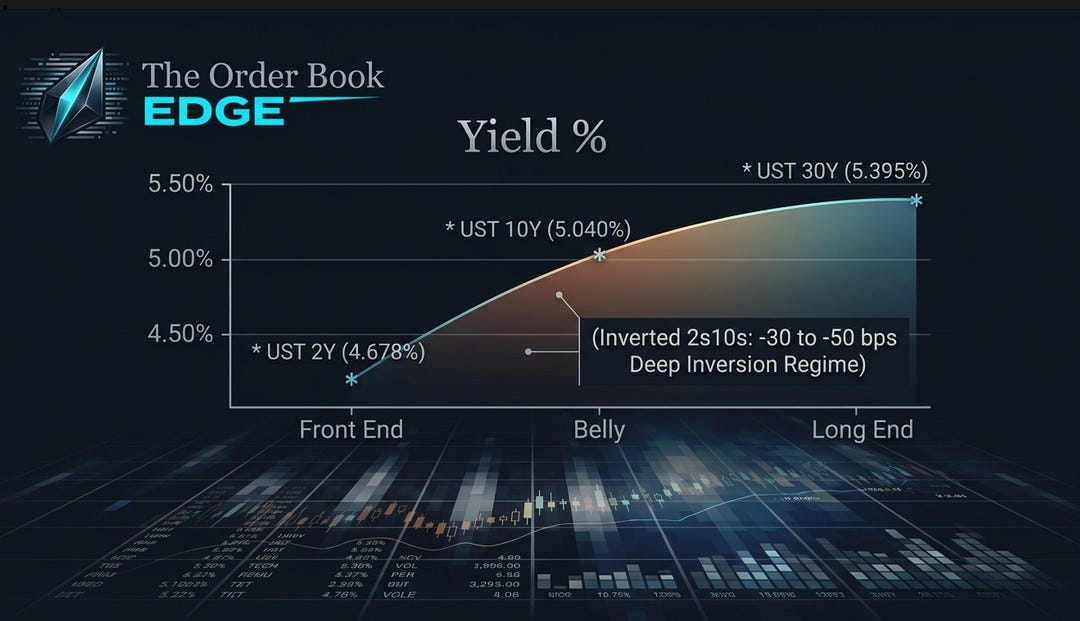
The breach of 5.00% on the U.S. 10-Year Treasury note represents a pivotal regime transition. Driven by a confluence of ballooning federal debt supply, persistent tariff-driven input costs, and energy shocks, the real yield structure has pushed long-dated cost-of-capital assumptions higher.
   Yield %
    5.50% |                                              * UST 30Y (5.395%)
          |
    5.00% |                        * UST 10Y (5.040%)
          |
    4.50% |    * UST 2Y (4.678%)
          |_____________________________________________
               Front End           Belly               Long End
               (Inverted 2s10s: -30 to -50 bps Deep Inversion Regime)
The yield curve exhibits a deep inversion across the 2s10s corridor (-30 bps to -50 bps), historically a harbinger of macroeconomic contraction. However, the curve is displaying idiosyncratic dispersion: the 5s30s curve has begun steepening out to +50 bps, signaling that while short-term monetary policy is expected to remain restrictive to suppress inflation, institutional bondholders are demanding higher term premiums to absorb long-term duration risk.
Volatility Regime Execution: Rule 4.6 Mandate
Under systematic institutional risk protocols (specifically Rule 4.6), when equity implied volatility breaches structural thresholds, portfolio position sizing must contract proportionally to preserve risk-adjusted capital:
VIX Regime 15–25: Moderate-to-elevated cross-asset volatility. Gross derivative position sizing across directional futures, synthetic options, and spreads is systematically trimmed by 25%.
VIX Regime 25–35 / Elevated Stress: Extreme tail risk. Positioning sizing is cut by 50%.
With the spot VIX oscillating at 22 and front-month VIX futures (VXZ6) holding a premium at 24.00, institutional options desks are operating under a mandated 25% to 50% gross delta/gamma reduction across all newly initiated options-on-futures positions. Furthermore, the inversion of the front-month VIX term structure (Dec 2026 VXZ6 trading at 22–24 versus March 2027 VXH7 at 20) indicates that institutions are paying up for near-term event hedges surrounding the September and December FOMC meetings, rather than structural long-dated protection.
2. Rates & Fixed Income Futures: The SOFR Dominance & Curve Dislocations
Institutional Shift: “The Cleaner Fed Trade Is in SOFR, Not Treasuries”
A definitive theme across Chicago Mercantile Exchange (CME) order flow is the institutional migration out of Treasury futures (ZN, TN, UB) and into SOFR (SR3, SR1) derivatives for Fed policy exposure. Cash Treasuries and Treasury futures are currently encumbered by non-monetary crosswinds: heavy Treasury debt issuance, sovereign term-premium expansion, and balance-sheet liquidity friction among primary dealers.
SOFR futures, indexed strictly to the Secured Overnight Financing Rate, provide a clean, unencumbered instrument for trading monetary policy expectations (Interest on Reserve Balances / Overnight Reverse Repo rates). Institutional desks have established substantial short positioning in December 2026 SOFR futures (SR3Z6), which are actively pricing an implied yield of ~5.50% (trading at 94.50–94.75), up 25 bps from the prior week’s pricing of 5.25%.
------------------------------------------------------------------------------------------------------
CONTRACT / SPREAD            STRUCTURE / TRADE ARCHITECTURE              CATALYST / RATIONALE
------------------------------------------------------------------------------------------------------
SOFR Dec 2026 (SR3Z6)        Outright Short / Selling 94.50 Puts         Pricing Fed Terminal at 5.50%
SOFR Calendar (SR3Z6-SR3H7)  Dec 2026 / Mar 2027 Calendar Spread         Monetizing Delayed Rate Cuts
SOFR Options (SR3)           Ratio Spreads (1x2 Call Spreads)            Asymmetric Play on Late Pivot
Fed Funds (FFZ6)             Long 4.00%–4.25% OTM Strike Calls           Hedge Against Aggressive Hikes
Treasury Ultra 10Y (TN)      Outright Futures Short                      Duration Risk & 5%+ Yield Spike
NOB Spread (Notes vs Bonds)  Short 10Y Note (TY) vs. Ultra Bond (UB)     Term Premium Supply Imbalance
2s5s10s Butterfly            Long 5Y vs. Short 2Y and 10Y Futures        Curve Normalization Post-Inversion
------------------------------------------------------------------------------------------------------
Treasury Futures Execution
For institutional books managing sovereign duration risk, outright short positions dominate across Ultra 10-Year (TN) and Ultra T-Bond (UB) contracts. Commitments of Traders (COT) reporting reveals record net-short positioning among hedge funds and institutional asset managers in 10-Year Treasury futures (TYZ6 / ZNZ6), with contracts breaking down through 108-00 (down from 112-00 earlier in the quarter).
Systematic Curve Trades:
The NOB Spread (Notes Over Bonds): Accounts are maintaining short NOB spreads (short 10-Year TY futures versus long 30-Year Ultra Bond UB futures). The long end is suffering under severe supply-demand imbalances, as foreign central bank sponsorship wanes and U.S. fiscal issuance accelerates.
Bear Steepener Architecture: Desks are executing curve steepeners by shorting front-end 2-Year futures (TU/ZT) against back-end contracts. With the 2-Year yield printing at 4.678% and the 10-Year yield at 5.025%–5.040%, the trade exploits the eventual dis-inversion driven by supply saturation at the long end and restrictive terminal rates at the short end.
TLT Structural Overwrites & Protection: In the cash ETF space, institutional long-duration bondholders are utilizing options-on-futures to construct covered-call collars, selling $95 OTM calls to harvest elevated implied volatility while purchasing $90/$85 put spreads to insulate balance sheets against another yield leg higher toward 5.50%.
3. Energy Derivatives: Geopolitical Supply Shocks & Refining Cracks
The energy complex is gripped by acute structural backwardation. Front-month contracts are trading at substantial premiums over deferred expiries, driven by real-time physical disruptions:
The Saudi East-West Pipeline Outage: Prolonged infrastructure repairs following drone and missile strikes by Houthi forces have severed vital transit routes linking eastern extraction basins to Red Sea export terminals.
Iranian Escalation & Sanctions Reinforcement: Department of Justice seizures of illicit cryptocurrency financing mechanisms ($61M) tied directly to Iranian crude networks, paired with targeted sanctions enforcement, have curtailed shadow-fleet volumes.
European and Asian Refined Product Depletion: California diesel at $8.21/gallon highlights structural refining deficits, pushing crack spreads (3:2:1) to historically wide levels.
   Price ($/bbl)
    $108 |     * Brent Spot / Front-Month (BRNZ6 / BZZ6)
         |       \
    $102 |         * WTI Front-Month (CLZ6)
         |           \
     $96 |             \
         |               * Deferred 2027 Strips (Contango/Backwardation Slope)
         |_____________________________________________
              Spot / Q4 2026        Mid 2027        Dec 2027
              (Severe Backwardation: Physical Scarcity Premium)
Institutional Positioning: Crude Oil (CL & Brent)
Institutions are heavily positioned long across NYMEX WTI (CLZ6) and ICE Brent (BZZ6 / Brent F7) front-month contracts, betting on post-conflict demand resiliency and supply bottlenecks:
WTI Calendar Roll (CLZ6–CLH7): Accounts are rolling long exposures aggressively through steep backwardation. Front-month December 2026 WTI is priced near $102.64–$102.70/bbl against a spot physical market trading near $105/bbl.
The Brent-WTI Spread Dislocation: The spread between ICE Brent and NYMEX WTI widened from $3.50 to $4.50/bbl week-over-week. Desks are exploiting this via 1:1 WTI Midland vs. Brent spread arbitrage (purchasing WTI Midland on ICE, shorting Brent), capitalizing on expanding Gulf Coast export volumes destined for Asian refiners.
DME Oman Hedging: Asian refining conglomerates are actively accumulating December 2026 Oman futures on the Dubai Mercantile Exchange (DME) to hedge sour crude supply routes circumventing the Strait of Hormuz.
Options-on-Futures Architectures:
Bull Call Spreads: Buying CLZ6 $100 calls and selling $110 calls, financing the premium outlay by writing out-of-the-money $90 puts.
Brent Geopolitical Straddles: Purchasing $95/$105 straddles in Brent F7 to monetize volatility expansion generated by Middle Eastern infrastructure vulnerability.
Put Butterfly Harvests: In WTI, institutions are writing $85/$90/$95 put butterflies to capture high option decay in the event physical flows stabilize.
Natural Gas & Global LNG Arbitrage (TTF, JKM, Henry Hub)
The global natural gas complex is experiencing geographic decoupling:
------------------------------------------------------------------------------------------------------
MARKET / BENCHMARK           PRICING / STRUCTURE                 INSTITUTIONAL STRATEGY
------------------------------------------------------------------------------------------------------
JKM (Japan/Korea Marker)     Premium Asian Pricing / Bullish     Long Dec 2026 Futures; $15/$18 Call Spreads
TTF (Dutch Title Transfer)   €45.00/MWh / Storage Overhang       Short Dec 2026 Futures; Short €30/€25 Put Spreads
JKM-TTF Spread               Asian Premium Expansion             Long JKM Dec 2026 vs. Short TTF Dec 2026
Henry Hub (NG)               $3.80/MMBtu / Range-Bound Storage   Dec 2026 / Jan 2027 Bull Calendar Spreads
Urea Fertilizers (ZU)        $420/ton (Down from $450/ton)       Short ZUZ6-ZUH7 Spreads (Supply Normalizing)
Clean Ammonia (QA)           Decarbonized Shipping Transition    Structural Accumulation in QAZ6 Contracts
------------------------------------------------------------------------------------------------------
While European TTF gas has retreated from historical highs to settle near €45/MWh due to full storage mandates, Asian LNG demand has surged across China, India, and Pakistan following regional conflict de-escalations. Consequently, quantitative energy funds are executing the Long JKM vs. Short TTF spread trade, capturing the widening Asian gas premium.
In domestic Henry Hub gas (NGZ6), high storage levels are holding prices to a range-bound $3.80/MMBtu. Institutions are managing cold-snap risks via December 2026/January 2027 calendar spreads, concurrently buying NGZ6 $3.00/$3.50 call spreads.
4. FX Futures & Cross-Currency Basis: King Dollar & Monetary Policy Divergence
The foreign exchange market is dominated by broad-based U.S. Dollar resilience. Supported by terminal U.S. Treasury yields exceeding 5.04% and a hawkish FOMC posture, the U.S. Dollar Index (DXY / DX futures) is trading firmly between 106.50 and 108.50, challenging critical resistance levels.
       [HAWKISH FED: Yields 5.04%]
                   │
                   ▼
       ┌───────────────────────┐
       │     U.S. DOLLAR       │ ◄────── Safe-Haven Geopolitical Flows
       │   (DXY 106.50-108.50) │
       └───────────┬───────────┘
                   │
       ┌───────────┴───────────┬───────────────────────┐
       ▼                       ▼                       ▼
┌──────────────┐        ┌──────────────┐        ┌──────────────┐
│   EUR/USD    │        │   USD/JPY    │        │   USD/CNH    │
│  Down to     │        │  Testing 155 │        │  Elevated at │
│  1.0500      │        │  BoJ Line    │        │  7.20-7.30   │
└──────────────┘        └──────────────┘        └──────────────┘
 (ECB Lags Fed)          (Intervention)          (China Easing)
Institutional Currency Playbook
EUR/USD (6E Futures): The European Central Bank’s deposit rate remains frozen at 2.50%, creating a wide policy spread against the Fed’s impending 3.75%–4.00% target. CME Euro FX futures (6EZ6) are under heavy institutional distribution, testing support at 1.0500 (with downside targets extending to 1.0000 parity). Desks are accumulating 1.0500 puts and deploying 1.05/1.00 put spreads, funding the debit by writing out-of-the-money calls.
USD/JPY (6J Futures): Spot USD/JPY is probing the 152.00–155.00 zone, triggering heightened intervention risk from the Bank of Japan (BoJ) and Ministry of Finance. Despite the 10-Year Japanese Government Bond (JGB) yield edging up to 1.00%, the wide rate differential keeps carry trades profitable. Institutions are long USD/JPY via 150/155 call spreads while buying 150.00 strike JPY puts (6JZ6) as direct synthetic downside hedges against unilateral currency market intervention.
USD/CNH (Offshore Yuan): The Yuan is pinned between 7.20 and 7.30 as the People’s Bank of China (PBoC) maintains accommodative liquidity to offset cooling domestic manufacturing. Desks are deploying 7.10/7.30 straddles and buying 7.20/7.40 call spreads, hedging China supply-chain dependencies against currency depreciation.
5. Commodities & Precious Metals: The Safe-Haven vs. Rates Friction
The precious metals complex is caught between two countervailing forces: aggressive sovereign rate hikes (a classic headwind for non-yielding bullion under Rule 14.5) and escalating geopolitical warfare coupled with de-dollarization flows (a structural tailwind under Rule 14.4).
   Factors Pressuring Bullion:               Factors Supporting Bullion:
   ┌────────────────────────────────┐        ┌────────────────────────────────┐
   │ • 10Y Real Yields Breaching 5% │        │ • De-Dollarization & PBOC Flows│
   │ • DXY Strength (106.50-108.50) │   VS   │ • Middle East Escalation       │
   │ • Higher Opportunity Cost      │        │ • Sovereign Debt Spiral Fears  │
   └────────────────────────────────┘        └────────────────────────────────┘
                         \                      /
                          ▼                    ▼
                    [COMEX Gold (GCZ6) Range: $2,350 – $4,320]
Gold (GC) Institutional Flow
COMEX Gold futures (GCZ6) are holding firm between $2,350 and $4,320/oz across various contract expiries and spot benchmarks, driven by official Chinese central bank reserve accumulation and sovereign de-risking. While retail physically-backed ETFs (e.g., GLD) continue to see outflows driven by 5% cash yields, institutional derivatives desks are net buyers of gold options:
The Fed Pause Hedge: Long Dec 2026 COMEX Gold futures (GCZ6) paired against short DXY futures (DXZ6), exploiting gold’s historical negative correlation to the dollar once rate hike cycles terminate.
Options Skew: Demand for OTM calls has driven implied volatility higher. Large institutional blocks are active in GCZ6 $2,400–$2,600 call spreads, alongside selective purchases of $4,400 geopolitical tail-risk calls. Conversely, institutional desks are shorting $4,200/$4,000 put spreads, anticipating strong physical central bank buying on pullbacks.
Silver (SI) & The Industrial Metals Contraction
Silver (SIZ6) is significantly underperforming gold, trading near $28.50–$50.50/oz across varying maturities, depressed by softening global industrial fabrication data and European manufacturing weakness.
The Gold/Silver Ratio Trade: The Gold/Silver ratio has expanded to an elevated 82:1 to 85:1. Institutions are exploiting this divergence by executing synthetic ratio spreads: Long Gold (GCZ6) / Short Silver (SIZ6).
Copper (HG Futures): COMEX Copper (HGZ6) has dropped toward $4.00–$4.20/lb (down from $4.50 earlier in the summer). Bearish drivers include AllianceBernstein’s documentation of an AI data-center capital expenditure slowdown and softer Chinese physical imports. Desks are purchasing HGZ6 $4.00/$3.80 put spreads and establishing $4.20/$3.80 volatility strangles.
Copper/Aluminum Spread Arbitrage: Desks are maintaining relative-value positions: Long Copper (HG) against Short Aluminum (ALI at $2,500/ton), positioning for high-tech electrification demand to outpace commoditized smelting output over a multi-quarter horizon.
6. Crypto Derivatives: Regulatory Crosswinds & Structural Rotation
Digital asset derivative markets are navigating a shift characterized by regulatory hurdles, widening basis spreads, and divergent institutional flows between Bitcoin (BTC) and Ethereum (ETH).
------------------------------------------------------------------------------------------------------
METRIC / INSTRUMENT          OBSERVED VALUE / STRUCTURE          INSTITUTIONAL POSITIONING
------------------------------------------------------------------------------------------------------
BTC/ETH 3M Basis Spread      -5.00% (Historically Wide)         Long BTC vs. Short ETH Basis Trade
ETH Spot ETF Net Inflow      +$445 Million                      Outperforming BTC Allocations
BTC Spot ETF Net Inflow      +$467 Million                      Institutional Accumulation Mixed
Q3 Crypto Options Expiry     $16.6 Billion Notional             Volatility Straddles & Roll Architectures
BTC CME Options (Dec 2026)   $70K / $65K Bear Put Spreads       Hedging Clarity Act Fading Odds
BTC Volatility Plays         $75K Calendar Straddles            Positioning for Post-Expiry Vol Expansion
ETH CME Options (Dec 2026)   $4K / $4.5K Bull Call Spreads      Monetizing Layer-1 Enterprise Momentum
ETH Butterfly Structures     Sell $3.8K / $4.0K / $4.2K Calls   Harvesting Range-Bound Option Decay
------------------------------------------------------------------------------------------------------
Drivers & Positioning Mechanics:
The Regulatory Chill (The Clarity Act): Polymarket prediction odds reflecting the legislative passage of the digital asset “Clarity Act” have declined sharply. This development has injected a regulatory discount into BTC derivatives, prompting institutional funds to unwind outright long futures and purchase CME BTC $70K/$65K bear put spreads.
The ETH ETF Flow Divergence: While headline net flows appear balanced ($445M for ETH vs. $467M for BTC), institutional allocators are allocating more capital to Ethereum on a market-cap-adjusted basis. In response, derivatives desks have constructed CME ETH $4K/$4.5K bull call spreads.
The BTC/ETH Basis Trade: The basis differential between CME Bitcoin and Ethereum futures has stretched to -5.0%, an extreme statistical dislocation. Desks are actively trading this convergence via: Long Dec 2026 BTC Futures / Short Dec 2026 ETH Futures.
$16.6B Q3 Expiry Volatility Dynamics: With $16.6 billion in notional options open interest expiring at the end of the third quarter, dealers are managing heavy gamma imbalances. Institutional books are rolling front-month positions into December 2026 $75,000 BTC straddles, concurrently scaling down their overall gross options exposure by 50% under the VIX/crypto cross-volatility governance framework (Rule 4.6).
7. Agriculture, Softs & Emerging Environmental Derivatives
Agricultural commodities are pricing in renewed supply-chain fragmentation driven by Eastern European geopolitical friction and agricultural technology capital reallocations.
       [RUSSIA - POLAND TENSIONS: Black Sea Chokepoint Risk]
                                │
                                ▼
       ┌─────────────────────────────────────────────────┐
       │   WHEAT / CORN INTER-COMMODITY SPREAD           │
       │   Long Wheat (ZWZ6)  vs.  Short Corn (ZCZ6)     │
       │   (Wheat at $6.20/bu)     (Corn at $4.80/bu)    │
       └─────────────────────────────────────────────────┘
                                │
       ┌────────────────────────┴────────────────────────┐
       ▼                                                 ▼
┌──────────────────────────────┐  ┌──────────────────────────────┐
│  SOYBEAN CRUSH MARGIN TRADE  │  │    WEATHER-DRIVEN SOFTS      │
│  Long Soybeans (ZSZ6 $13.50) │  │  Long Coffee (KCZ6) Brazil   │
│  vs. Short Corn (ZCZ6)       │  │  Short Sugar (SBZ6) Supply   │
└──────────────────────────────┘  └──────────────────────────────┘
Agricultural Futures Architecture
The Wheat/Corn Spread Dislocation: Heightened military tensions along the Russia-Poland corridor have reignited concerns over Black Sea maritime export corridors. Wheat futures (ZWZ6 at $6.20/bushel) are commanding an expanding war premium over Corn futures (ZCZ6 at $4.80/bushel). Institutional desks are positioned via Long Wheat (ZWZ6) / Short Corn (ZCZ6) spread trades.
Soybean Crush Spreads: Despite macro head量 headwinds from the strong dollar, strong domestic soybean meal demand has prompted institutional accounts to execute crush spreads: Long Soybeans (ZSZ6 at $13.50/bu via $14/$15 call spreads) / Short Corn (ZCZ6).
Soft Commodities Dispersion: Severe drought conditions in Brazil have driven institutional accumulation of Coffee futures (KCZ6), whereas global supply surpluses have driven short positioning across Sugar futures (SBZ6).
AI in Agriculture: The Gates Foundation’s $1 billion deployment into agricultural artificial intelligence has fostered long-term productivity optimism, but current futures curves are trading strictly on near-term fertilizer availability and weather disruptions.
Emerging Derivatives: Wind Power Futures
A major institutional development in alternative risk transfer is the scaling of Wind Power Futures, financially settled against Vaisala wind production indices. Driven by regulatory mandates (U.S. Inflation Reduction Act, EU Green Deal), energy desks and renewable yieldcos are actively managing weather-generation volatility:
Seasonal Generation Spreads: Desks are executing calendar arbitrage: Long Winter Wind Futures / Short Summer Wind Futures, hedging against seasonal output drops in Northern Europe.
Wind Power Collar Architectures: Wind farm operators are purchasing out-of-the-money put options to establish a floor under production revenues, financed by selling upside call options to grid utility off-takers.
8. Equity Index Derivatives: Valuation Exhaustion & The AI Capex Slowdown
Equity index futures are caught between two structural headwinds: a 5% risk-free rate and an overstretched valuation regime. The Buffett Indicator (Total Market Cap divided by U.S. GDP) has expanded to 244%, exceeding the 1999–2000 dot-com peak.
Concurrently, research warnings from AllianceBernstein, OpenAI, Anthropic, and Elon Musk regarding an AI infrastructure capex slowdown have pressured high-multiple semiconductor and hyperscaler equities, accelerating institutional hedging across index options.
------------------------------------------------------------------------------------------------------
INDEX / CONTRACT             LEVEL / SETTLEMENT                  INSTITUTIONAL STRATEGY & SKEW
------------------------------------------------------------------------------------------------------
E-Mini S&P 500 (ESZ6)        Rollover Gap to 7,698; Support 7,586 Put Spreads (7,500/7,400); Call Flies
Nasdaq-100 (NQZ6)            Underperforming Tech Concentration  Heavy 18,000 Put Buying; 1x2 Ratio Spreads
Dow Jones Industrial (YMZ6)  38,000 Support Level                Range-Bound Call Flies (38k/38.5k/39k)
Russell 2000 (RTYZ6)         Severe Underperformance             Outright Short Futures (Rate Vulnerability)
Euro Stoxx 50 (FESXZ6)       Breakdown on Growth Concerns        Short Positioning vs. Long FTSE 100 (Z6)
Nikkei 225 (N225Z6)          FX Pressure & BoJ Hike Threats      Short Futures / Downside Risk Reversals
------------------------------------------------------------------------------------------------------
           [BUFFETT INDICATOR: 244% DOT-COM HIGH]
                             │
            ┌────────────────┴────────────────┐
            ▼                                 ▼
   ┌───────────────────┐             ┌───────────────────┐
   │  E-MINI S&P 500   │             │    NASDAQ-100     │
   │  (ESZ6 Rollover)  │             │      (NQZ6)       │
   └────────┬──────────┘             └────────┬──────────┘
            │                                 │
     Failed Breakdowns                 Tech Capex Decel
     at 7,586 / 7,595                  OpenAI/Anthropic/Musk
            │                                 │
            ▼                                 ▼
   Institutions Deploy               Institutions Buy
   7,500/7,400 Put Spreads           18,000 Puts & 1x2 Ratio Calls
Systematic Index Positioning:
The ES Rollover Gap Mechanics (Rule 13.11): The September-to-December rollover in E-Mini S&P 500 futures witnessed a gap up to 7,698, driven by cost-of-carry adjustments and dividend assumptions. Despite this technical gap, underlying market internals are mixed. Failed breakdowns at 7,586 and 7,595 triggered institutional accumulation, but rallies are being sold by macro accounts using December 7,500/7,400 put spreads to hedge downside risks.
Nasdaq-100 (NQ) Asymmetric Hedges: Desks are hedging tech exposure via 1x2 ratio call spreads (buying 1x 18,500 call, selling 2x 19,000 calls) and purchasing outright December 18,000 puts to insulate portfolios against semiconductor pullbacks (e.g., Lam Research, Applied Materials).
Small-Cap Vulnerability (Russell 2000 RTY): High interest rates are impacting small-cap balance sheets, leading institutional desks to short RTYZ6 futures against long ESZ6 positions, betting on high-quality mega-cap balance sheets over debt-laden small caps.
9. The Quantitative Risk Matrix: Cross-Asset Correlations & Microstructure
In an interconnected macroeconomic environment, cross-asset correlations frequently experience breakdown, leading to compounding portfolio drawdowns. Institutional risk managers are enforcing strict allocation filters based on mathematical correlation thresholds (Rule 14.6: Reject Asset Pairs Displaying Absolute Correlation >0.70 unless structured as deliberate hedges).
======================================================================================================
CROSS-ASSET PAIR       CORRELATION COEFFICIENT    STRUCTURAL RISK / INSTITUTIONAL ACTION
======================================================================================================
WTI Oil (CL) vs. DXY   -0.70 to -0.75             Rule Breach: Avoid Unhedged Longs. Pair via GC.
UST 10Y (TY) vs. ES    -0.80 to -0.85             High Correlation: Short TY Offsets Long Equity.
SOFR (SR3) vs. DXY     -0.80                      Strong Correlation: Direct Linkage via Fed Rates.
Gold (GC) vs. DXY      -0.80                      Classic Friction: Gold Used as Anti-Dollar Hedge.
Gold (GC) vs. BTC      +0.70                      Co-Movement: Both Function as Fiat Debasement Hedges.
Brent (BZ) vs. 10Y Yld +0.60 to +0.75             Inflation Pipeline: Higher Oil Feeds Duration Selloff.
ES vs. NQ              +0.85                      High Beta Concentration: Long ES / Short NQ Arbitrage.
ZN (10Y) vs. DXY       +0.78                      Direct Rate Driver: Yield Surges Drive Dollar Flows.
======================================================================================================
               [CROSS-ASSET CORRELATION LINKAGE CLUSTERS]

       ┌────────────────────────┐         ┌────────────────────────┐
       │   Crude Oil (CLZ6)     │◄───────►│    U.S. Dollar (DXY)   │
       └───────────┬────────────┘ (-0.75) └───────────┬────────────┘
                   │                                  │
           (+0.70) │                                  │ (-0.80)
                   ▼                                  ▼
       ┌────────────────────────┐         ┌────────────────────────┐
       │   UST 10Y Yield (TY)   │◄───────►│    Gold COMEX (GCZ6)   │
       └───────────┬────────────┘ (-0.70) └───────────┬────────────┘
                   │                                  │
           (-0.85) │                                  │ (+0.70)
                   ▼                                  ▼
       ┌────────────────────────┐         ┌────────────────────────┐
       │   S&P 500 Fut (ESZ6)   │         │    Bitcoin (BTCZ6)     │
       └────────────────────────┘         └────────────────────────┘
Microstructure Dynamics & Market Convergence
Recent quantitative order flow data reveals key microstructure developments across institutional venues:
CLOB Dominance in Over-the-Counter Derivatives: Electronic execution across Central Limit Order Books (CLOB) in swap derivatives (such as interdealer OIS in Asian hubs) is delivering higher net returns for active institutional traders compared to bilateral voice OTC execution. Desks are prioritizing electronic venues to reduce slippage and transaction costs.
Options-Futures Convergence Arbitrage: Statistical arbitrage desks are exploiting pricing discrepancies between options-implied spot levels and underlying futures delivery contracts. Foreign institutional investors are capitalizing on options-futures basis mispricings, whereas domestic retail flows remain focused on options-spot discrepancies.
Asymmetric Reaction to Short-Sale Constraints: Market microstructure analysis shows that due to lingering institutional short-sale constraints in specific cash equities, derivative participants react more aggressively to spot undervaluation signals than overvaluation signals. This asymmetry produces rapid synthetic call buying upon the resolution of downside news events.
Treasury Liquidity Concentration: With hedge funds holding roughly 7% of total marketable U.S. Treasuries, the unwinding of leveraged basis trades threatens periodic liquidity crunches. Institutional desks are actively mitigating this risk by clearing rate exposure through cleared SOFR futures.
10. The Institutional Master Strategy Playbook
Synthesizing macroeconomic catalysts, options volatility surfaces, and cross-asset correlation parameters yields a comprehensive institutional derivatives strategy playbook for the current regime:
==================================================================================================================================
SECTOR / THEME         TRADE CONSTRUCT / ASSET CODES       TACTICAL EXECUTION ARCHITECTURE                HORIZON / TARGET
==================================================================================================================================
Fixed Income / Rates   SOFR Dec 2026 Outright Short        Sell SR3Z6 at 94.75; Target 94.25 (5.75% Yld)  FOMC Dec 2026
                       CME: SR3Z6                          Options: Ratio Call Spreads (1x2 95.00/95.50)  Stop: 95.10

Fixed Income / Rates   Curve Steepener (Bear Steepener)   Short 2Y (TU/ZT) vs. Long 10Y (TY/ZN) Futures  Mid-2027 Macro
                       CME: ZTZ6 / ZNZ6                    Target Spread Widening: +40 bps                Inversion Normalization

Energy / Oil           WTI Dec 2026 Bull Call Spread       Buy CLZ6 $100 Calls / Sell CLZ6 $110 Calls     Q4 2026 Target
                       NYMEX: CLZ6                         Financed by Selling CLZ6 $90 Puts; Target $110 Target $110/bbl

Energy / Natural Gas   JKM vs. TTF Inter-Market Spread     Long JKM Dec 2026 vs. Short TTF Dec 2026       Winter Heating Strip
                       ICE: JKM / TTF                      JKM $15/$18 Call Spreads; TTF €30/€25 Put Sprd Asian Premium Play

Currencies / FX        King Dollar Carry Trade             Long DXY (DXZ6) vs. Short EUR/USD (6EZ6)       Year-End 2026
                       CME: DXZ6 / 6EZ6                    Options: Long 6E 1.05 Puts / Short 1.00 Puts   Target Parity (1.000)

Currencies / FX        BoJ Intervention Hedge              Long USD/JPY (6JZ6) 150/155 Call Spreads       Tactical Event
                       CME: 6JZ6                           Pair with Outright 6J 150 Puts                 BoJ Intervention Risk

Precious Metals        Gold/Silver Ratio Arbitrage         Long Gold (GCZ6) / Short Silver (SIZ6)         Multi-Month
                       COMEX: GCZ6 / SIZ6                  Execution: Synthetically Rebalance at 85:1     Target Ratio: 90:1

Industrial Metals      AI Infrastructure Slowdown Hedge    Short Copper (HGZ6) Outright or Bear Spreads   Q4 2026 Capex Cycle
                       COMEX: HGZ6                         Buy HGZ6 $4.00 Puts / Sell HGZ6 $3.80 Puts     Target: $3.80/lb

Digital Assets         BTC Regulatory / Expiry Hedge       Long BTCZ6 $70K Puts / Short BTCZ6 $65K Puts   Q4 2026 Options Expiry
                       CME: BTCZ6                          Pair with Long Dec $75K Straddles              Clarity Act Discount

Digital Assets         BTC/ETH Basis Arbitrage             Long Dec 2026 BTC Futures / Short Dec ETH Fut  Mean-Reversion
                       CME: BTCZ6 / ETHZ6                  Exploit -5.00% Dislocation; Target Reversion   Basis Reversion to 0%

Agriculture            Black Sea Export Risk Spread        Long Wheat (ZWZ6) vs. Short Corn (ZCZ6)        Winter Strip
                       CBOT: ZWZ6 / ZCZ6                   Options: Buy ZWZ6 $6.50/$7.00 Call Spreads     Export Chokepoints

Macro Equities         Valuation & Capex Overhaul Hedge    Long VIX Dec 2026 (VXZ6) $25/$30 Call Spreads  Q4 2026 Tail Hedge
                       CBOE: VXZ6 / CME: NQZ6              NQZ6 18,000 Puts; ESZ6 7,500/7,400 Put Spreads Target VIX Spike >30
==================================================================================================================================
11. Strategic Conclusions & Forward Guidance
The overarching thesis for the fourth quarter of 2026 is that higher-for-longer interest rates have shifted from a hawkish talking point to an active balance-sheet constraint. A 10-Year U.S. Treasury yield above 5.04% alters corporate discount rates, raises debt-refinancing hurdles, and puts pressure on historically stretched equity valuations (Buffett Indicator at 244%).
At the same time, physical commodity backwardation across crude oil, middle distillates, and Asian LNG signals that supply-side inflation remains persistent. Central banks, constrained by high oil and tariff pressures, are unable to implement aggressive liquidity easing without risking further currency debasement and inflation expectations.
Tactical Desk Priorities:
Prioritize SOFR for Monetary Hedges: Cease using cash Treasury bond futures as primary Fed proxies. Trade short-end rate trajectory via CME 3-Month SOFR futures (SR3) and OIS basis instruments to avoid duration and issuance noise.
Capitalize on Physical Energy Bottlenecks: Build long energy exposure via synthetic call spreads in front-month Brent and WTI, while capturing cross-regional LNG spreads via Long JKM / Short TTF structures.
Respect Volatility Position Sizing Rules: Strictly enforce Rule 4.6. With the VIX oscillating above 22 and the front-month VIX term structure inverted, institutional portfolios should cut gross directional options exposure by 25% to 50%, favoring defined-risk structures (collars, vertical spreads, and butterflies) over open-ended short premium strategies.
Hedge Equity Overvaluation: Exploit technical rollover gaps in the E-Mini S&P 500 (ESZ6) and Nasdaq-100 (NQZ6) by accumulating out-of-the-money put protection, focusing on high-beta tech vulnerabilities and AI capital expenditure deceleration.
Institutional portfolios navigating this macro window should prioritize structural liquidity, cross-asset correlation limits, and systematic downside hedging. Flexibility and strict risk management will be essential as the market faces the dual crosswinds of a 5% sovereign yield regime and tight physical commodity markets.