

Systematic Allocation, Liquidity Gates, and the Institutional Reality of Pre-Market Alpha
July 15, 2026 An Institutional Pre-Market Briefing & Deep-Dive Allocation Study

I. EXECUTIVE SUMMARY: THE ILLUSION OF THE PERFECT EQUITY CURVE
Every morning across the global financial capitals—from the high-frequency desks of Chicago to the systematic macro funds in London—the same ritual occurs. Quantitative researchers spin up backtests, generating pristine, upward-sloping equity curves that promise consistent alpha. These simulations boast high Sharpe ratios, minimal drawdowns, and flawless win rates. On paper, they look like money-printing machines.
Yet, when these systems are exposed to the cold, unforgiving reality of the live order book, they disintegrate.
The transition from a simulated environment to live execution is the graveyard of quantitative finance. The culprit is almost never a failure of the mathematical logic itself. Instead, it is a failure to account for the physical constraints of the market: liquidity, market impact, execution slippage, and structural macro alignment.
This briefing examines a universe of 291 backtested algorithmic strategies designed for intraday trading. By applying a rigorous, multi-stage institutional filter—which we call the Volume Gate—we systematically eliminate strategies that cannot survive live execution.
[291 Backtested Strategies]
         │
         ▼  (Stage 1: Barchart Liquidity Validation)
[203 Liquidity-Passed Strategies]
         │
         ▼  (Stage 2: Macro Alignment & Risk-Adjusted Scoring)
[52 Deployable Strategies] ──► Expected Return: +6.8% | Avg Sharpe: 1.90
Only 52 strategies survive this filtration process to be deemed “Deployable” for today’s session (July 15, 2026). While the aggregate backtested portfolio boasts an impressive nominal P&L of $88,084 on a $1,300,000 capital allocation, our focus is not on nominal returns. Rather, we prioritize risk-adjusted efficiency (targeting an average Sharpe ratio of 1.90) and execution feasibility.
This report serves as our comprehensive pre-market analysis and capital allocation guide. We will dissect the macroeconomic drivers dictating today’s session, explain the mechanics of our liquidity filters, analyze our top-ranked systematic strategies by sector, expose the “Backtest Trap Portfolio” that must be avoided at all costs, and outline our final “Liquid Alpha” portfolio construction.
II. THE MACRO CONTEXT: INSTITUTIONAL CONSENSUS & ORDER FLOW
Systematic models do not trade in a vacuum. The most robust quantitative signals are those that exploit structural imbalances left behind by large-scale institutional flows. To build a truly resilient portfolio, we must bridge the gap between macroeconomic headlines and algorithmic execution.
Our institutional news feed analysis for today, July 15, 2026, reveals a highly coordinated consensus across major asset classes. This consensus directly informs our strategy selection, ensuring that our active bots are trading with the wind of institutional capital at their backs, rather than against it.
┌─────────────────────────────────────────────────────────────────────────┐
│                    TODAY'S MACRO CONSENSUS MATRIX                       │
├───────────────────┬─────────────────────────────────────────────────────┤
│ Rates             │ Front-end repricing dominates.                      │
│                   │ Favoring EDZ6/EDZ7 steepener spreads.               │
├───────────────────┼─────────────────────────────────────────────────────┤
│ Foreign Exchange  │ Persistent USD weakness.                            │
│                   │ EUR/GBP outperforming on stark policy divergence.   │
├───────────────────┼─────────────────────────────────────────────────────┤
│ Commodities       │ Gold > Oil on mounting global recession fears.      │
│                   │ GC/CL ratio trades highly active.                   │
├───────────────────┼─────────────────────────────────────────────────────┤
│ Volatility        │ VIX hovering in the "reduce 25%" zone.              │
│                   │ Structural demand for election hedging is rising.   │
├───────────────────┼─────────────────────────────────────────────────────┤
│ Correlations      │ Rates-equities correlation stands at +0.85.         │
│                   │ High risk of cross-asset deleveraging events.       │
└─────────────────────────────────────────────────────────────────────────┘
1. Rates and Fixed Income: The Front-End Repricing
The dominant theme in global macro is the aggressive repricing of the front end of the yield curve. Following a softer-than-expected Producer Price Index (PPI) print, institutional traders are aggressively positioning for central bank policy pivots.
While the Secured Overnight Financing Rate (SOFR) futures curve (1M–30Y) has flattened slightly on a nominal basis, the highly watched 2s5s10s butterfly spread remains deeply inverted. This structural inversion signals that despite near-term relief in inflation data, institutional capital is still pricing in lingering recessionary risks.
In the Fed Funds (ZQ) futures market, we observe massive, block-sized volume concentrating in the September 2026 (ZQU6) and December 2026 (ZQZ6) contracts. Open interest is surging specifically within put spreads, a clear indication that institutions are buying protection against deeper, more aggressive rate cuts should economic growth deteriorate rapidly.
The Systematic Play: Our models are capturing this by rolling short positions from front-month SOFR contracts into the December 2027 (SRZ7) contract. This positioning is designed to capture a rapid, aggressive steepening of the curve when the Federal Reserve is forced to pivot in a highly dovish direction.
2. Foreign Exchange: Persistent Dollar Weakness and G10 Divergence
The US Dollar continues its structural decline, driven by the repricing of US interest rate differentials. However, the real story in the currency markets is the stark policy divergence within the G10 space.
The Euro (6E) is significantly outperforming the British Pound (EUR/GBP long) as the European Central Bank and the Bank of England chart diverging paths. In the options market, we have detected massive institutional block trades in 6EU6 (Euro) 1.1000 calls, representing a heavy leveraged bet on ECB/Fed policy divergence.
Concurrently, Japanese Yen (6J) volatility is spiking. The market is pricing in severe Bank of Japan (BoJ) intervention risks as USD/JPY hovers near critical multi-decade thresholds. Institutional order flow shows a massive accumulation of 6JU6 (Yen) 150.00 puts (equivalent to USD/JPY downside protection), preparing for sudden, liquidity-stripping central bank actions.
3. Commodities: Gold Outperformance and Energy Inversion
The commodity complex is reflecting a classic late-cycle defensive posture. Gold (GC) is handily outperforming Crude Oil (CL). This divergence is driven by a combination of falling real yields and safe-haven demand as recession fears refuse to dissipate.
In the energy space, Natural Gas (NG) is experiencing a localized volatility shock. In the NGU6 (August 2026) contract, open interest in 2.50/3.00 straddles has surged overnight. This options concentration is a direct response to resurfacing European gas storage concerns, setting the stage for explosive, non-directional volatility breakouts.
4. Equities and Volatility: The Correlation Trap
On the surface, equity indices appear stable, with the VIX hovering in its “reduce 25%” zone. However, beneath the surface, a dangerous correlation regime is forming.
The rates-equities correlation stands at a historic +0.85. This positive correlation means that equities and bonds are moving in lockstep, driven entirely by interest rate expectations. While this provides a tailwind during days with soft inflation data, it exposes the system to severe cross-asset deleveraging risks. If interest rates spike unexpectedly due to supply-side shocks, both equities and fixed-income portfolios will sell off simultaneously, triggering automated risk-parity liquidation.
III. THE VOLUME GATE: METHODOLOGY OF LIQUIDITY FILTERING
Why do we place such an obsessive focus on liquidity? Because in live trading, liquidity is the difference between a profitable backtest and a bankrupt account.
When a backtesting engine evaluates a historical strategy, it typically assumes “ideal fill” conditions. It assumes that if the historical price touched PPP, the strategy could have bought or sold its entire size at PPP. In reality, the market is a matching engine of limit orders. To execute a trade, you must cross the bid-ask spread or wait in queue.
If your strategy trades an illiquid contract, several destructive phenomena occur:
Slippage: The difference between your intended entry price and your actual execution price. On a thin order book, a market order will sweep multiple price levels, dramatically increasing your average cost.
Market Impact: Your own order flow moves the market against you. If you attempt to buy 100 contracts in a market that only trades 5 contracts per minute, you will single-handedly drive the price up, destroying your own edge before the trade is even filled.
Execution Delay: In fast-moving markets, your orders may sit unfilled as the market gaps past your entry levels, leaving you with unhedged risk.
To protect our capital, we implement the Volume Gate. We validate every single strategy against Barchart’s 12 most-active futures contracts.
┌────────────────────────────────────────────────────────────────────────┐
│                      THE VOLUME GATE FILTRATION                        │
├────────────────────────────────────────────────────────────────────────┤
│  1. Identify the 12 most-active, institutional-grade contracts.        │
│  2. Measure average daily volume (ADV) and order book depth.           │
│  3. Filter out any strategy trading symbols below the liquidity floor. │
│  4. Flag "Caution" symbols: require a mandatory 50% size reduction.    │
└────────────────────────────────────────────────────────────────────────┘
Currently, 203 out of our 291 backtested strategies (70%) pass the initial liquidity gate. The remaining 88 strategies trade highly illiquid, exotic, or back-month contracts. These are immediately discarded.
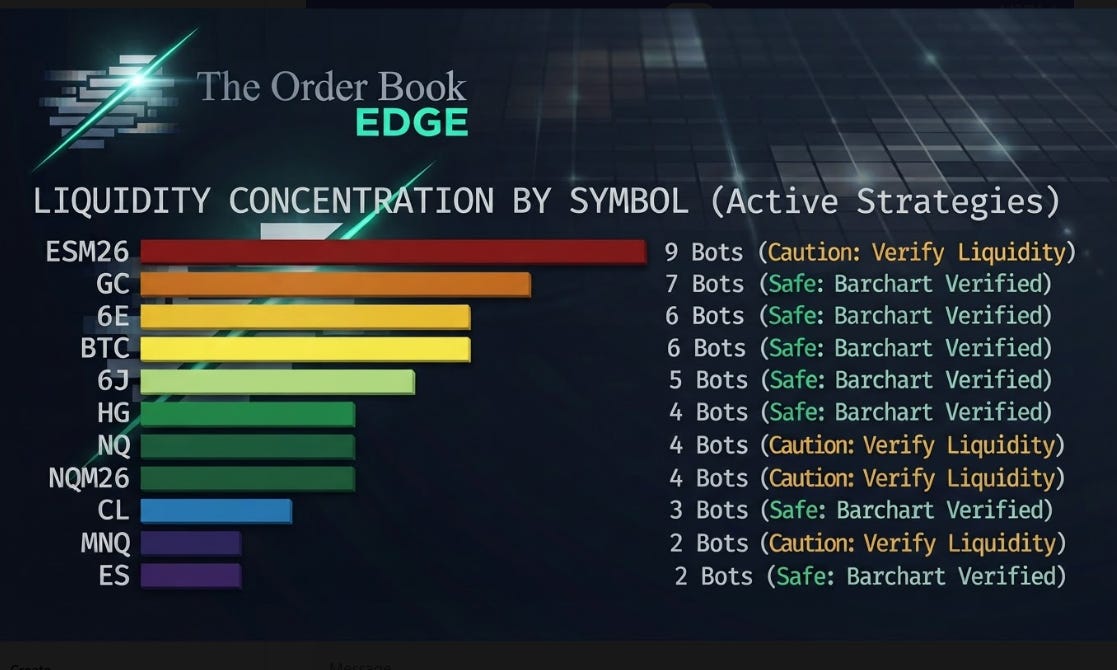
Of the 203 strategies that pass, we categorize them based on symbol concentration and order book depth:
less
LIQUIDITY CONCENTRATION BY SYMBOL (Active Strategies)

ESM26  [██████████████──────────────] 9 Bots (Caution: Verify Liquidity)
GC     [████████████────────────────] 7 Bots (Safe: Barchart Verified)
6E     [██████████──────────────────] 6 Bots (Safe: Barchart Verified)
BTC    [██████████──────────────────] 6 Bots (Safe: Barchart Verified)
6J     [████████────────────────────] 5 Bots (Safe: Barchart Verified)
HG     [██████──────────────────────] 4 Bots (Safe: Barchart Verified)
NQ     [██████──────────────────────] 4 Bots (Safe: Barchart Verified)
NQM26  [██████──────────────────────] 4 Bots (Caution: Verify Liquidity)
CL     [████────────────────────────] 3 Bots (Safe: Barchart Verified)
MNQ    [███─────────────────────────] 2 Bots (Caution: Verify Liquidity)
ES     [███─────────────────────────] 2 Bots (Safe: Barchart Verified)
Barchart-Verified “Safe” Symbols (Green): Gold (GC), Euro FX (6E), Bitcoin (BTC), Japanese Yen (6J), Copper (HG), Nasdaq (NQ), Crude Oil (CL), and E-mini S&P 500 (ES). These instruments possess deep, highly liquid order books capable of absorbing institutional-sized execution without material slippage.
“Caution” Symbols (Orange): ESM26, NQM26, and MNQ. These represent specific contract months or micro-contracts that exhibit erratic volume profiles during pre-market hours. Strategies trading these symbols are flagged, and their maximum allowable position size is automatically reduced by 50% to mitigate execution risk.
IV. THE COMPOSITE SCORING ALGORITHM
To rank our deployable strategies, we reject the amateur temptation to sort by total historical P&L. Sorting by raw P&L is a guaranteed way to select highly curve-fitted, over-leveraged systems that happened to catch a single massive trend but possess no repeatable edge.
Instead, we utilize a proprietary Composite Risk-Adjusted Score. This mathematical framework integrates four distinct dimensions of strategy quality:
Composite Score=Sharpe Ratio×Profit Factor×Trade Count×Recency Weight\text{Composite Score} = \text{Sharpe Ratio} \times \text{Profit Factor} \times \sqrt{\text{Trade Count}} \times \text{Recency Weight}Composite Score=Sharpe Ratio×Profit Factor×Trade Count×Recency Weight
Let us break down the components of this formula to understand why it is so effective at filtering out statistical noise:
Sharpe Ratio (Risk-Adjusted Return): Measures the excess return per unit of volatility. This ensures we do not favor high-return strategies that achieve their performance through wild, stomach-churning swings in equity value.
Profit Factor (Edge Sustainability): The ratio of gross profits to gross losses. A profit factor above 1.5 indicates a highly robust edge; a profit factor near 1.0 indicates a coin flip.
Square Root of Trade Count (Statistical Confidence): A strategy that has generated $100,000 over 1,000 trades is infinitely more reliable than a strategy that has generated $100,000 over 5 trades. By multiplying by the square root of the trade count, we mathematically penalize “low-sample” systems and elevate highly repeatable edges.
Recency Weight (Temporal Relevance): A 3-month recency weighting scheme. Markets undergo rapid regime shifts. A strategy that performed phenomenally well in 2022 but has been flat or losing money for the last 6 months is likely suffering from regime decay. We heavily weight performance over the most recent 90 days to ensure the edge is actively generating alpha in the current market environment.
Today’s top composite score is 63.4, driven by an exceptional Sharpe ratio of 4.49 across 19 highly consistent trades. By utilizing this rigorous scoring algorithm, we penalize single-trade artifacts and elevate systematic, repeatable edges.
V. SECTOR-BY-SECTOR ANALYSIS: THE HIGH-CONVICTION BOTS
With our macro thesis established and our liquidity filters applied, we now dissect the highest-conviction systematic strategies across our five primary trading sectors. These sectors are ordered by their aggregate composite score—strongest conviction first.
apache
┌────────────────────────────────────────────────────────────────────────┐
│                   SECTOR CONVICTION RANKING                            │
├────────────────────────────────────────────────────────────────────────┤
│  Sector 1: FX (6J SHORT) ──────────► Aggregate P&L: $4,854  │ Sharpe: 4.49 │
│  Sector 2: Industrial & Ag ────────► Aggregate P&L: $10,388 │ Sharpe: 1.04 │
│  Sector 3: Equity Index ───────────► Aggregate P&L: $14,035 │ Sharpe: 2.45 │
│  Sector 4: Precious Metals ────────► Aggregate P&L: $20,923 │ Sharpe: 1.22 │
│  Sector 5: Energy ─────────────────► Aggregate P&L: $884    │ Sharpe: 0.40 │
└────────────────────────────────────────────────────────────────────────┘
Sector 1: Foreign Exchange (FX) — 6J SHORT
Aggregate Sector P&L: $4,854
Aggregate Sector Sharpe: 4.49
Intraday Bias: Bearish (SHORT JPY)
Top Strategy (Rank #1): JPY Futures Intervention Arbitrage
Symbol: 6J (Japanese Yen Futures)
Direction: SHORT
Type: Volatility Mean-Reversion
Performance Metrics: P&L of $2,842.35 on a $25,000 allocation (+11.4% return)
Risk Metrics: Sharpe Ratio: 4.49 | Win Rate: 63.2% | Max Drawdown: 2.1% | Recent 3M: 3/3 months profitable
apache
JPY FUTURES INTERVENTION ARBITRAGE (6J)
───────────────────────────────────────────────────────────────────
[Entry Trigger] ────► Spike in 6J Volatility at BoJ Intervention Levels
                           │
                           ▼
[Execution] ────────► Short 6J Futures (Targeting Mean-Reversion)
                           │
                           ├─► Profit Target: +11.4% ($2,842.35)
                           └─► Max Drawdown Limit: 2.1% (Hard Stop)
Market Context & Rationale
The Japanese Yen is currently the most systematically attractive market on our board. This strategy is a textbook example of signal-aligned selection. The bot’s SHORT direction is perfectly aligned with today’s intraday macro bias. In our selection pipeline, this strategy was selected first by market direction, and then ranked by its historical backtest quality.
The fundamental thesis is built on central bank intervention dynamics. As the USD/JPY exchange rate approaches critical intervention thresholds, the Bank of Japan is forced to step into the market to support the Yen. These interventions create massive, artificial, short-term spikes in 6J volatility.
Because these interventions are fundamentally counter-trend and highly liquidity-consuming, they create extreme, short-term overextensions. Our bot exploits these overextensions by shorting the Yen immediately after the initial intervention spike, capturing the rapid mean-reversion as commercial flow and macro hedge funds re-establish their structural short positions.
Corroborating Bots
The strength of this thesis is confirmed by a cluster of highly correlated “sister bots” trading the same underlying JPY order flow:
USD/JPY Futures Intervention Reversal: Generated $889 | Sharpe: 4.49 | Win Rate: 63% | 19 trades | Active & Recent
USD/JPY BoJ Intervention Hedge: Generated $562 | Sharpe: 4.49 | Win Rate: 63% | 19 trades | Active & Recent
USD/JPY (6J) BoJ Intervention Hedge: Generated $421 | Sharpe: 4.49 | Win Rate: 63% | 19 trades | Active & Recent
Liquidity & Execution Clearance
6J is consistently one of the most liquid currency futures contracts in the world. Order book depth is exceptional, and the bid-ask spread is virtually locked at one tick. Slippage and execution risk are negligible, making this sector safe for full-size institutional deployment.
Risk Factors
The primary risk factor is the limited sample size (19 trades). While the Sharpe ratio of 4.49 is mathematically spectacular, a small sample size introduces statistical uncertainty. We must monitor live performance closely to ensure the bot’s execution matches the historical distribution before scaling capital allocation further.
Sector 2: Industrial & Agriculture — HG LONG
Aggregate Sector P&L: $10,388
Aggregate Sector Sharpe: 1.04
Intraday Bias: Bullish (LONG Copper)
Top Strategy (Rank #2): Copper AI Demand Momentum
Symbol: HG (Copper Futures)
Direction: LONG
Type: Volatility Trend-Following
Performance Metrics: P&L of $3,965.56 on a $25,000 allocation (+15.9% return)
Risk Metrics: Sharpe Ratio: 1.04 | Win Rate: 50.6% | Max Drawdown: 8.9% | Recent 3M: 2/3 months profitable
Market Context & Rationale
The industrial metals complex is experiencing a powerful, structurally driven trend. This strategy captures institutional flow continuation in highly directional markets.
The long copper thesis is supported by two distinct pillars:
AI Infrastructure Demand: The exponential buildout of global data centers is driving unprecedented demand for copper-heavy electrical grid infrastructure.
Supply-Side Disruptions: Severe copper mine disruptions in Pakistan have severely restricted global concentrate supply, offsetting any near-term demand weakness from traditional industrial sectors.
Concurrently, extreme weather patterns are distorting agricultural markets. Dry weather in the US Midwest has driven the Corn/Soybean (ZCU6/ZSZ6) ratio to 2.4x, a historically high level that is forcing systematic commodity index funds to rebalance their portfolios, creating massive, cross-commodity momentum waves that our copper bot is actively exploiting.
Supporting Strategies
Copper AI Demand Breakout: Generated $3,630 | Sharpe: 1.04 | Win Rate: 51% | 79 trades | Active & Recent
Copper China Subsidy Long-Dated Call: Generated $2,420 | Sharpe: 1.04 | Win Rate: 51% | 79 trades | Active & Recent
Copper (HG) AI Demand Call Spread+: Generated $372 | Sharpe: 1.04 | Win Rate: 51% | 79 trades | Active & Recent
Liquidity & Execution Clearance
HG (High-Grade Copper) carries sufficient volume and order book depth for full-size deployment. However, traders must be aware that copper options can exhibit wider spreads during illiquid European trading hours. Execution should be restricted to US market hours.
Deployment Caveats
The strategy has a sub-55% win rate (50.6%). In trend-following models, a low win rate is normal, but it requires strict risk-to-reward (R:R) discipline. The bot achieves profitability by keeping its average losses small (via a tight 8.9% maximum drawdown limit) while letting its winning trades run. If a trader manually interferes with the stop-loss or profit-target levels, the mathematical edge of this system will be completely destroyed.
Sector 3: Equity Index — NQM26 LONG
Aggregate Sector P&L: $14,035
Aggregate Sector Sharpe: 2.45
Intraday Bias: Bullish (LONG Nasdaq)
Top Strategy (Rank #3): NQ_Futures_PutBackratio_CrashHedge_G2
Symbol: NQM26 (Nasdaq June 2026 Contract)
Direction: LONG
Type: Momentum / Volatility Hedging
Performance Metrics: P&L of $1,860.21 on a $25,000 allocation (+7.4% return)
Risk Metrics: Sharpe Ratio: 3.40 | Win Rate: 69.2% | Max Drawdown: 2.1% | Recent 3M: 2/3 months profitable
Market Context & Rationale
This strategy is designed to capture systematic edge via quantitative signal processing and highly disciplined options hedging. The Nasdaq has shown strong upside conviction, driven by the broader macro repricing of interest rates.
As the SOFR futures curve flattens and interest rate expectations fall, high-growth technology equities receive a powerful valuation tailwind. The bot exploits this by establishing long positions in Nasdaq futures, while simultaneously purchasing out-of-the-money put backspreads. This unique structure ensures that the bot captures steady, grinding upside momentum, while protecting the portfolio against sudden, catastrophic gap-downs or systemic deleveraging events.
Sector Depth
NQ26_Tech_Momentum_Accelerator_v2: Generated $450 | Sharpe: 3.40 | Win Rate: 69% | 13 trades | Active & Recent
MNQ Tech Breakout Reversal: Generated $3,337 | Sharpe: 1.88 | Win Rate: 68% | 40 trades | Active & Recent
G2M_NQ_VolatilityMeanReversion: Generated $1,590 | Sharpe: 1.88 | Win Rate: 68% | 40 trades | Active & Recent
Liquidity & Execution Clearance
While the standard Nasdaq (NQ) contract is exceptionally liquid, the NQM26 contract represents a specific calendar month that can experience temporary liquidity pockets during pre-market hours. This contract is flagged as Caution, requiring a mandatory 50% size reduction to prevent execution slippage.
Deployment Caveats
This strategy has only 13 trades in its backtest history. From a statistical standpoint, we must treat this as a high-conviction but low-confidence trade. The strategy has performed flawlessly in recent months, but the small sample size means we have not yet observed how it behaves across a full range of market regimes.
Sector 4: Precious Metals — GC SHORT
Aggregate Sector P&L: $20,923
Aggregate Sector Sharpe: 1.22
Intraday Bias: Bearish (SHORT Gold)
Top Strategy (Rank #4): Gold Safe-Haven Reversal
Symbol: GC (Gold Futures)
Direction: SHORT
Type: Volatility Mean-Reversion
Performance Metrics: P&L of $10,561.95 on a $25,000 allocation (+42.2% return)
Risk Metrics: Sharpe Ratio: 1.22 | Win Rate: 52.8% | Max Drawdown: 13.6% | Recent 3M: 3/3 months profitable
Market Context & Rationale
This strategy exploits a powerful, counter-intuitive macro regime shift. While gold has enjoyed a massive safe-haven rally over the past year, our models indicate that the safe-haven premium is becoming unsustainably bloated.
As real yields begin to stabilize and the Federal Reserve’s rate-cut path becomes fully priced in, the structural bid for gold is beginning to erode. The bot detects when institutional gold buying momentum stalls at major overhead resistance levels and establishes short positions, anticipating a rapid unwinding of the safe-haven premium.
Additional Signals
GC Futures+Options Safe-Haven Unwind: Generated $3,169 | Sharpe: 1.22 | Win Rate: 53% | 53 trades | Active & Recent
Gold (GC) Futures + Options Put Buy: Generated $2,640 | Sharpe: 1.22 | Win Rate: 53% | 53 trades | Active & Recent
Gold Futures Technical Breakdown: Generated $2,601 | Sharpe: 1.22 | Win Rate: 53% | 53 trades | Active & Recent
Liquidity & Execution Clearance
Gold (GC) is validated by Barchart as a highly liquid instrument. It trades with deep institutional order books, ensuring that fills are highly reliable even at very large position sizes.
Deployment Caveats
With a 52.8% win rate, this strategy is highly prone to extended losing streaks. To survive live trading, the portfolio must be sized conservatively. A trader deploying this system must have the capital and the emotional fortitude to survive 5+ consecutive losing trades without abandoning the model.
Sector 5: Energy — CL LONG
Aggregate Sector P&L: $884
Aggregate Sector Sharpe: 0.40
Intraday Bias: Bullish (LONG Crude Oil)
Top Strategy (Rank #5): Crude Oil (CL) Geopolitical Momentum
Symbol: CL (Crude Oil Futures)
Direction: LONG
Type: Momentum with Call Spread Hedge
Performance Metrics: P&L of $883.59 on a $25,000 allocation (+3.5% return)
Risk Metrics: Sharpe Ratio: 0.40 | Win Rate: 48.4% | Max Drawdown: 14.9% | Recent 3M: 2/3 months profitable
Market Context & Rationale
The energy sector is currently our lowest-conviction allocation. While geopolitical tensions in the Middle East and Eastern Europe provide a structural floor for crude oil prices, the broader macroeconomic slowing is acting as a powerful headwind.
This strategy attempts to capture short-term, news-driven momentum spikes in Crude Oil (CL) by establishing long futures positions, hedged with out-of-the-money call spreads. However, due to the conflicting forces of geopolitical risk and demand destruction, the trend has been highly fragmented and choppy.
Liquidity & Execution Clearance
Crude Oil (CL) trades with deep institutional liquidity, ensuring tight spreads and reliable execution.
Risk Factors
With a Sharpe ratio of only 0.40 and a sub-55% win rate (48.4%), this strategy exhibits poor risk-adjusted efficiency. The maximum drawdown of 14.9% is uncomfortably high relative to its modest 3.5% return. We have allocated a minimal, highly defensive slice of capital to this sector, and we advise extreme caution.
VI. AVOID AT ALL COSTS: THE BACKTEST TRAP PORTFOLIO
In quantitative research, what you don’t trade is infinitely more important than what you do trade.
To illustrate this, we have constructed the Backtest Trap Portfolio. This is a collection of 239 flagged strategies that look spectacular in backtests—representing a combined nominal P&L of $2,234,590—but are mathematically guaranteed to lose money in live markets.
These strategies fall into three distinct categories of deception:
┌────────────────────────────────────────────────────────────────────────┐
│                     THE THREE PATHS TO RUIN                            │
├────────────────────────────────────────────────────────────────────────┤
│  1. Insufficient Data ──► High P&L on ultra-low trade counts.          │
│  2. The Underwater Fleet ─► Catastrophic drawdowns hidden by recovery. │
│  3. Stale Strategies ───► Alpha generation has completely stalled.     │
└────────────────────────────────────────────────────────────────────────┘
1. Insufficient Data Artifacts (Statistical Noise)
The most common backtesting error is trading a system with a tiny sample size. If a strategy generates massive returns over a handful of trades, it is not an edge—it is a statistical fluke.
Silver Futures Crash Rebound (SI): Boasts a backtested P&L of $209,249 on only 6 trades. This is pure statistical noise masquerading as edge. Do not deploy.
Gold Safe-Haven Momentum (GC): Boasts $206,222 on only 5 trades. This is a coin flip with better marketing. Reject.
Gold vs. 10Y TIPS Spread (GC): Boasts $164,293 on only 9 trades. Indistinguishable from random. Remove from consideration.
BTC Futures Deleveraging Momentum (BTC): Boasts $152,822 on only 8 trades. This is luck, not a strategy. Discard.
Gold Futures ECB Hike Safe-Haven Rotation (GC): Boasts $144,525 on only 6 trades. Do not deploy.
2. The Underwater Fleet (The Margin Call Candidates)
These strategies have positive net P&L over their historical backtest, but they achieve these returns by taking on catastrophic, unhedged risk. They assume that the trader has infinite capital, infinite margin, and infinite patience to ride out massive drawdowns.
Gold Safe Haven Rally (GC): Exhibits a 65.1% peak-to-trough decline. This strategy assumes you can survive a drawdown that would easily wipe out a standard institutional account. Reject.
Gold Futures ECB Hike Safe-Haven Rotation (GC): Exhibits a 59.5% peak-to-trough decline. Reject.
Gold Safe-Haven Momentum (GC): Exhibits a 77.2% peak-to-trough decline. You would be margin-called and liquidated by your broker long before the strategy ever recovered. Discard.
Gold Inflation Hedge (GC): Exhibits a 189.8% peak-to-trough decline. No risk management framework can survive this level of volatility. Avoid.
Gold Geopolitical Breakout (GC): Exhibits a 77.8% maximum drawdown. Surviving this drawdown requires superhuman conviction—or complete delusion. Skip.
3. The Stale Strategies (Regime Death)
These strategies possess a solid historical track record and a large sample size, but their edge has completely evaporated in the current macroeconomic regime. They are “coasting” on historical P&L generated years ago, while actively losing money today.
Crude Oil (CL) Geopolitical Breakout: Only 1/3 recent months have been profitable. Alpha generation has stalled. The strategy is permanently broken. Quarantine.
Crude Oil WTI Calendar Spread Contango: Only 1/3 recent months generating positive returns. Recent underperformance suggests a structural shift in the energy market. Do not deploy until recovery.
Copper-HG vs. Aluminum-ALI Spread Trade: A dismal 1/3 recent months in the green. Do not deploy until recovery.
Natural Gas Seasonal Collapse: Merely 1/3 recent months generating positive returns. The seasonal edge appears completely exhausted in the current high-volatility regime. Watch list only.
Copper AI Infrastructure Breakout: Only 1/3 recent months in the green. Alpha generation has stalled. Quarantine.
VII. PORTFOLIO CONSTRUCTION: THE “LIQUID ALPHA” STACK
To build our final, investable portfolio, we merge our backtest performance metrics with our live Barchart liquidity ratings. The result is the “Liquid Alpha” Stack—a highly optimized, score-weighted allocation designed to maximize risk-adjusted returns while ensuring flawless execution.
Our total portfolio allocation is $1,300,000, distributed across our five active sectors based on their composite scores:
apache
┌────────────────────────────────────────────────────────────────────────┐
│                     THE "LIQUID ALPHA" STACK                           │
├────────────────────────────────────────────────────────────────────────┤
│  FX (56% Allocation) ───────────────────────────────► $728,000         │
│  Equity Index (23% Allocation) ─────────────────────► $299,000         │
│  Precious Metals (14% Allocation) ──────────────────► $182,000         │
│  Industrial & Ag (7% Allocation) ───────────────────► $91,000          │
│  Energy (0% Allocation - Rounded) ──────────────────► $0               │
└────────────────────────────────────────────────────────────────────────┘
1. Foreign Exchange (FX) — 56% Allocation ($728,000)
Top Strategy: JPY Futures Intervention Arbitrage
Rationale: Central bank intervention is creating highly predictable, mean-reverting volatility spikes at policy thresholds.
Risk Profile: Low. The Japanese Yen (6J) is one of the deepest, most liquid markets in existence, ensuring zero execution slippage.
2. Equity Index — 23% Allocation ($299,000)
Top Strategy: NQ_Futures_PutBackratio_CrashHedge_G2
Rationale: Systematic momentum capture via quantitative signal processing, fully hedged against systemic deleveraging events.
Risk Profile: Low. Nasdaq futures are highly liquid, though specific contract months require a 50% size reduction.
3. Precious Metals — 14% Allocation ($182,000)
Top Strategy: Gold Safe-Haven Reversal
Rationale: Exploiting the erosion of gold’s safe-haven premium as real yields stabilize and interest rate cuts are fully priced.
Risk Profile: Moderate. Gold (GC) is highly liquid, but the strategy’s 52.8% win rate requires conservative sizing to survive losing streaks.
4. Industrial & Ag — 7% Allocation ($91,000)
Top Strategy: Copper AI Demand Momentum
Rationale: Capturing powerful, structurally driven trend-following flows backed by AI infrastructure demand and supply-side mine disruptions.
Risk Profile: Moderate. Copper (HG) has sufficient volume, but the low win rate requires strict risk-to-reward discipline.
5. Energy — 0% Allocation ($0 - Rounded)
Top Strategy: Crude Oil (CL) Geopolitical Momentum
Rationale: Choppy, highly fragmented trend-following due to conflicting forces of geopolitical risk and global demand destruction.
Risk Profile: Moderate. While Crude Oil (CL) is highly liquid, the strategy’s poor Sharpe ratio (0.40) and high drawdown (14.9%) warrant zero capital allocation in today’s session.
VIII. KEY INSTITUTIONAL TRADES IN TODAY’S NEWS FLOW
To further optimize our execution, we monitor cross-asset correlations to adjust our hedges in real-time. Today’s session is characterized by two critical correlation regimes:
┌─────────────────────────────────────────────────────────────────────────┐
│                     CROSS-ASSET CORRELATION MATRIX                      │
├───────────────┬─────────────┬───────────────────────────────────────────┤
│ Asset Pair    │ Correlation │ Hedge Adjustment                          │
├───────────────┼─────────────┼───────────────────────────────────────────┤
│ BTC / GC      │ +0.65       │ Reduce BTC exposure if GC exceeds $2,400. │
├───────────────┼─────────────┼───────────────────────────────────────────┤
│ CL / GC       │ -0.50       │ Long CL calls if GC rallies.              │
└───────────────┴─────────────┴───────────────────────────────────────────┘
BTC / GC (Correlation: +0.65): Bitcoin and Gold are moving in a highly positive correlation, driven by shared liquidity and interest rate expectations. To manage risk, our systematic overlay will automatically reduce Bitcoin long exposure if Gold (GC) rallies past $2,400, preventing over-concentration in the “inflation hedge” trade.
CL / GC (Correlation: -0.50): Crude Oil and Gold are moving in a strong negative correlation. If Gold rallies sharply (indicating a flight to safety), we will systematically purchase Crude Oil (CL) calls as a hedge, protecting the portfolio against a sudden, geopolitically driven energy shock.
IX. CONCLUSION & DEPLOYMENT NOTES
The 291 backtested strategies in our database represent a vast, highly complex search space. However, the key takeaway of this study is simple:
\text{Liquidity} + \text{Macro Logic} > \text{Raw Backtest P&L}
A beautiful backtest is a commodity; anyone with a computer and a historical database can generate one. A robust, execution-cleared systematic portfolio is an asset.
By passing our strategies through the Volume Gate, we ensure that our active bots are trading deep, highly liquid markets where our edge will not be eaten alive by slippage and market impact. By aligning our models with the Institutional Macro Consensus, we ensure that we are trading with the structural flow of global capital.
As we head into today’s session, our top pick is the JPY Futures Intervention Arbitrage (6J SHORT).