


Data as of the November 9, 2026 close unless noted. Written November 10, 2026. Not investment advice.
NVIDIA closed Monday, November 9, 2026 at $178.67. Five weeks earlier, on October 6, it closed at $239.24, the highest close in its history. In between, the stock lost 25.3%, including a 9.3% drop on November 5, when the Philadelphia Semiconductor Index fell more than 12% in a single session. At roughly 24.1 billion shares, the equity is worth about $4.31 trillion, which means roughly $1.5 trillion of market value disappeared in about a month.
The business did not shrink while that happened. In the quarter that ended July 26, 2026, NVIDIA reported $96.2 billion of revenue, up 106% from a year earlier, at a 75.0% gross margin. It guided the October quarter to $108 billion. Its chief financial officer told analysts she expects fiscal 2028 revenue to grow about 70%, and described that outlook as limited by supply rather than demand. The result is an unusual setup: the stock is in a sharp technical downtrend at the same moment its trailing price-to-earnings ratio sits at the lowest level of the past ten years.
So which signal deserves more weight? That depends on the question you ask. Fundamental analysis asks what the business earns and what today’s price assumes about the future. Quantitative analysis asks how the stock behaves: how much it moves, what drives it, how deep its drawdowns get, and what a reasonable spread of outcomes looks like. Technical analysis asks where the trend stands and where buyers and sellers have done most of their business.
This piece uses all three. It is built only from public data: NVIDIA’s SEC filings, daily prices, Treasury yields from the St. Louis Fed’s FRED database and the Fama-French factor library. Each chart lists its source in the footer. Each quant method comes with its formula written out, and every symbol is defined, so you can rebuild the numbers yourself. Where a number is my own assumption rather than a reported fact, I say so.
Executive summary
The growth engine is still accelerating. Revenue for the trailing four quarters (Q3 fiscal 2026 through Q2 fiscal 2027) was about $303 billion, up 83% from the prior four quarters. Year-over-year growth has risen for four straight quarters, from 56% in the July 2025 quarter to 62%, 73%, 85% and then 106% in the July 2026 quarter. Data Center produced $89.0 billion of the $96.2 billion in the latest quarter, or 93% of revenue. Ten years ago it was 7%.
The economics have never been better, and they come with new obligations. Trailing gross margin is 74.7%, and trailing operating margin is 65.2%. Over the past year, every additional dollar of revenue brought in about 74 cents of operating income. Against that, supply and capacity commitments rose to $279 billion in the latest quarter, from $119 billion three months earlier. NVIDIA has also guaranteed up to $105 billion of data-center lease obligations for a campus that will host OpenAI. Receivables rose to $63.1 billion.
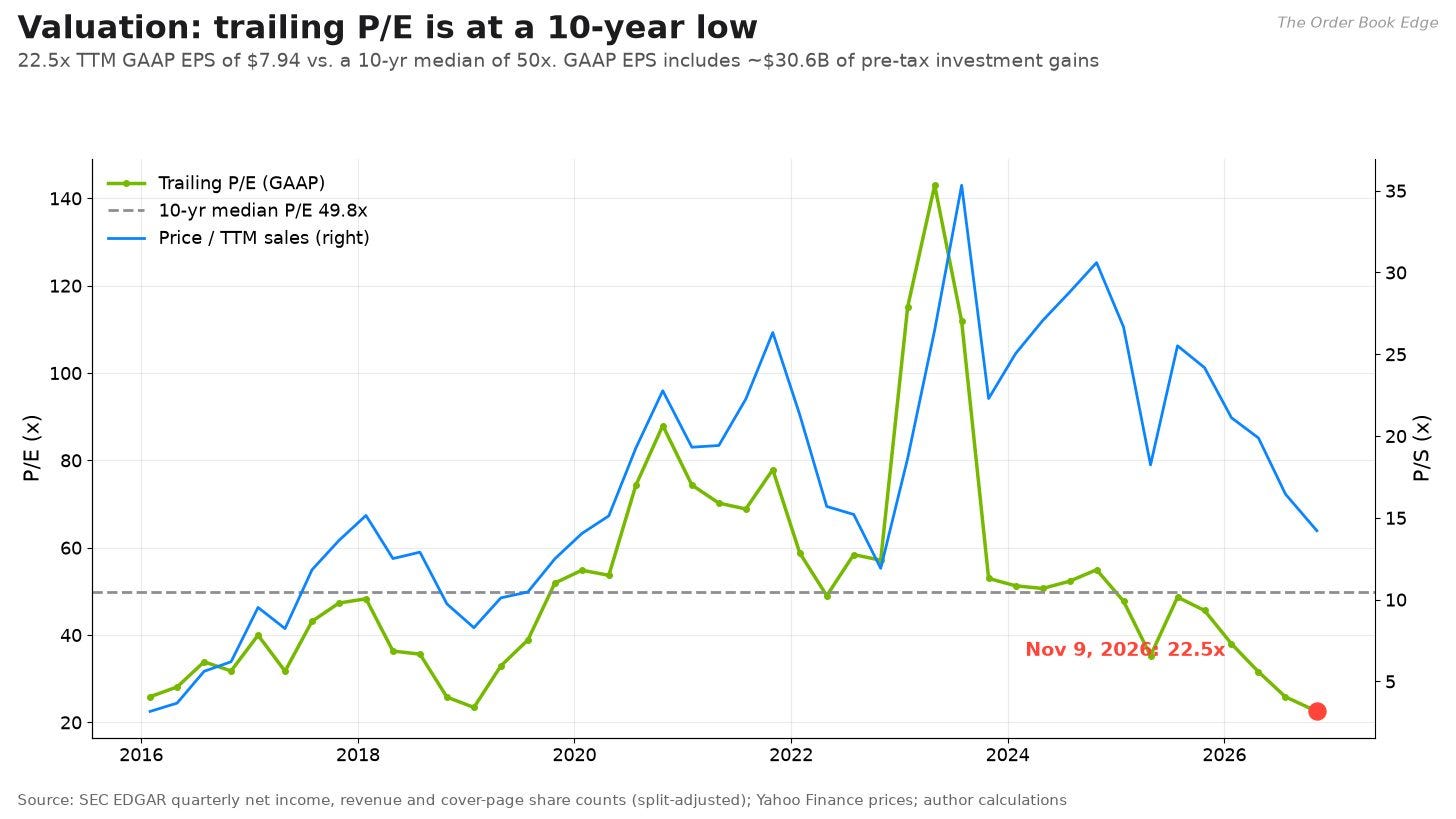
On trailing numbers, the valuation is the lowest in a decade. At $178.67, NVDA trades at 22.5 times trailing GAAP earnings per share of $7.94. The 10-year median of quarter-end readings is 49.8 times. Trailing GAAP earnings are inflated by about $30.6 billion of pre-tax gains on equity investments. Excluding those (my estimate), the multiple is about 25.9 times. On enterprise value to trailing operating income it is 21.7 times. Applied to the run rate implied by October-quarter guidance, it is about 15 times.
The cash-flow math says the price already assumes a lot of growth. My reverse discounted cash flow model starts from trailing free cash flow less stock compensation, about $119.8 billion. At an 11% discount rate, today’s price implies about 22% annual growth for five years, fading to 3% by year ten. My base case, with 20% growth, gives about $159 a share. The bull case, with 30% growth and a 10% discount rate, gives about $330. The bear case, with 5% growth and a 12% discount rate, gives about $62. Small changes in assumptions move these values a lot. Every DCF input in this piece is the author’s assumption.
The quant profile is high-octane. Over ten years NVDA compounded at 59.1% a year with 50.2% annualized volatility, a Sharpe ratio of 1.13 and a maximum drawdown of 66.3%. Its one-year beta to the S&P 500 is 1.78. A five-year Fama-French regression gives a market loading of 1.90, a strong momentum tilt, a strong anti-value tilt and an annualized alpha of 38.5% with a t-statistic of 2.67. Daily returns have fat tails, with excess kurtosis of 7.6.
The technical picture is broken in the short term and stretched to the downside. The price is 13% below its 200-day average and 18% below its 50-day. The 14-day RSI is 27.4, which is oversold. The price closed below the lower Bollinger band. The MACD has been below its signal line since October 12. The heaviest trading volume of the past year sits around $179 to $189, which is where the stock is now. The 52-week low is $164.27 (intraday, March 30).
The next catalyst is close. NVIDIA reports fiscal Q3 2027 on November 17, 2026 after the close. Over 44 reports since late 2015, the average absolute next-session move was 6.9%, three times a normal day. On top of that, the board opened an independent investigation on November 8 after reports that CEO Jensen Huang had been the target of a foreign intelligence effort.
Where NVIDIA stands on November 10, 2026
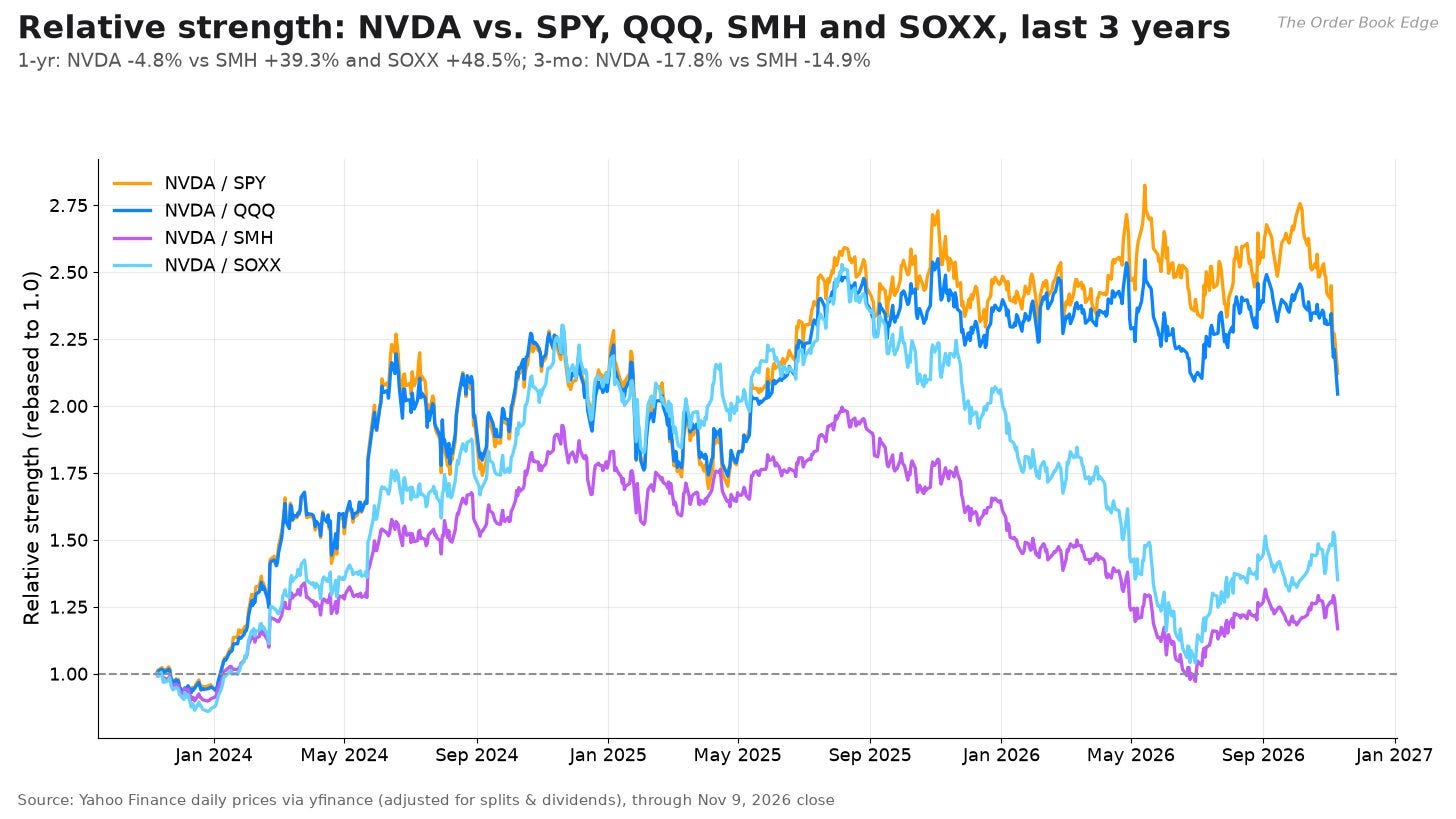
Start with price. NVDA’s total return over the past year is −4.8%. Over the same period SPY returned +13.5%, QQQ +11.6%, the VanEck Semiconductor ETF (SMH) +39.3% and the iShares Semiconductor ETF (SOXX) +48.5%. Year to date, NVDA is down 4.0% while SMH is up 35.3%. For most of the past three years the market treated NVIDIA as a proxy for the entire AI build-out. This year, the rest of the chip sector pulled ahead.
The past month was harsh for everyone in semiconductors, and NVDA did not stand out. It fell 22.1% over the month, against 19.2% for SMH and 21.3% for SOXX. The November 5 session did most of the damage. According to CNBC, Qualcomm sank after its earnings report and led a post-election chip sell-off. Coverage summarized by The Herald Business and etf.net reported a 5.5% drop for the Nasdaq Composite, which put it in correction territory, and a 12% plunge in the Philadelphia Semiconductor Index, its worst day since March 2020. AMD fell about 17% and NVIDIA 9.3%. The stated worries were tighter regulation of data centers after the midterm results and the risk of a slowdown in AI infrastructure spending.
Then came a company-specific headline. On November 8 NVIDIA’s board said it was opening an independent investigation “in light of recent reporting that founder and CEO Jensen Huang has been the target of a foreign intelligence effort.” A committee of independent directors with outside counsel will oversee it. The board said it has “no reason to believe that either national security or NVIDIA secrets were compromised” and that it “has confidence in Jensen and his leadership team.” CNBC, NBC News and NPR have the details as reported. The stock fell 4.3% on November 9. The investigation is ongoing, and this article treats its outcome as unknown.
The next scheduled event is earnings. NVIDIA has set its fiscal Q3 2027 call for Tuesday, November 17, 2026, at 5:00 p.m. Eastern. The quarter ended October 25, 2026. Company guidance is $108.0 billion of revenue, plus or minus 2%, with a gross margin of 74.0%, plus or minus 50 basis points. The guidance assumes no Data Center compute revenue from China.
Data and methods
Here is what the numbers in this article rest on, with as-of dates:
Prices: daily adjusted and unadjusted closes for NVDA, SPY, QQQ, SMH and SOXX from Yahoo Finance via the yfinance library, through the November 9, 2026 close. Total returns use dividend- and split-adjusted closes. Technical indicators use regular closes.
Fundamentals: NVIDIA’s XBRL company facts from SEC EDGAR (CIK 0001045810), the fiscal 2026 Form 10-K (filed February 25, 2026), the fiscal Q2 2027 Form 10-Q (filed August 26, 2026), and the Q2 press release and CFO commentary filed on Form 8-K the same day. Older market-platform revenue comes from the fiscal 2018, 2020 and 2023 10-Ks. NVIDIA’s fiscal year ends on the last Sunday of January, so fiscal 2026 ended January 25, 2026.
Rates: the 10-year Treasury yield (FRED series DGS10) was 4.86% and the 3-month Treasury bill yield (DGS3MO) was 4.19%, both as of November 6, 2026, the latest values available when I pulled the data.
Factors: the Fama-French five-factor and momentum daily series from Kenneth French’s data library, which run through September 30, 2026.
Share counts: all per-share history is adjusted for the four-for-one split in July 2021 and the ten-for-one split in June 2024.
Fiscal fourth quarters are derived as the full-year figure minus the first nine months, because NVIDIA does not file a separate 10-Q for its fourth quarter. “Trailing twelve months” (TTM) always means Q3 fiscal 2026 through Q2 fiscal 2027, the four quarters ending July 26, 2026.
One reporting change matters. Starting in fiscal 2027, NVIDIA’s revenue breakdown shows Data Center (split into Hyperscale and a group it labels ACIE) and Edge Computing. The older Gaming, Professional Visualization and Automotive lines no longer appear as separate headline categories, and they appear to be rolled into Edge Computing. The long history below therefore stops at fiscal 2026, and the two latest quarters are shown on the new basis.
The business in numbers
From graphics card company to data-center platform
Ten years ago NVIDIA was a gaming company with an interesting side business. Fiscal 2016 revenue was $5.0 billion, and $2.8 billion of that was Gaming. Data Center was $339 million. By fiscal 2026, revenue was $215.9 billion, and Data Center was $193.7 billion of it. Within Data Center, compute was $162.4 billion and networking
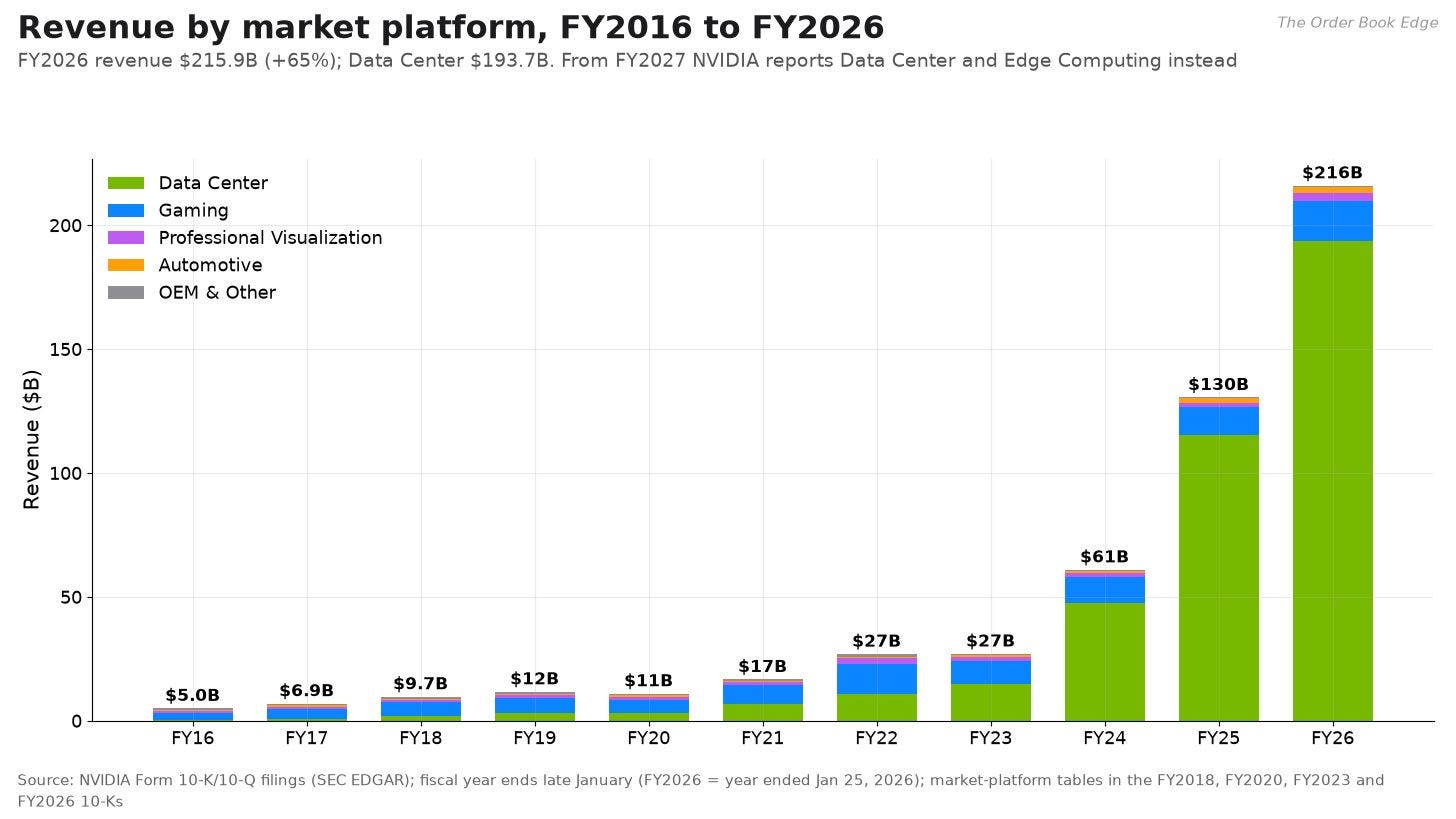
$31.4 billion. Gaming grew too, to $16.0 billion, but it is now a rounding error next to Data Center.
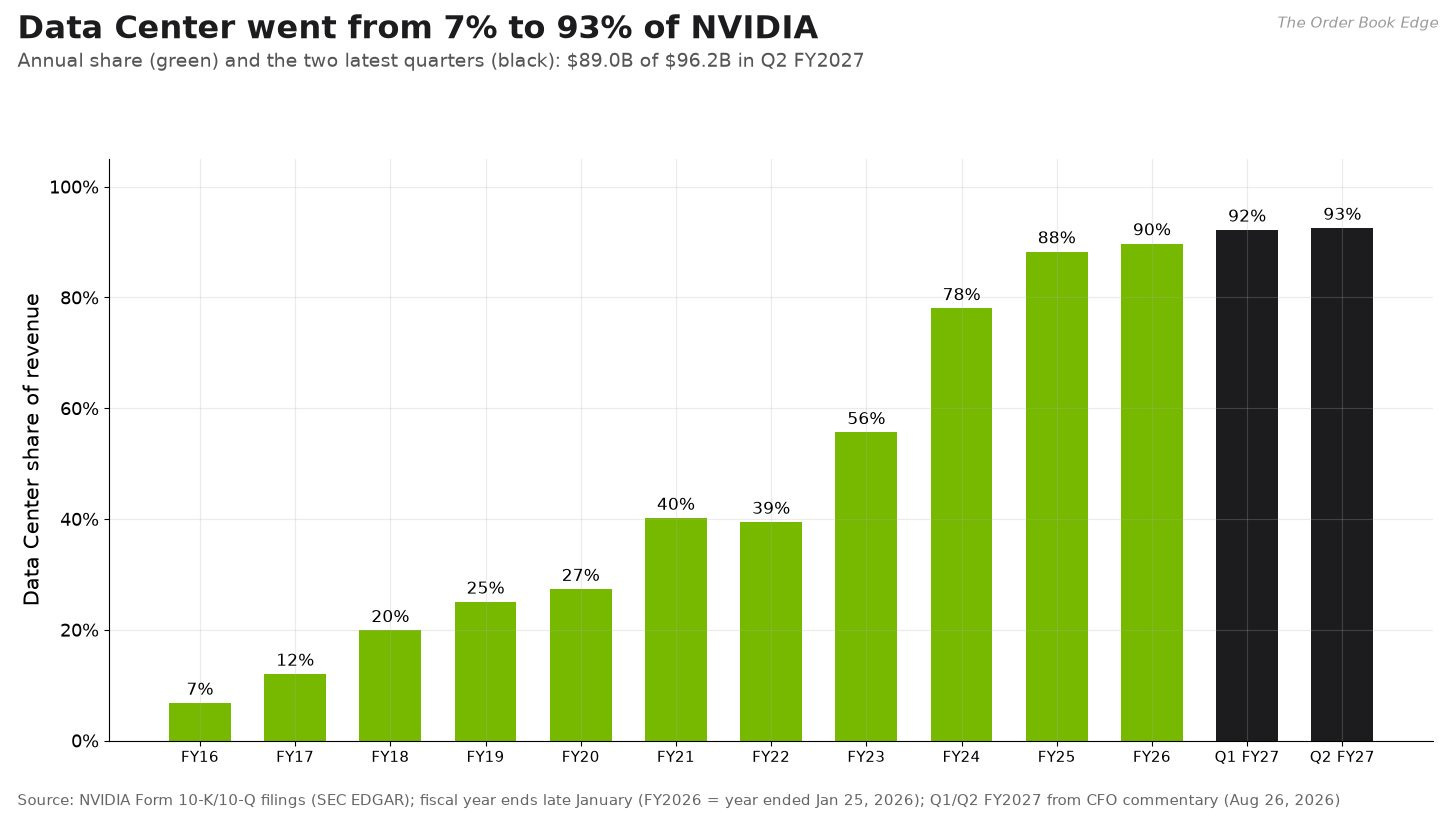
The share chart shows how complete the shift has been. Data Center was 7% of revenue in fiscal 2016, 27% in fiscal 2020, 56% in fiscal 2023, 78% in fiscal 2024 and 90% in fiscal 2026. In the latest two quarters it was 92% and 93%. This matters for every model that follows. NVIDIA’s revenue is now, to a first approximation, the AI accelerator and networking budget of a few dozen very large buyers. The 10-K says
one direct customer accounted for 22% of fiscal 2026 revenue and another for 14%. The latest 10-Q says three direct customers accounted for 16%, 15% and 13% of first-half fiscal 2027 revenue. Direct customers are often system builders and distributors rather than end users, but the concentration is real.
Decomposing growth
A useful way to see where growth comes from is to split total revenue growth into contributions from each segment. Let Rₜ be total revenue in period t, and let Rᵢ,ₜ be revenue from segment i. Then:

Here gₜ is total growth, wᵢ,ₜ₋₁ is segment i’s share of revenue in the prior period and gᵢ,ₜ is segment i’s own growth rate. Each product wᵢ,ₜ₋₁ gᵢ,ₜ is that segment’s contribution to growth in percentage points. The contributions add up exactly to total growth.
For fiscal 2026, total revenue grew 65.5%. Data Center contributed 60.2 percentage points of that, Gaming 3.6 points, Professional Visualization 1.0, Automotive 0.5 and OEM and other 0.2. Gaming grew 41% and Professional Visualization grew 70%, both strong, but they started from small bases. In the July 2026 quarter the picture is even starker. Total revenue grew 106% year over year. Data Center grew 117% and contributed about 102.5 points. Edge Computing grew 27% and contributed about 3.3 points. In effect, every point of NVIDIA’s growth is a Data Center point.
The quarterly trajectory
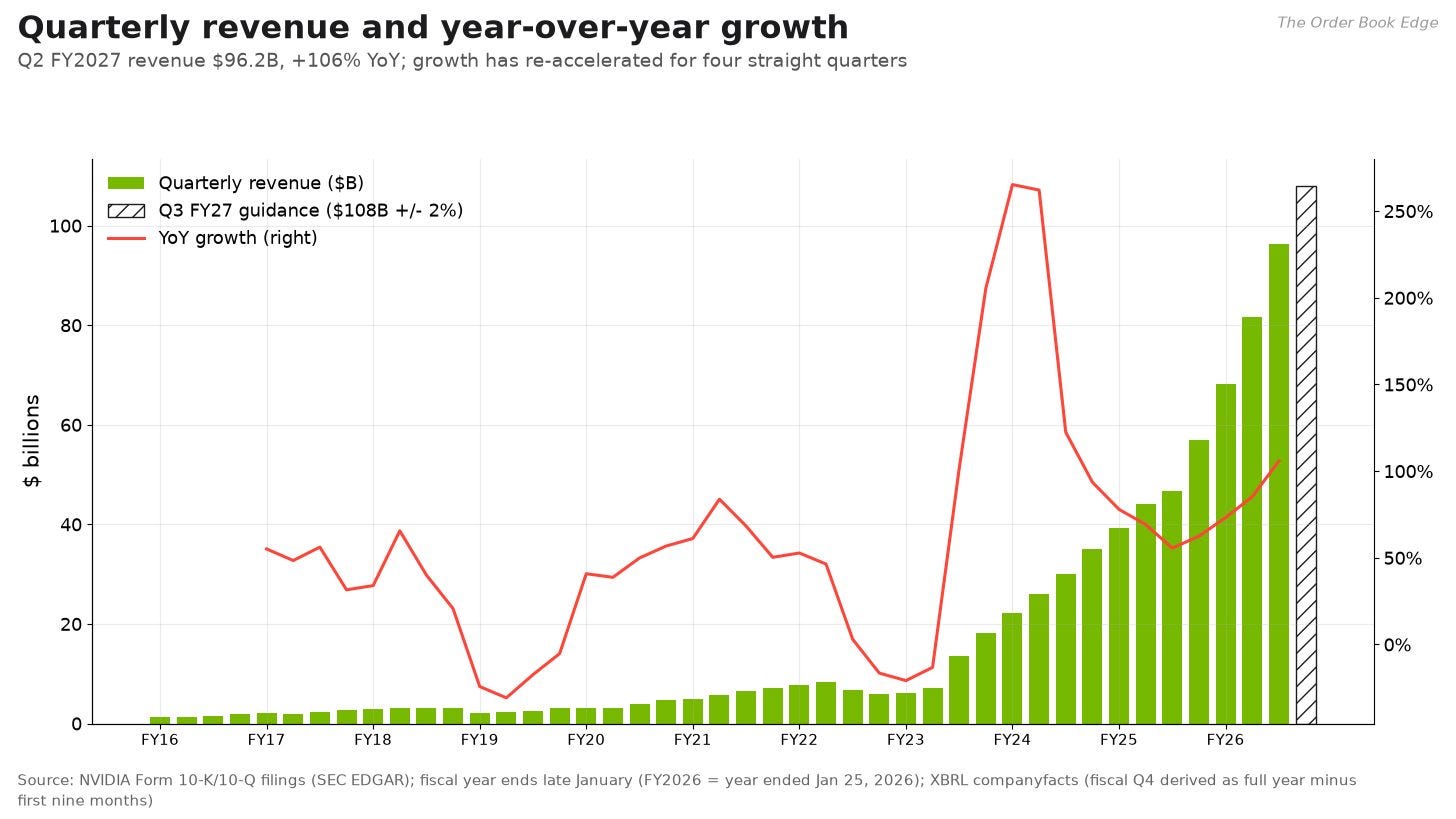
Quarterly revenue went from $46.7 billion in the July 2025 quarter to $57.0 billion, $68.1 billion, $81.6 billion and $96.2 billion. That is a sequential growth rate of 18% to 22% a quarter for four straight quarters. The October-quarter guide of $108 billion implies about 12% sequential growth and about 89% year-over-year growth. NVIDIA has typically reported above the midpoint of its guide in recent years, but that is a pattern, not a promise.
What is driving it? On the August 26 earnings call, CFO Colette Kress said the Vera Rubin platform had begun production shipments, that it would be about 20% of October-quarter Data Center revenue, and that it was the fastest product ramp in the company’s history. She put NVIDIA’s revenue opportunity at about $18 billion per gigawatt of data-center capacity for Hopper, $25 billion for Blackwell and $40 billion for Vera Rubin. She said the five largest hyperscalers are expected to spend nearly $800 billion on capital expenditure in calendar 2026 and about $1.3 trillion in 2027, and she described fiscal 2028 revenue growth of about 70% as supply-constrained. Those are management’s statements, and the article treats them as such.
The per-gigawatt framing gives a simple capacity model. If G is the gigawatts of AI capacity that customers bring online in a year and p is NVIDIA’s revenue per gigawatt, then annual Data Center revenue is roughly R_(DC) ≈ G · p. Annualizing the October-quarter guide gives about $432 billion. At $25 billion to $40 billion a gigawatt, that corresponds to roughly 11 to 17 gigawatts of capacity a year. The useful insight is that NVIDIA can grow either by shipping into more gigawatts or by capturing more dollars per gigawatt. The move from Blackwell to Rubin, if management’s numbers hold, raises p by 60%.
Margins and operating leverage
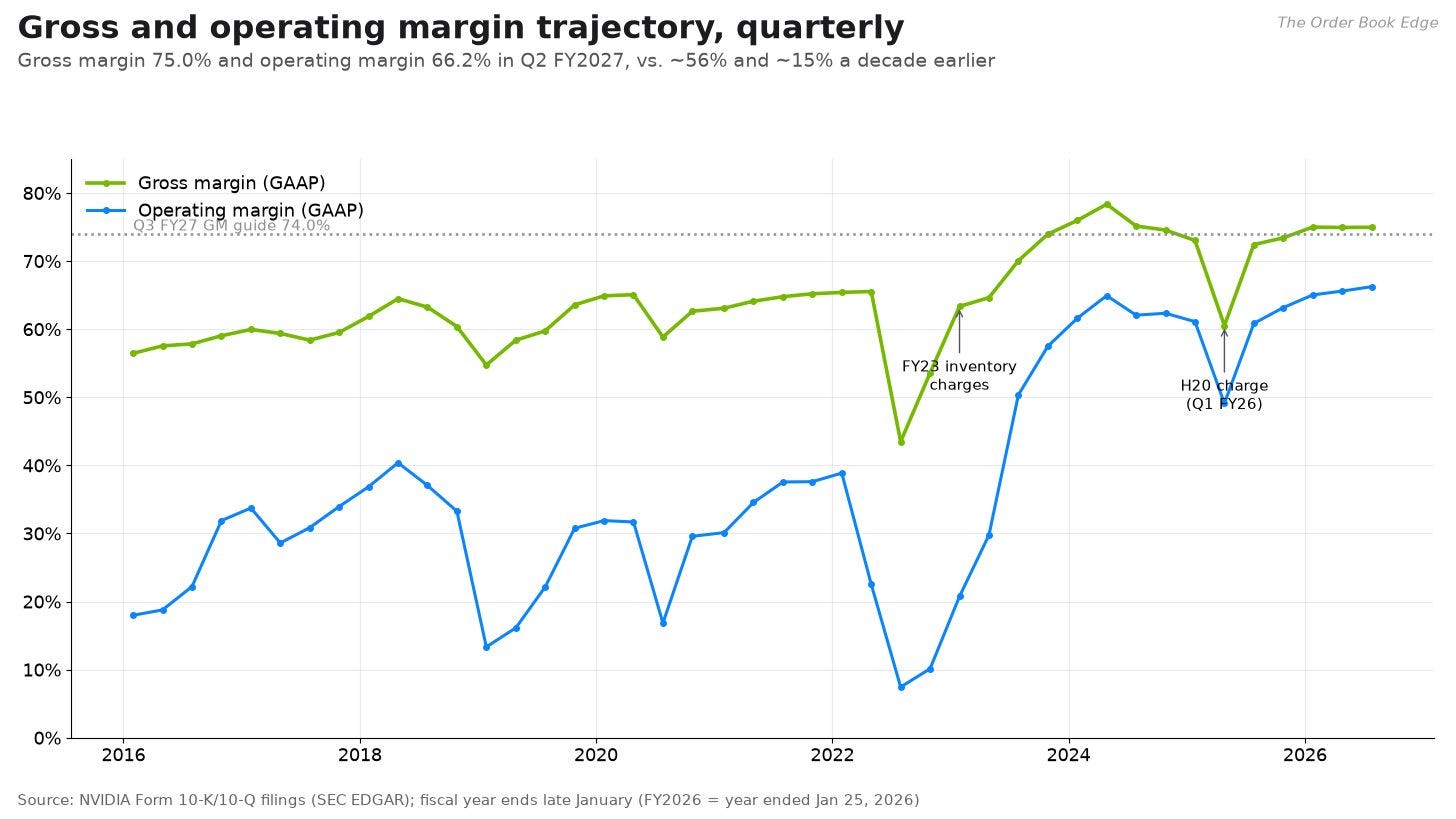
NVIDIA’s gross margin was around 56% in fiscal 2016 and stayed in the high 50s to low 60s for years. It jumped above 70% in fiscal 2024 as Hopper systems sold at scarcity prices. It dipped twice: in fiscal 2023, when the company took inventory charges as crypto and gaming demand fell, and in the April 2025 quarter, when a $4.5 billion charge tied to H20 export restrictions cut gross margin to about 60.5%. Since then it has climbed back to 75.0% in the July 2026 quarter. The guide for October is 74.0%, which is slightly lower, as the new Rubin systems ramp.
Operating margin tells the operating leverage story more clearly. It was 15% to 33% for most of the decade. It reached 66.2% in the latest quarter. Over the trailing year, operating expenses (gross profit minus operating income) were about $28.7 billion on $303 billion of revenue, under 10 cents per dollar of sales.
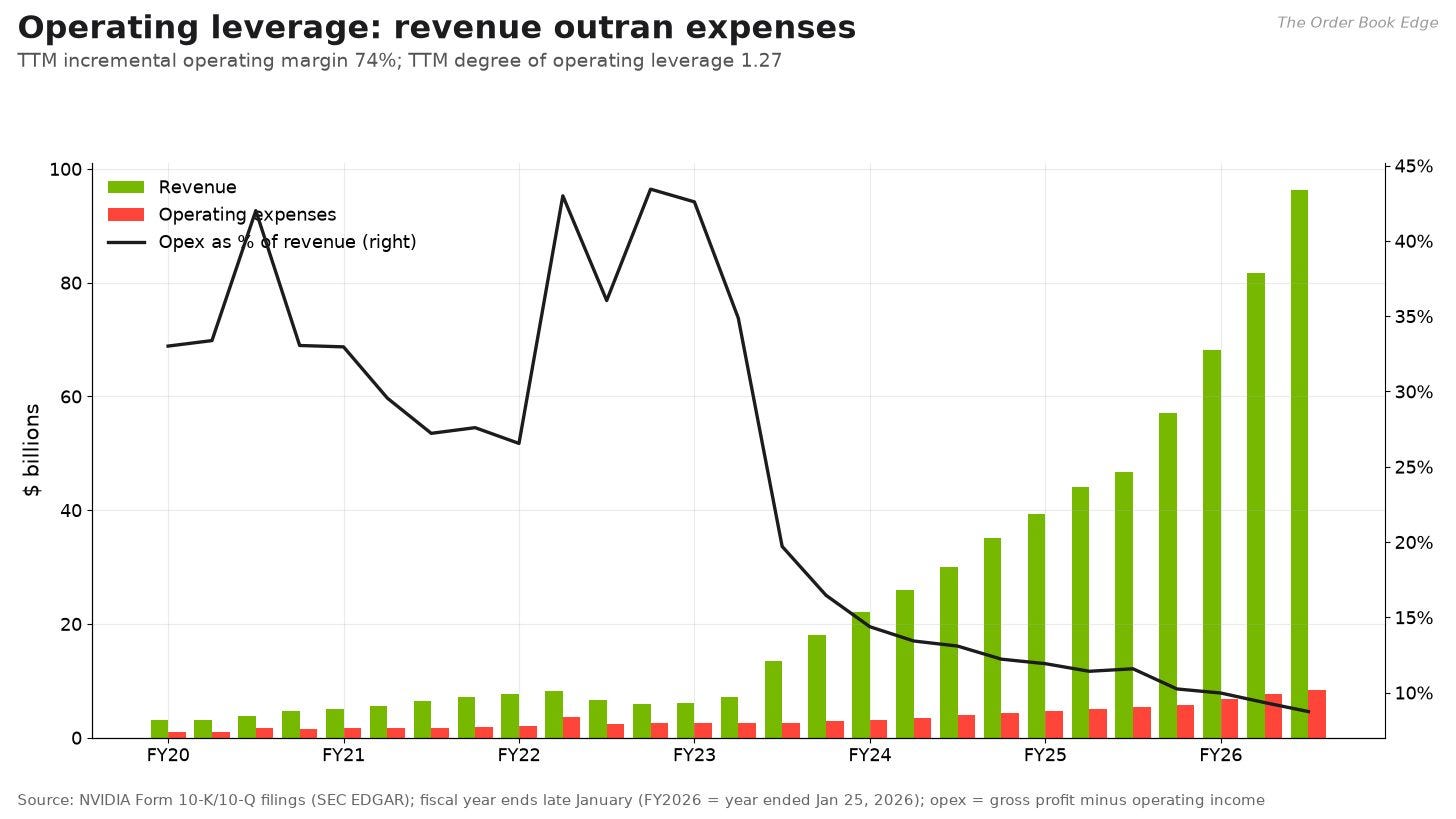
Two measures make operating leverage precise. The degree of operating leverage (DOL) is the percentage change in operating income divided by the percentage change in revenue. The incremental operating margin is the dollar change in operating income divided by the dollar change in revenue:

EBIT is operating income (earnings before interest and taxes), R is revenue and Δ is the change from period t−1 to period t. A DOL above 1 means profits grow faster than sales. An incremental margin above the average margin means the business is getting more profitable as it grows.
On trailing numbers, revenue grew 83.4% and operating income grew 105.9%, so DOL is about 1.27. The incremental operating margin was 73.8%, well above the 65.2% average. For fiscal 2024 DOL was 5.4, because operating income had been depressed by the fiscal 2023 inventory charges. For fiscal 2026 it was 0.92, slightly below 1, because the H20 charge temporarily cut margins. The lesson is that DOL swings a lot, and its sign depends on what happened to fixed costs and one-off charges. The more durable observation is that NVIDIA’s operating expenses have grown much more slowly than revenue. Research and development fell from about 27% of revenue in fiscal 2023 to 8.6% in fiscal 2026.
Operating leverage also works in reverse, and this is the main reason the stock is so sensitive to demand signals. If revenue fell 20% while operating expenses kept growing, operating income would fall by considerably more than 20%. The fiscal 2023 episode, when revenue was flat and operating income fell 58%, is the most recent example.
Earnings, cash flow and capital return
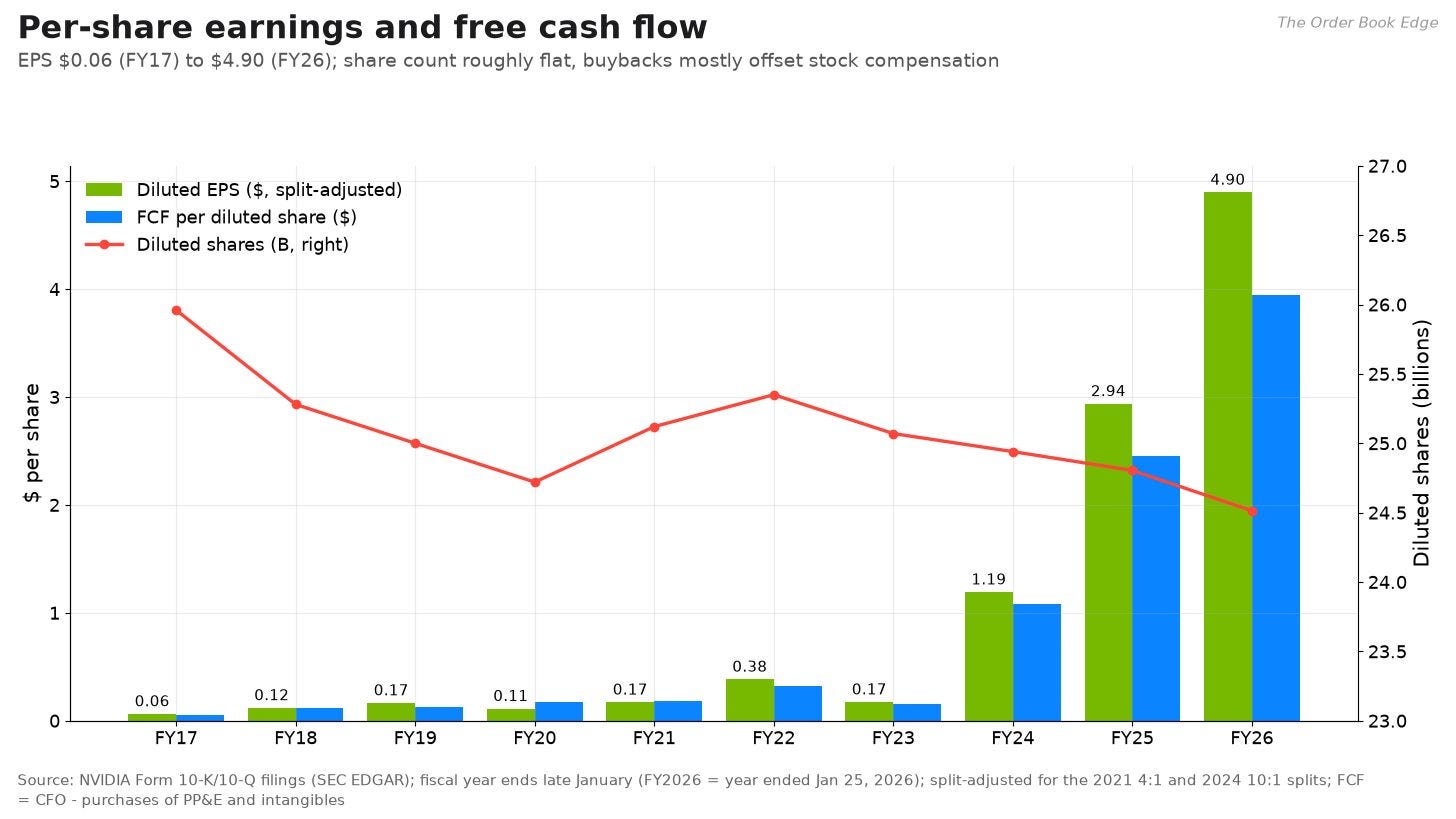
Split-adjusted diluted earnings per share went from $0.06 in fiscal 2017 to $4.90 in fiscal 2026. Over the five years from fiscal 2021 to fiscal 2026, EPS compounded at about 95% a year. Free cash flow, defined here as operating cash flow minus purchases of property, equipment and intangible assets, rose from $1.1 billion in fiscal 2016 to $96.7 billion in fiscal 2026, a 10-year compound rate of about 57%. The diluted share count barely moved, from about 26.0 billion in fiscal 2017 to 24.5 billion in fiscal 2026. In other words, almost all of NVIDIA’s per-share growth came from the business itself, not from shrinking the share count.
The quality of trailing earnings
Trailing GAAP net income is $192.9 billion, and trailing operating income is $197.6 billion. Normally net income sits well below operating income because of taxes. At NVIDIA the two are nearly equal because of “other income,” which mostly consists of gains on the company’s equity investments. Those gains were about $15.9 billion in the April 2026 quarter and $7.8 billion in the July quarter. In fiscal 2026 as a whole they were $8.9 billion. By my count, the trailing four quarters include about $30.6 billion of pre-tax investment gains. After tax at about 16.5%, they add roughly $25.5 billion to net income. Removing them gives “core” trailing net income of about $167.4 billion, or about $6.89 per diluted share. This is my estimate, not a company figure.
Those investments are now large. At the end of July, NVIDIA held $42.8 billion of marketable equity securities and $51.2 billion of non-marketable equity securities, about $93.9 billion in total. They represent stakes in customers, partners and AI developers. They have added to reported earnings while their values rose. If those values fall, the same accounting will subtract from earnings. They also deepen the overlap between NVIDIA’s own results and the financial health of its customers, which is a theme that recurs below.
Two accounting changes also matter when you compare periods. From fiscal 2027, NVIDIA’s non-GAAP figures no longer exclude stock-based compensation, so non-GAAP EPS of $2.22 in the July quarter was below GAAP EPS of $2.46, which included the investment gains. The effective tax rate in the July quarter was 16.5%, and the company guides 16% to 18% for the full year.
Cash conversion slowed in the July quarter
Over the trailing year, operating cash flow was $134.4 billion and capital spending was about $7.4 billion, so free cash flow was about $127.0 billion. That is a lot of cash, but it is about 66 cents for every dollar of GAAP net income, which is unusually low for NVIDIA. The July quarter stands out. Operating cash flow was only $24.1 billion on net income of $59.7 billion, and free cash flow was $21.3 billion. In the April quarter, by contrast, free cash flow was about $48.6 billion.
Some of the gap is mechanical. Investment gains raise net income without producing cash. But working capital is the larger part. Accounts receivable rose from $38.5 billion at the end of January to $63.1 billion at the end of July. Days sales outstanding, a measure of how long customers take to pay, rose to 60 days from 45 according to the CFO commentary. Inventory rose from $21.4 billion to $31.6 billion. A company ramping a new platform this fast will always tie up cash in inventory and receivables. Even so, receivables growing faster than revenue are worth tracking. If the November report shows receivables and inventory stabilizing, the July quarter will look like a timing issue. If they keep climbing, that will be a warning sign.
Capital return
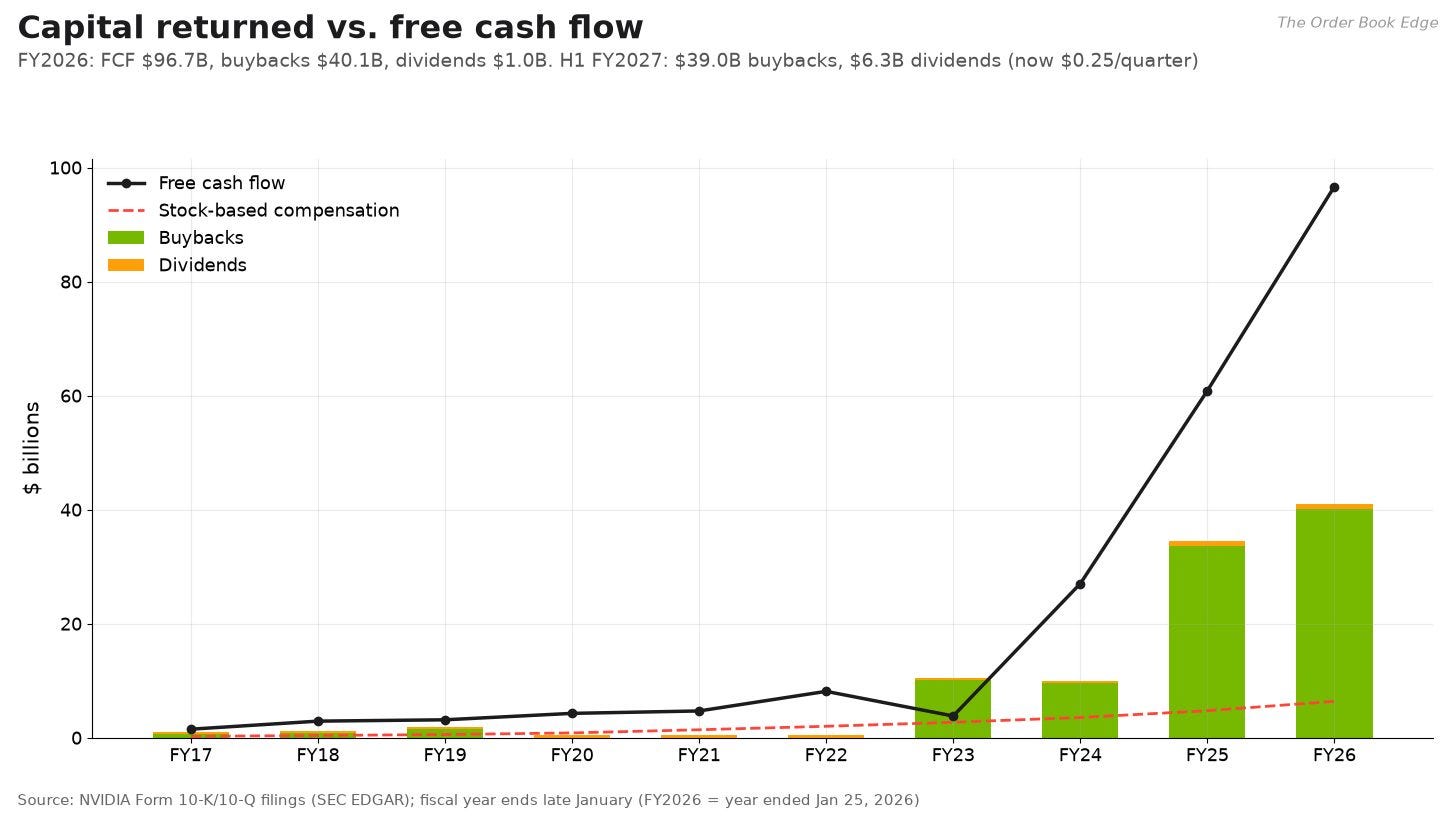
NVIDIA returned $41.1 billion to shareholders in fiscal 2026: $40.1 billion in buybacks and $1.0 billion in dividends. In the first half of fiscal 2027 it bought back $39.0 billion of stock and paid $6.3 billion in dividends. The dividend jumped from a token one cent a quarter to $0.25 a quarter, according to the Q2 press release, which works out to a yield of about 0.56% at today’s price. The company had about $99.0 billion left on its buyback authorization at the end of July. Kress said NVIDIA had returned 60% of free cash flow year to date.
The chart also shows why the share count has not fallen much despite large buybacks. Stock-based compensation was $6.4 billion in fiscal 2026 and about $7.2 billion over the trailing year. A large part of every buyback offsets the new shares issued to employees. That is why the DCF below subtracts stock compensation from free cash flow.
The balance sheet and the new scale of commitments
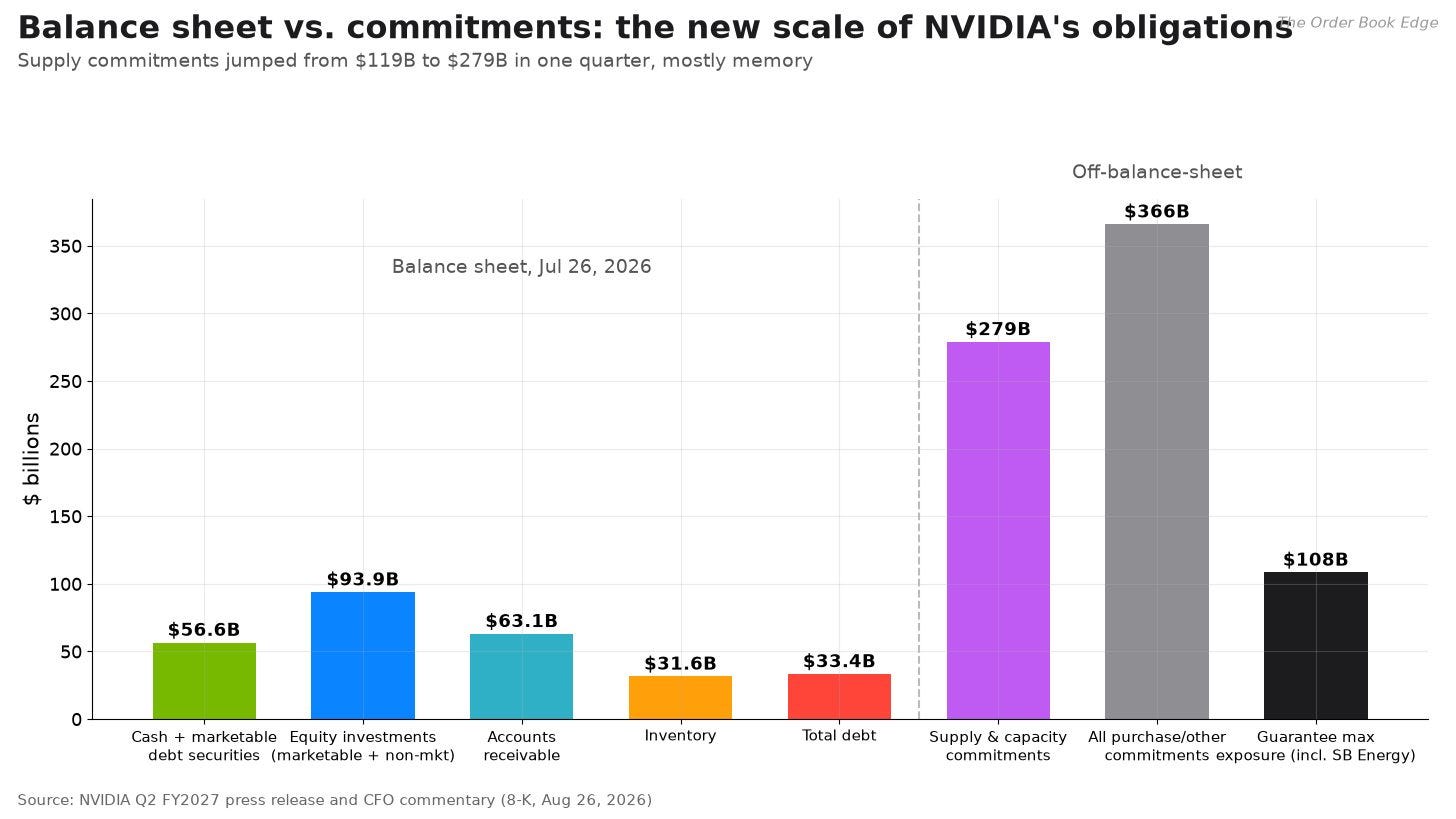
At the end of July, NVIDIA had $56.6 billion of cash and marketable debt securities against $33.4 billion of debt. The debt figure includes a $25 billion notes offering completed during the quarter. Net cash, by my calculation, is about $23.2 billion. That is a small number next to a $4.3 trillion market value, and the balance sheet is clearly not a constraint. The more interesting numbers sit off the balance sheet.
The 10-Q discloses about $279 billion of supply and capacity commitments, up from about $119 billion at the end of the prior quarter. Management attributed most of the increase to memory. Total purchase and other commitments are about $366 billion. These figures show how NVIDIA is securing supply: it locks in high-bandwidth memory, advanced packaging and wafer capacity years ahead, at enormous scale. That is a competitive advantage, because smaller rivals cannot match it, and also a risk. If demand slowed sharply, NVIDIA would still be committed to buying components for it.
The 10-Q also discloses guarantees with a maximum exposure of about $108.5 billion. Most of that is a guarantee of up to $105 billion that NVIDIA entered in August 2026 for leases at SB Energy’s PORTS Technology Campus in Pike County, Ohio. The campus covers about 4.25 gigawatts of IT load, will “exclusively host our compute under 20-year leases to OpenAI,” and its first construction phase is expected in fiscal 2029. NVIDIA pays only if the tenant defaults, so this is contingent support, not spending. Still, it is a new kind of exposure for a chip company. NVIDIA is now partly underwriting a customer’s ability to pay for data centers that will be full of NVIDIA hardware.
Put together, three items point the same way: rising receivables, nearly $94 billion of equity stakes in the AI ecosystem, and a $105 billion lease guarantee. NVIDIA’s results are becoming more tightly linked to its customers’ access to capital. In a strong market that loop amplifies growth. In a funding squeeze, it would amplify the downturn.
The demand debate: capex, China, competition, supply
Hyperscaler capex
The bull case rests on one number: how much the world’s largest technology companies keep spending on data centers. Kress’s figures of nearly $800 billion for the top five hyperscalers in 2026 and about $1.3 trillion in 2027 describe a spending wave larger than anything in the history of the industry. She also cited a cloud backlog of more than $2 trillion. These are management’s figures, drawn from customers’ plans, and they are not guaranteed. The November 5 sell-off showed that the market’s confidence in them can wobble quickly. According to the coverage cited earlier, that move followed concerns about tighter data-center regulation after the midterm elections and a cautious outlook from Qualcomm.
China and export controls
China was once a major market for NVIDIA’s data-center chips. In fiscal 2026, revenue from customers headquartered in China, including Hong Kong, was $19.7 billion, about 9% of the total, down from $25.0 billion in fiscal 2025. The 10-K says NVIDIA was effectively shut out of China’s data-center compute market for much of the year. The policy changed on January 15, 2026, when the Commerce Department’s Bureau of Industry and Security moved H200 export applications to China from a presumption of denial to case-by-case review. CNBC reported that the arrangement includes a 25% cut for the U.S. government.
In practice, little has flowed. The 10-Q says the PRC government restricted the sales, that NVIDIA took a $0.4 billion charge on excess H200 inventory and purchase obligations in the first half, and that H200 shipments were less than 1% of Data Center revenue in the July quarter. Reuters reported about 600,000 H200 chips sitting in Hong Kong awaiting Chinese import approval. Citing IDC, Reuters also reported that NVIDIA’s share of China’s AI-chip market fell to 34% in the first half of 2026, with Huawei at 28%. Revenue from China-headquartered customers was still $7.9 billion in the July quarter, 8% of the total, but that figure covers all products, not only data-center compute. The October guidance assumes zero China data-center compute revenue. For modeling purposes, China is an option on the upside, not part of the base.
Competition
NVIDIA’s largest customers are also building their own chips. Google’s TPU program is the most advanced. Yahoo Finance describes it as growing faster than NVIDIA’s own business, and TrendForce reports that more suppliers are joining Broadcom as design partners. AMD’s MI400-series and Helios rack systems are targeted for the second half of 2026. According to Tom’s Hardware, AMD has denied reports of delays. I have not found market-share figures for 2026 that I can verify, so I will not cite any. The direction is clear, though. Custom accelerators are taking a growing share of new AI capacity at the largest buyers, while NVIDIA keeps most of the merchant market and is expanding into CPUs, networking and inference-specific systems. Kress said she expects CPU revenue to more than double in fiscal 2028.
Supply
The final constraint is supply. Kress said supply will remain a bottleneck at least through the end of fiscal 2028. That cuts both ways. It caps near-term upside, since NVIDIA cannot ship what it cannot build. It also supports pricing and margins, and it gives NVIDIA’s huge supply commitments a strategic role: whoever controls the memory and packaging capacity controls the pace of the build-out.
Valuation: multiples
At $178.67 and 24.1 billion shares, NVIDIA’s market value is about $4.31 trillion. Subtracting about $23.2 billion of net cash gives an enterprise value of about $4.28 trillion. On trailing numbers:
P/E (GAAP): 22.5 times TTM diluted EPS of $7.94.
P/E excluding investment gains (author’s estimate): about 25.9 times core EPS of about $6.89.
EV / operating income: 21.7 times.
EV / sales: 14.1 times. Price-to-sales is 14.2 times, against a 10-year median of 18.4 times.
Free cash flow yield: 2.95% on market value. Using FCF less stock compensation, it is 2.78%.
Dividend yield: about 0.56%.
The valuation history chart is the most striking chart in this article. Measured at each fiscal quarter-end since early 2016, NVIDIA’s trailing P/E has a 10-year median of 49.8 times and a 5-year median of 51.0 times. In the past five years it has ranged from today’s 22.5 times up to 143 times, a peak reached when earnings collapsed in fiscal 2023 while the stock held up. Today’s reading is the lowest in the series.
There are two ways to read that. The optimistic reading is that earnings grew so fast that the price fell behind them: trailing EPS more than doubled over the past year while the stock fell 5%. The skeptical reading is that the market is treating current earnings as a peak and pricing in a cyclical decline, as it does for memory makers at the top of their cycle. Both readings are plausible, and the rest of the valuation work tries to tell them apart.
Forward run rate
Guidance gives a rough forward anchor. October-quarter revenue of $108 billion at a 74% gross margin, less about $9.2 billion of GAAP operating expenses, implies about $70.7 billion of operating income for the quarter. Annualized, that is $282.9 billion. On that run rate the enterprise value is about 15.1 times operating income. Taxing the run rate at 17% and dividing by 24.3 billion diluted shares gives about $9.66 of annualized EPS, or a P/E of about 18.5. This is a mechanical annualization of one quarter’s guidance, not a forecast. It ignores further growth, which is what the bulls expect, and any decline, which is what the bears fear.
For reference, MarketBeat reports analyst expectations of $2.47 in EPS and $108.8 billion of revenue for the October quarter, and an average analyst price target of $317.57. That is one aggregator’s figure, and I have not checked it against other sources.
Valuation versus growth
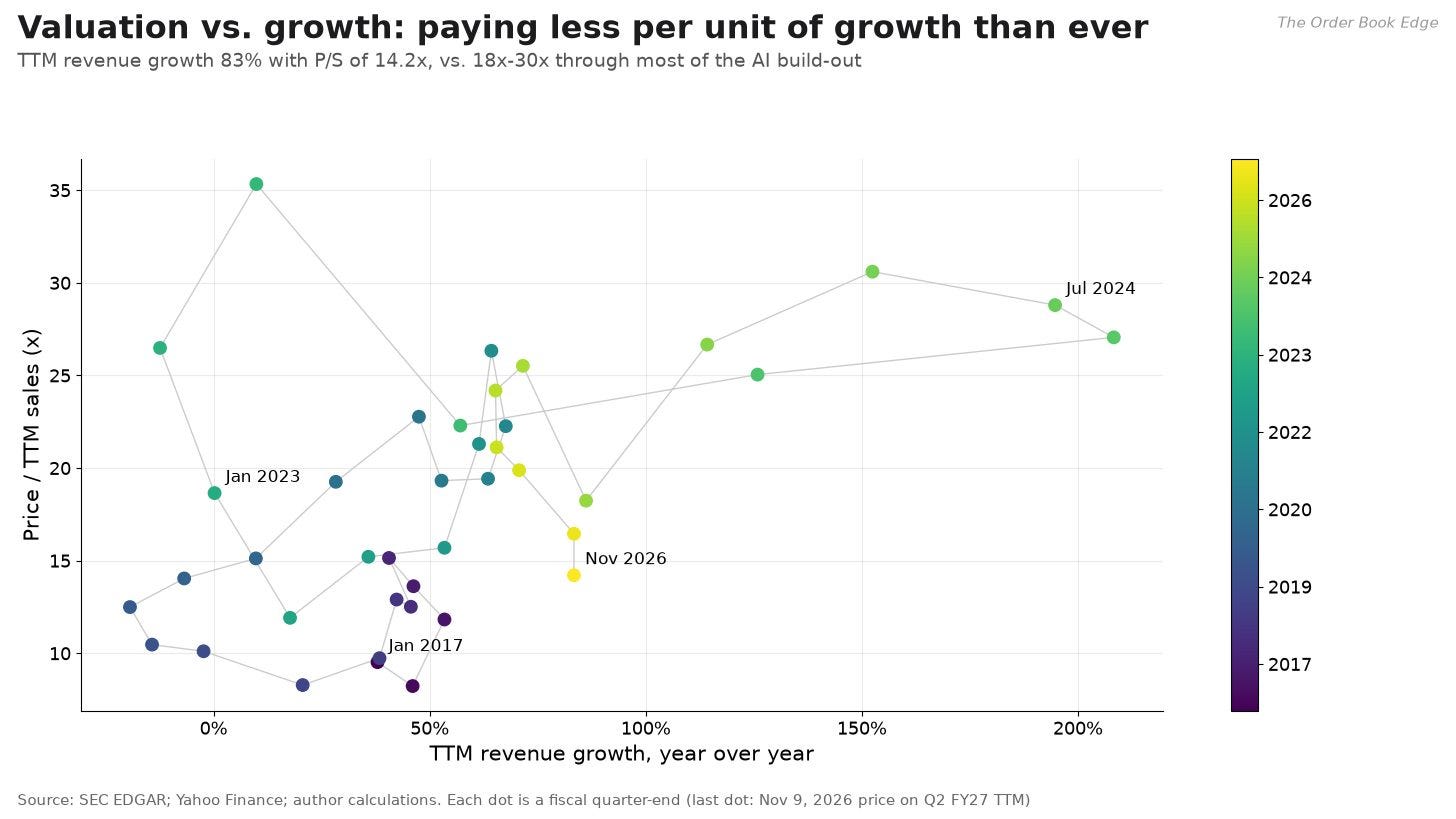
A multiple only means something next to a growth rate. The scatter plots price-to-sales against year-over-year growth in trailing revenue at each quarter-end since 2017. Through the AI build-out of 2023 to 2025, investors paid between about 18 and 30 times sales for growth rates of 60% to 200%. Today the stock sits at 14.2 times sales with trailing revenue growth of 83%. In plain terms, investors are paying less per unit of growth than at any time in the build-out.
A simple way to combine the two is the PEG ratio:
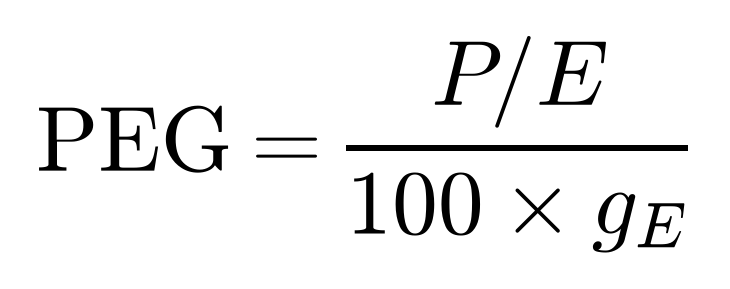
Here P/E is the price-to-earnings multiple and g_E is the expected annual earnings growth rate written as a decimal, so 25% growth enters as 25. A PEG of 1 is the conventional “fair” benchmark for a growth stock. Using trailing EPS growth of 123% gives a PEG of about 0.18. Using the run-rate P/E of 18.5 and Kress’s roughly 70% revenue growth outlook for fiscal 2028 as a stand-in for earnings growth gives about 0.26. Both are very low. PEG has a well-known weakness, though: it treats one year of growth as if it will last. For a business whose growth depends on a capital-spending cycle, that is exactly the question in dispute. That is why we need a DCF.
Valuation: DCF and reverse DCF
The model
A discounted cash flow model values a company as the present value of the cash it will generate. I use a two-stage model with a fade:


V₀ is the present value of the operating business, FCFₜ is free cash flow in year t, r is the discount rate, N = 10 is the explicit forecast horizon, TV_N is the terminal value at year N from the Gordon growth formula, g_∞ is the perpetual growth rate after year 10, g₁ is the growth rate for years 1 to 5, and gₜ fades linearly from g₁ to g_∞ over years 6 to 10. Cash includes marketable debt securities, Debt is total borrowings, and Shares is the current share count of 24.1 billion. I deliberately leave the $93.9 billion of equity investments out of cash. They are volatile and partly illiquid, and including them would add about $3.90 a share.
These are the author’s assumptions:
Starting cash flow: trailing free cash flow less stock-based compensation, about $119.8 billion. Subtracting stock compensation treats it as a real cost, as it should be.
Discount rate: 11% base. The capital asset pricing model (below) gives a cost of equity of r_f + β × ERP. With the 4.86% 10-year yield, an equity risk premium of 4.5% and NVDA’s raw five-year beta of 2.11, that is 14.4%. With the Blume-adjusted beta of 1.74, which shrinks the raw estimate toward 1, it is 12.7%. I use 11% as the base because NVDA’s realized beta has been elevated by its own role as the market’s dominant AI stock, and because a $4 trillion company with net cash is unlikely to carry a permanent 14% cost of capital. Readers who prefer the pure CAPM figure should read the 12% and 13% rows of the grid.
Growth: base g₁ = 20%, with terminal growth of 3%.
Results
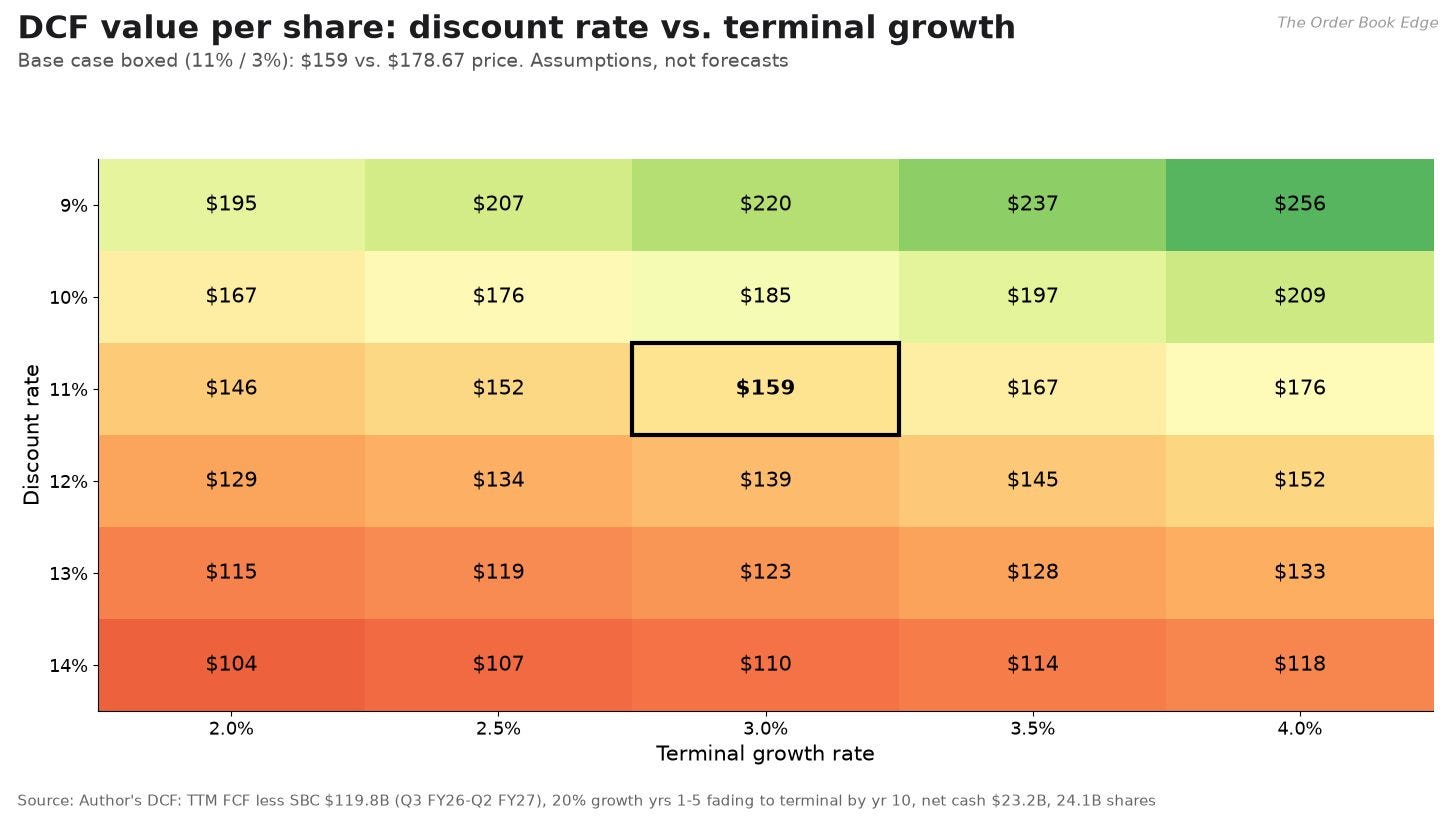
The base case gives about $159 a share, 11% below the current price. The present value of the ten forecast years is about $1.67 trillion, and the discounted terminal value is about $2.15 trillion, 56% of the total. Free cash flow in year 10 would be about $473 billion. The sensitivity grid holds growth at 20% and varies the discount rate and terminal growth. Values range from $104 (14% discount rate, 2% terminal growth) to $256 (9%, 4%). At a 12% discount rate the range is $129 to $152, and at 10% it is $167 to $209.
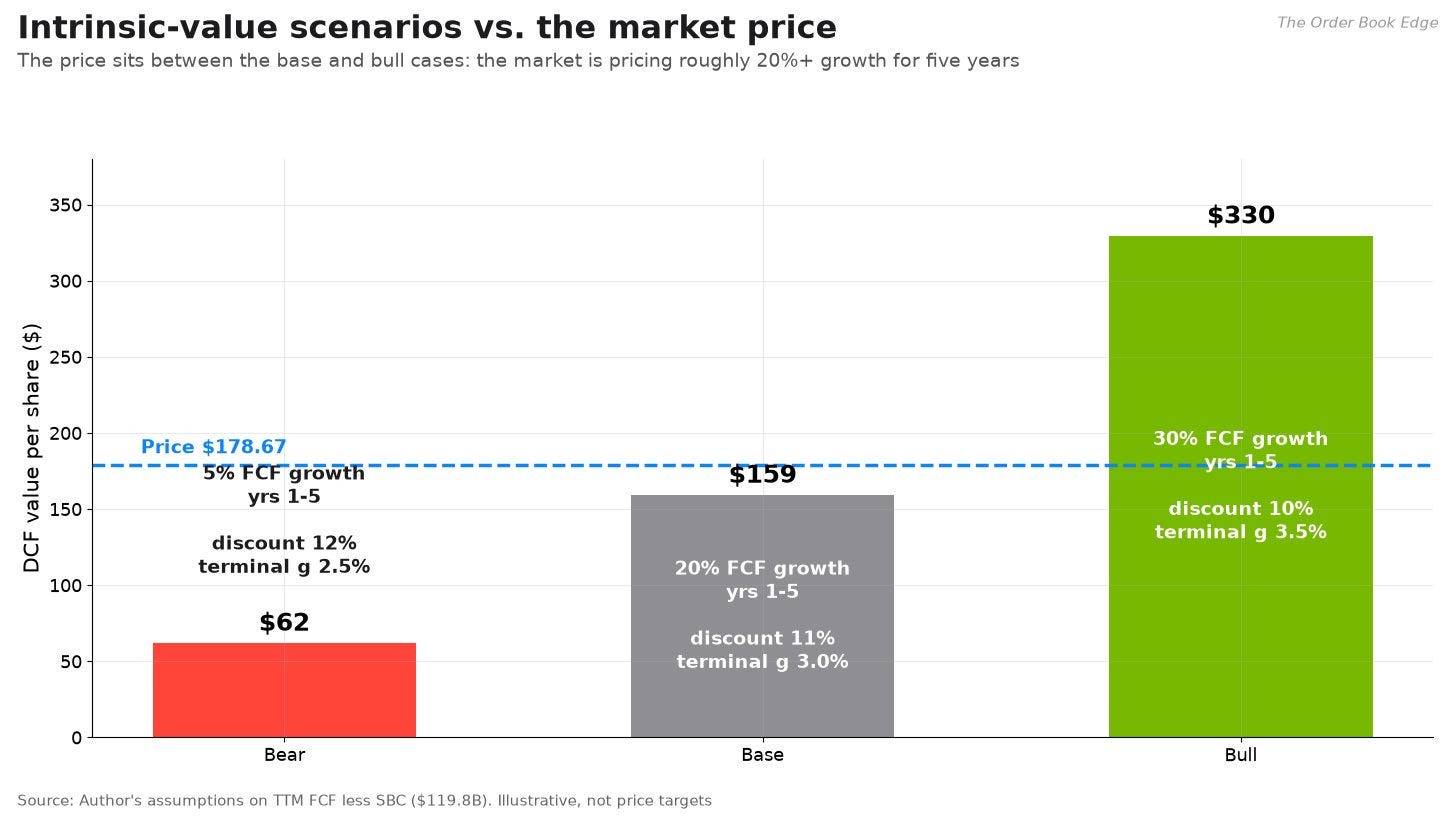
The three scenarios bracket a wide range:
Bear ($62): free cash flow grows 5% a year for five years, discounted at 12%, with 2.5% terminal growth. This is roughly what happens if the AI build-out plateaus soon and NVIDIA’s margins drift toward historical semiconductor levels.
Base ($159): 20% growth, 11%, 3%.
Bull ($330): 30% growth, 10%, 3.5%. This roughly describes a world in which spending keeps compounding into the 2030s and NVIDIA keeps its share.
Growth assumptions matter more than anything else. Holding the discount rate at 11% and terminal growth at 3%, the value is $55 at zero growth, $94 at 10%, $159 at 20%, $206 at 25%, $264 at 30% and $338 at 35%.
Path matters: a boom followed by normalization
A constant growth rate is a crude way to model a cyclical business. To test it, I ran three paths at 11% and 3% terminal growth. Each starts with 50% growth in year 1, roughly consistent with the near-term outlook, and then differs:
Boom then bust: 50%, 30%, 0%, −15%, −5%, then 3% a year. Value: about $93.
Boom then plateau: 50%, 25%, 10%, 5%, then 3%. Value: about $121.
Boom then gradual fade: 50%, 30%, 20%, 15%, 10%, 8%, 6%, 5%, 4%, 3%. Value: about $166.
Even the third path, which assumes cash flow nearly quadruples to about $456 billion in ten years, comes out below today’s price at an 11% discount rate. A strong next two years is not enough on its own. To justify $178.67 on these assumptions, growth has to stay high well beyond the next two years, or the discount rate has to be lower.
Reverse DCF
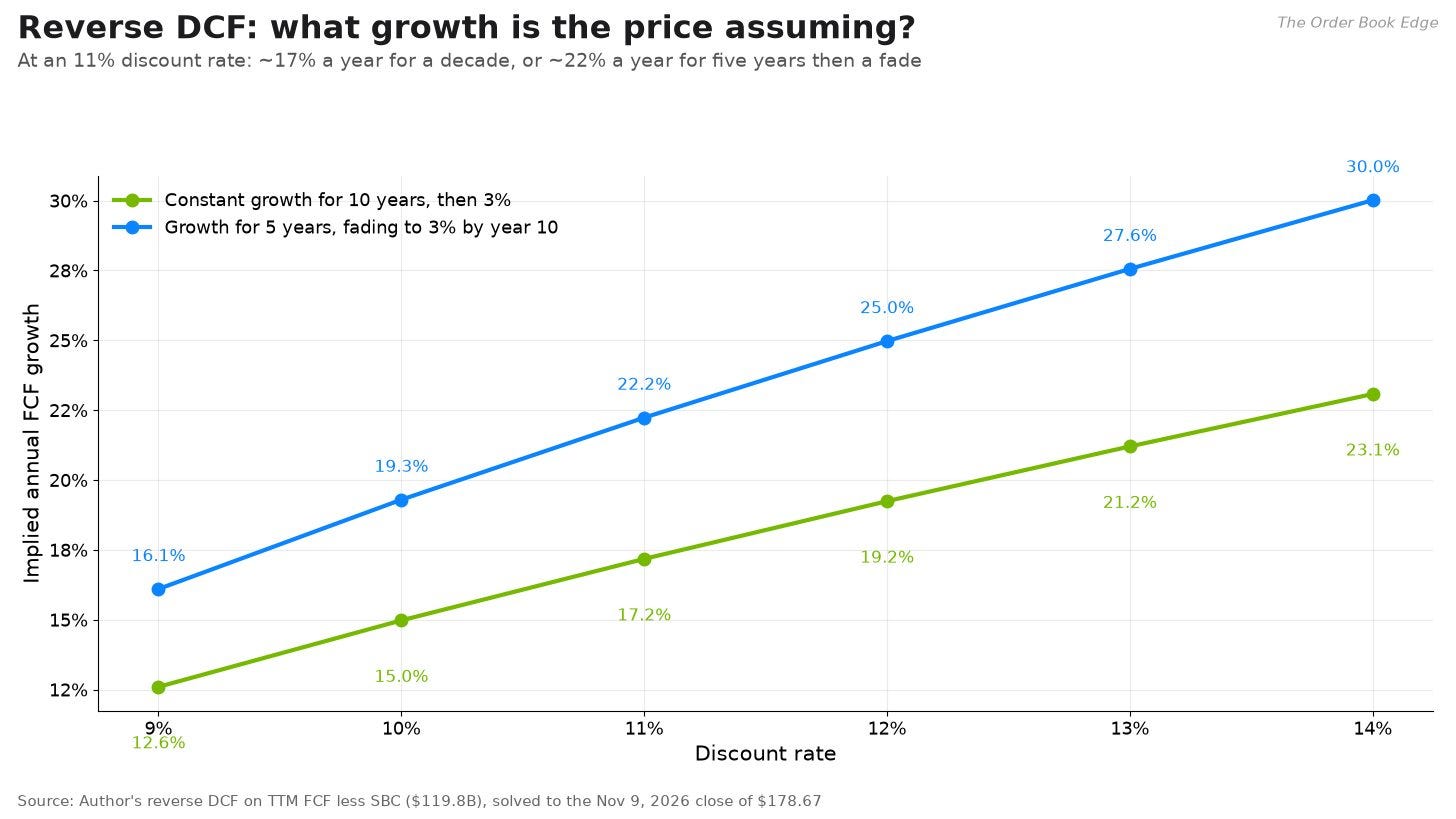
The reverse DCF turns the question around. Instead of choosing growth and computing value, it finds the growth rate that makes the model value equal the market price:

g* is the implied growth rate, V(g*; r, g_∞) is the DCF value of operations computed with that growth rate, and P is the share price. I solve it numerically with Brent’s root-finding method, using two growth structures. If growth is constant for all ten years and then drops to 3%, the price implies 17.2% a year at 11%, 15.0% at 10% and 19.2% at 12%. If growth holds for five years and then fades, as in the base model, the price implies 22.2% at 11%, 19.3% at 10% and 25.0% at 12%.
A quick cross-check uses the Gordon growth model on the whole company. If the price equals next year’s cash flow divided by the gap between the discount rate and growth, the perpetual growth rate the market is pricing in is:

Here y is the current free cash flow yield (using FCF less stock compensation, 2.78% on market value) and r is the discount rate. At 11%, the implied perpetual growth rate is about 8.0%. At 12.7% it is about 9.7%. Cash flow growing 8% a year forever is a high bar for any company, because the world economy grows about 5% to 6% a year in nominal terms.
What the valuation work says
The multiples and the DCF seem to disagree, but they are measuring different things. The multiples say NVIDIA is cheap relative to its own history and its current growth. The DCF says the price still assumes growth of about 20% a year for five years, on a base that is already $120 billion of annual free cash flow. Both statements are true. The stock is cheap if the AI build-out keeps compounding. It is fully valued, or worse, if spending normalizes within two or three years. The price, in effect, is a bet on the length of the cycle.
The quant view: how NVDA behaves
The fundamental work asks what NVIDIA is worth. The quant work asks a different question: what is it like to own? A stock can be undervalued and still be very hard to hold, if its drawdowns are deep enough to force investors out at the bottom. This section measures NVDA’s returns, volatility, market sensitivity, factor exposures, tails and drawdowns. It then uses those measurements to simulate a range of one-year outcomes.
Returns and volatility
Every measure here starts from daily returns. For a price series Pₜ adjusted for splits and dividends, the simple return and the log return on day t are:

Pₜ is the adjusted closing price on day t, Rₜ is the simple return and rₜ is the log (continuously compounded) return. Log returns add up over time, which makes them convenient for modeling. Simple returns are what an investor actually earns. The compound annual growth rate over T years and annualized volatility are:

P₀ and P_T are the starting and ending prices, T is the number of years, σ̂_d is the sample standard deviation of daily log returns, r̄ is their mean, n is the number of days, and 252 is the approximate number of trading days in a year. Scaling by the square root of 252 assumes returns are independent from day to day, which is close enough for NVDA (see the autocorrelation results below).
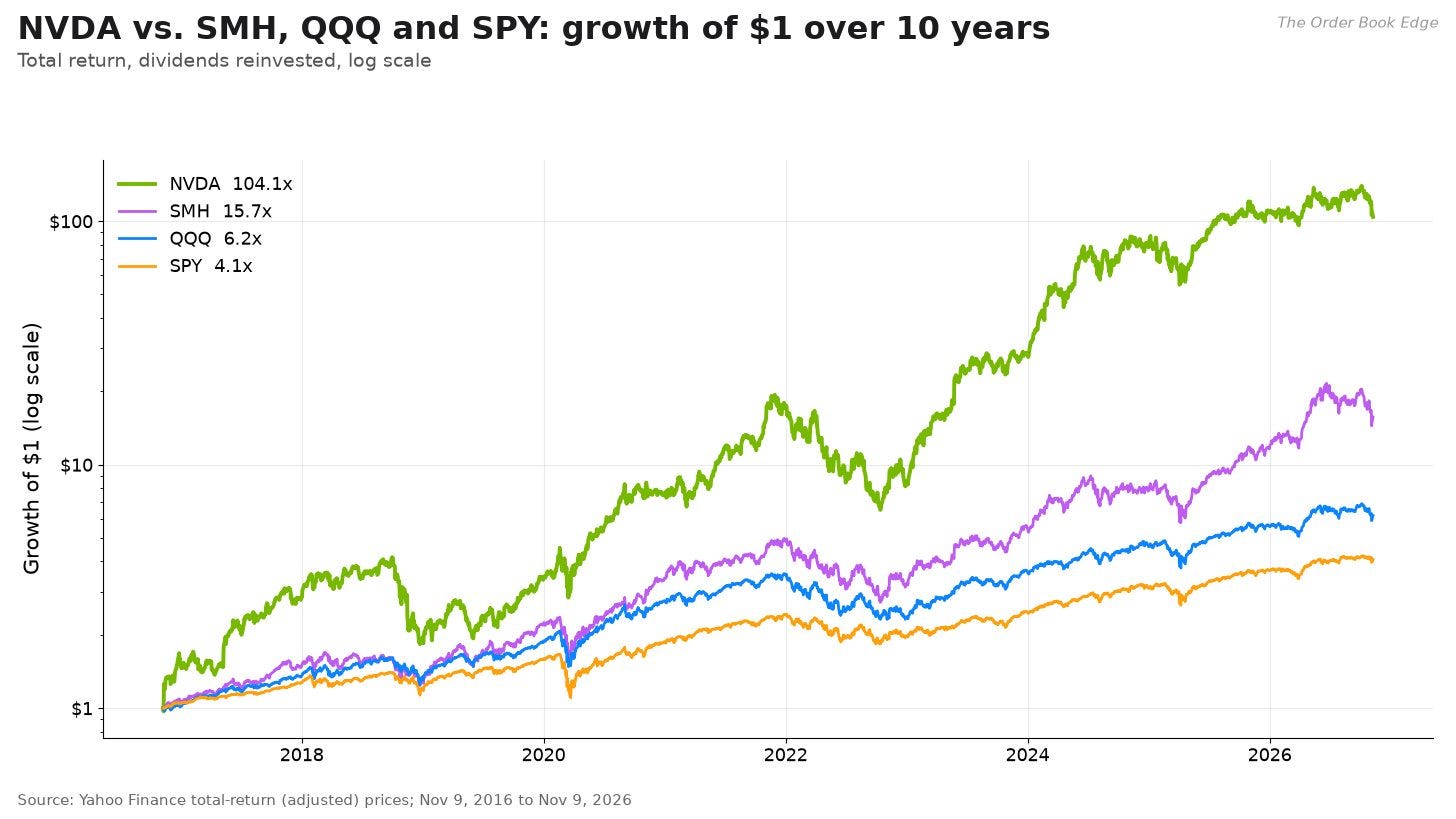
A dollar invested in NVDA ten years ago, with dividends reinvested, is worth about $104 today. The same dollar in SMH is worth about $15.7, in QQQ $6.2 and in SPY $4.1. Here are the numbers by window:
10 years: NVDA compounded at 59.1% a year with 50.2% volatility. SMH: 31.7% and 34.0%. QQQ: 20.0% and 22.8%. SPY: 15.1% and 18.0%.
5 years: NVDA 42.4% with 51.9% volatility. SMH 27.1% and 37.6%.
3 years: NVDA 56.3% with 47.1% volatility. SMH 48.4% and 38.4%.
1 year: NVDA −4.8% with 38.6% volatility. SMH +40.4% and 42.7%. SPY +13.5% and 13.7%.
The one-year line is the anomaly. For most of the past decade NVDA delivered more return per unit of risk than the chip index it leads. Over the past year it delivered less return with slightly less volatility.
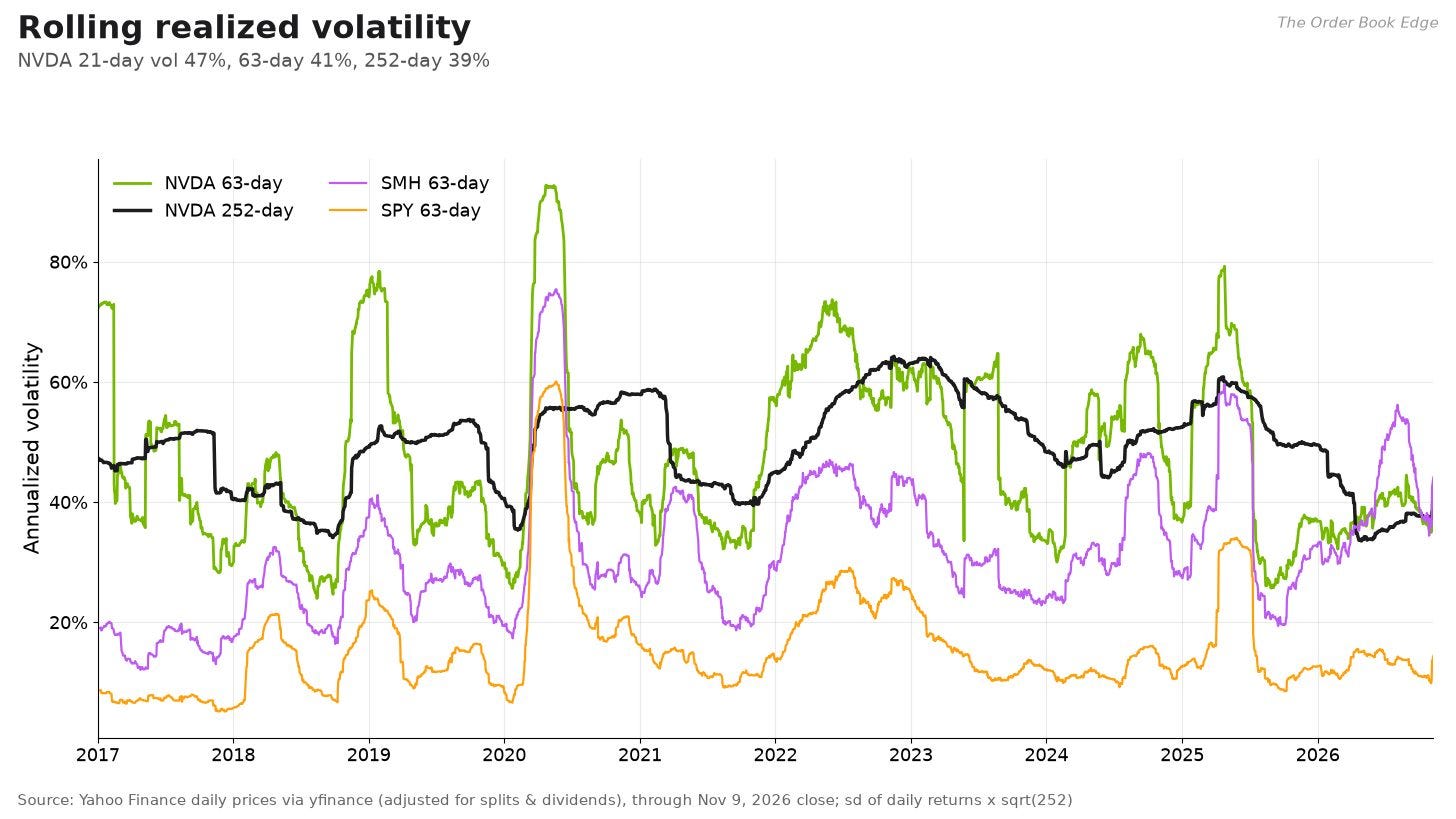
Volatility comes in waves. NVDA’s 63-day realized volatility has ranged from 24.0% to 92.7% over ten years, and the peak came on April 24, 2020. Today it is 40.5%, at the 41st percentile of its 10-year history, so it is not unusual by NVDA’s own standards. The 21-day reading, at 46.8%, shows that the past month has been rougher than the past quarter. NVDA’s volatility runs at about 2.5 to 3 times SPY’s, and it moves with SMH’s.
Risk-adjusted returns: Sharpe and Sortino
Raw returns ignore risk. The Sharpe ratio measures excess return per unit of total volatility, and the Sortino ratio counts only downside volatility:

μₐₙₙ is the annualized mean return, r_f is the annual risk-free rate (the 3-month Treasury bill), r_(f,d) is its daily equivalent, σₐₙₙ is annualized volatility, and σ_D is annualized downside deviation. Downside deviation only counts days when the return fell short of the risk-free rate. Sortino is the more relevant measure for a stock with a right-skewed distribution like NVDA’s, because big up days inflate Sharpe’s denominator without hurting the investor.
Over ten years NVDA’s Sharpe ratio is 1.13 and its Sortino ratio is 1.72. SMH’s are 0.91 and 1.30, QQQ’s 0.80 and 1.14, and SPY’s 0.73 and 1.02. Over five years, which include the 2022 drawdown, NVDA’s Sharpe is 0.86. Over three years it is 1.10, almost exactly SMH’s 1.11. Over one year it is −0.04, against 0.92 for SMH and 0.71 for SPY. Over long horizons, NVDA has paid investors well for its volatility. Over the past year it has not paid them at all.
Beta and CAPM
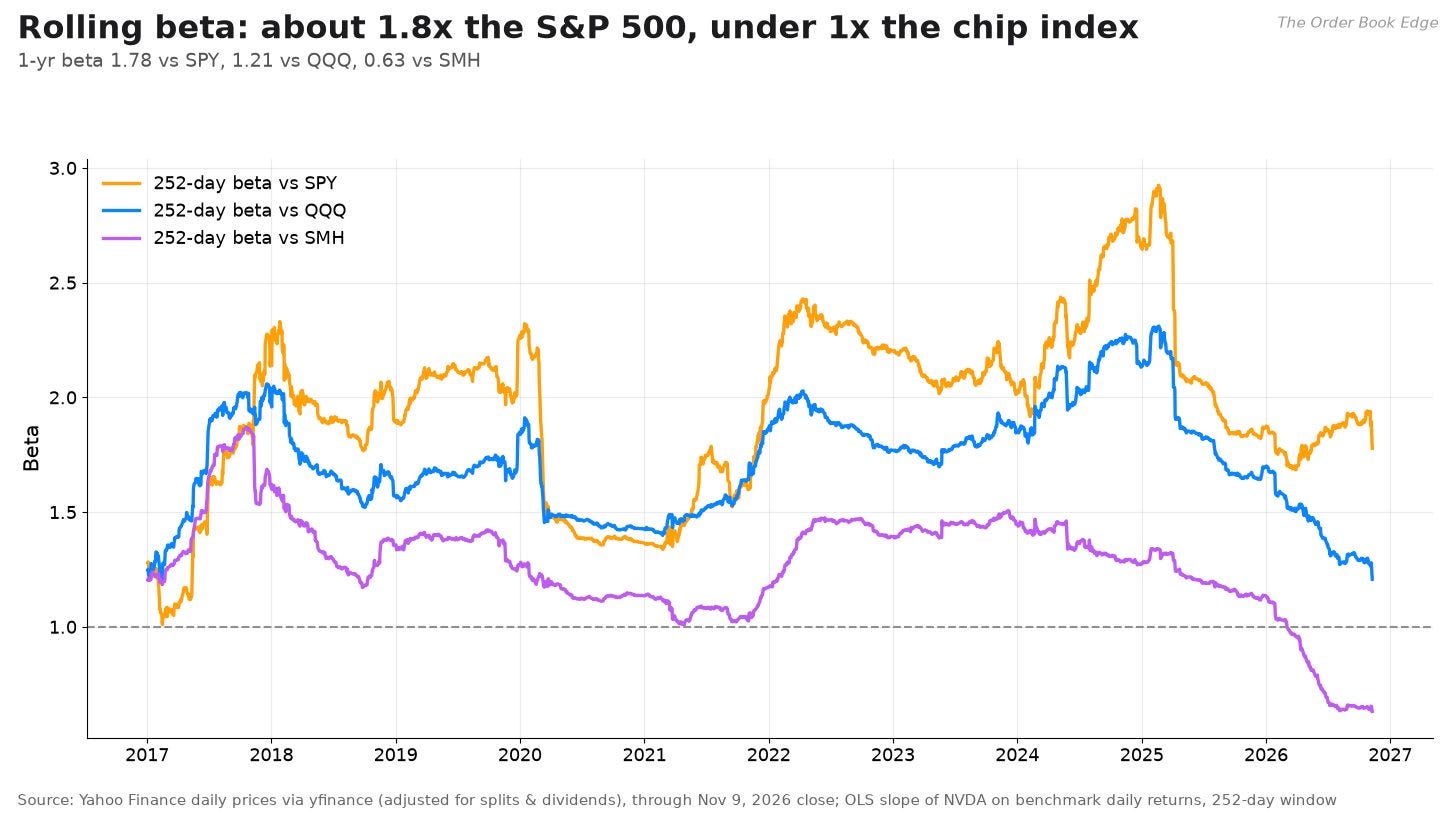
The capital asset pricing model (CAPM) relates a stock’s excess return to the market’s:

Rᵢ,ₜ is NVDA’s return on day t, Rₘ,ₜ is the benchmark’s return, r_(f,t) is the daily risk-free rate, αᵢ is the intercept (return not explained by the market), βᵢ is the sensitivity to the market, and εᵢ,ₜ is the residual. The estimate β̂ᵢ is the covariance of the two return series divided by the variance of the market. The regression’s R-squared measures how much of NVDA’s daily variance the market explains.
Against SPY, NVDA’s beta is 1.83 over ten years (R-squared 0.43), 2.12 over five years (0.50) and 1.78 over one year (0.40). Against QQQ it is 1.66, 1.74 and 1.21. Against SMH it is 1.18, 1.15 and 0.63. The one-year correlation with SPY is 0.63. Over the past decade, the rolling one-year beta to SPY has ranged from 1.01 to 2.92.
Two points matter. First, a beta of 1.8 means that a 10% market decline has historically been associated with an 18% NVDA decline, on average. Second, NVDA’s beta to the chip index has fallen to 0.63 over the past year, the lowest of the decade. For most of the AI era NVDA was the chip index. In the past year, other chip names, especially memory and equipment, drove SMH’s gains, and NVDA’s moves were partly its own.
The ten-year CAPM alpha against SPY is 32.5% a year with a t-statistic of 2.71. The five-year figure is 27.1% with a t-statistic of 1.64, which is not statistically significant at the usual 5% level. Alpha this large is not a forecast. It measures how far the stock outran what its market exposure alone would have delivered during a once-in-a-generation product cycle.
Fama-French factors
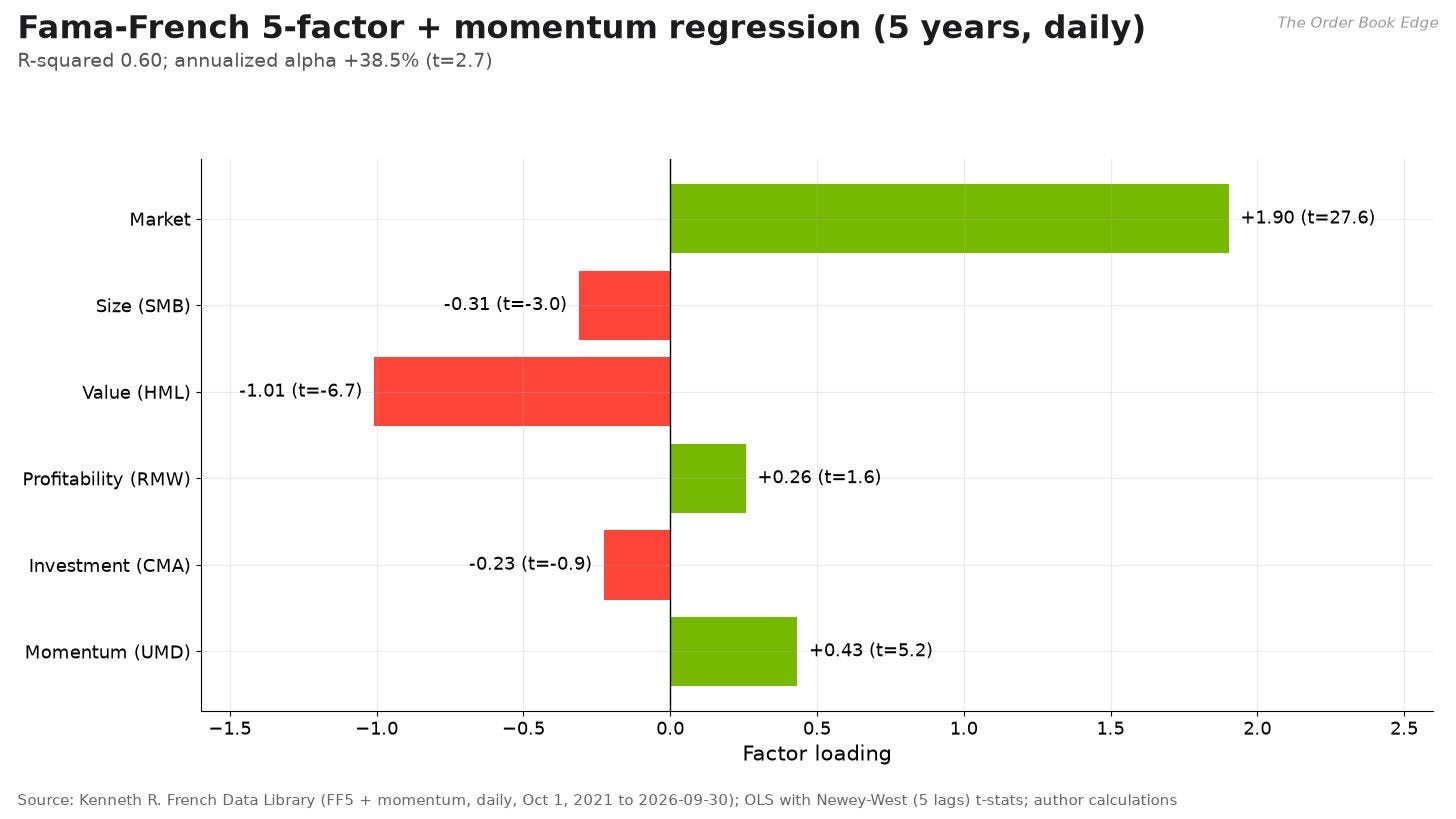
CAPM uses one factor. The Fama-French five-factor model adds size, value, profitability and investment, and I add momentum:

MKTₜ is the market’s excess return. SMBₜ (small minus big) is the return of small stocks minus large stocks. HMLₜ (high minus low) is the return of cheap stocks (high book-to-market) minus expensive stocks. RMWₜ (robust minus weak) is the return of profitable companies minus unprofitable ones. CMAₜ (conservative minus aggressive) is the return of companies that invest conservatively minus those that invest aggressively. UMDₜ (up minus down) is the momentum factor, the return of recent winners minus recent losers. The coefficients β_M, s, h, p, c, u are the stock’s loadings on each factor, and α is the return left over. I estimate the model with ordinary least squares on daily data from October 1, 2021 to September 30, 2026, using Newey-West standard errors with five lags to allow for autocorrelation and changing variance.
The results:
Market: 1.90 (t = 27.6). Very high market exposure.
Size: −0.31 (t = −3.0). NVDA behaves like a mega-cap, as expected.
Value: −1.01 (t = −6.7). A strong growth tilt. NVDA tends to do badly when cheap stocks outperform expensive ones.
Profitability: +0.26 (t = 1.6). Positive but not significant.
Investment: −0.23 (t = −0.9). Not significant.
Momentum: +0.43 (t = 5.2). A significant positive loading. NVDA does well when recent winners keep winning.
R-squared: 0.60. Alpha: 38.5% a year (t = 2.67).
For comparison, a three-factor model gives market 1.88, size −0.64 and value −0.92, and the CAPM over the same window gives a beta of 2.08 and alpha of 37.5% (t = 2.35). The practical point is that NVDA is a leveraged bet on three things at once: the market, growth over value, and momentum. When the market falls, growth lags value and momentum reverses, as happened in late 2021 and 2022, all three exposures hurt at once. Part of November 5 looked like that.
The shape of returns: fat tails
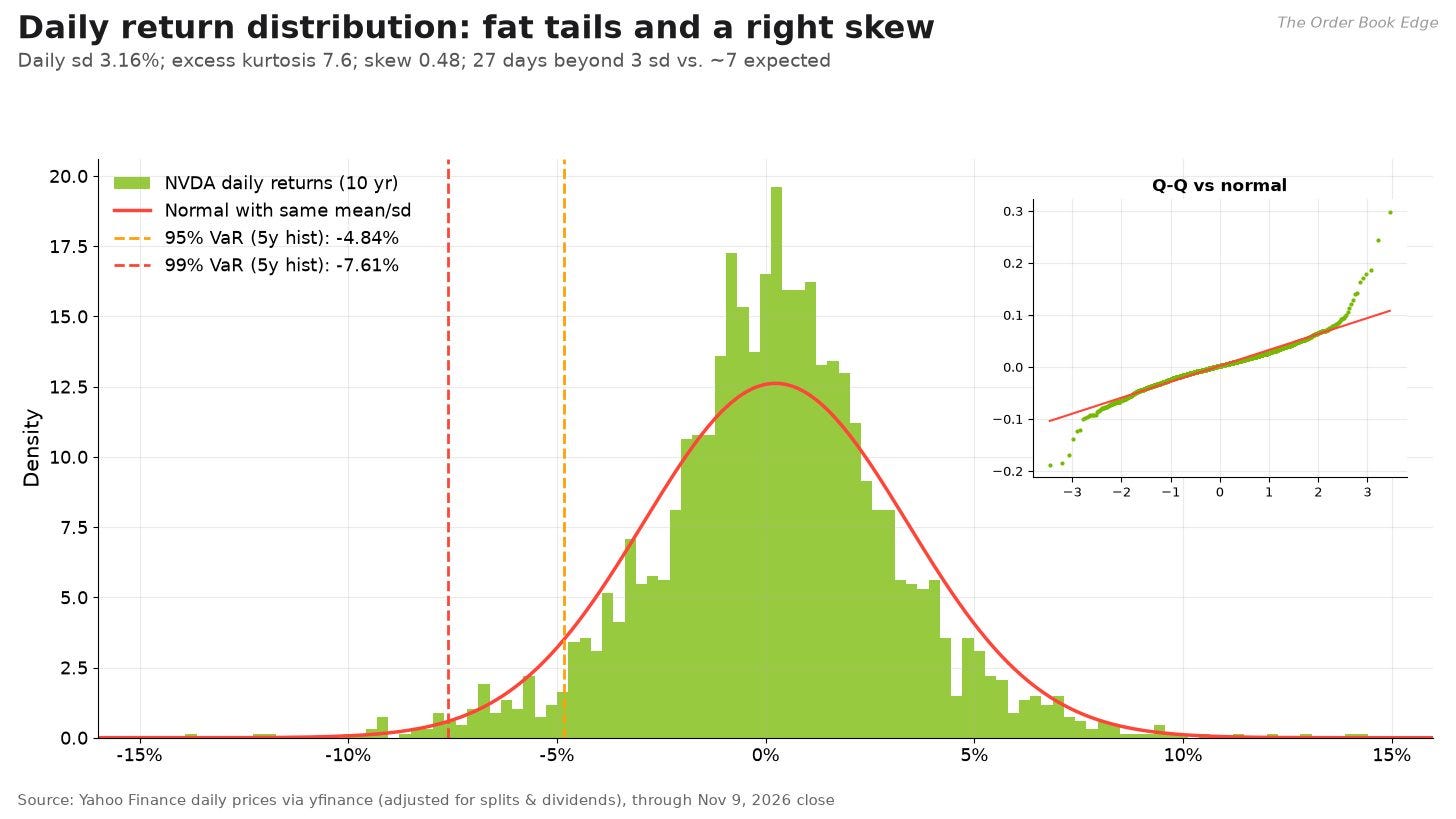
Over the past ten years (2,512 trading days), NVDA’s average daily return was 0.235% with a standard deviation of 3.16%. The distribution has positive skew of 0.48 and excess kurtosis of 7.57. A normal distribution has zero of both. The Jarque-Bera test statistic is about 6,099, which rejects normality decisively. There were 27 days with moves larger than three standard deviations; a normal distribution would predict about 6.8. The best day was +29.8% on November 11, 2016, after an earnings report. The worst was −18.8% on November 16, 2018, also after earnings. The stock rose on 53.9% of days.
The Q-Q plot in the inset makes the point visually. If returns were normal, the dots would sit on the red line. Instead, they bend away from it at both ends: extreme days are much more common than a bell curve implies. This matters for risk measures, as the next section shows.
Value at risk and expected shortfall
Value at risk (VaR) answers the question: on a bad day, how much might you lose? Conditional VaR (CVaR), also called expected shortfall, answers the follow-up: when you do hit a bad day, how bad is it on average?


α is the confidence level (95% or 99%), Q_(1−α)(R) is the (1−α) quantile of daily returns, μ_d and σ_d are the daily mean and standard deviation, z_(1−α) is the standard normal quantile (−1.645 at 95% and −2.326 at 99%), and E[· | ·] is the conditional expectation. The historical version reads the quantile directly from the data. The normal (”parametric”) version assumes a bell curve. The Cornish-Fisher version adjusts the normal quantile for skewness and kurtosis:

z is the normal quantile, S is skewness and K is excess kurtosis. The adjusted quantile replaces z in the normal VaR formula.
Over five years, NVDA’s one-day 95% historical VaR is 4.84%: on one trading day in twenty, the stock fell by more than that. The normal estimate is 5.18% and the Cornish-Fisher estimate is 4.38%. At 99%, historical VaR is 7.61%, the normal estimate 7.41% and Cornish-Fisher 9.34%. The 99% CVaR is 9.40% historically and 8.52% under a normal distribution. The pattern is typical for fat tails: the normal model is close enough at 95%, but it understates losses in the far tail. Over the past year, the 95% historical VaR is 4.15% and the 99% figure 5.23%. These are lower than the five-year figures, which is consistent with lower realized volatility. On November 5, the 9.3% drop was well beyond the one-year 99% VaR, and roughly at the five-year 99% CVaR.
Drawdowns
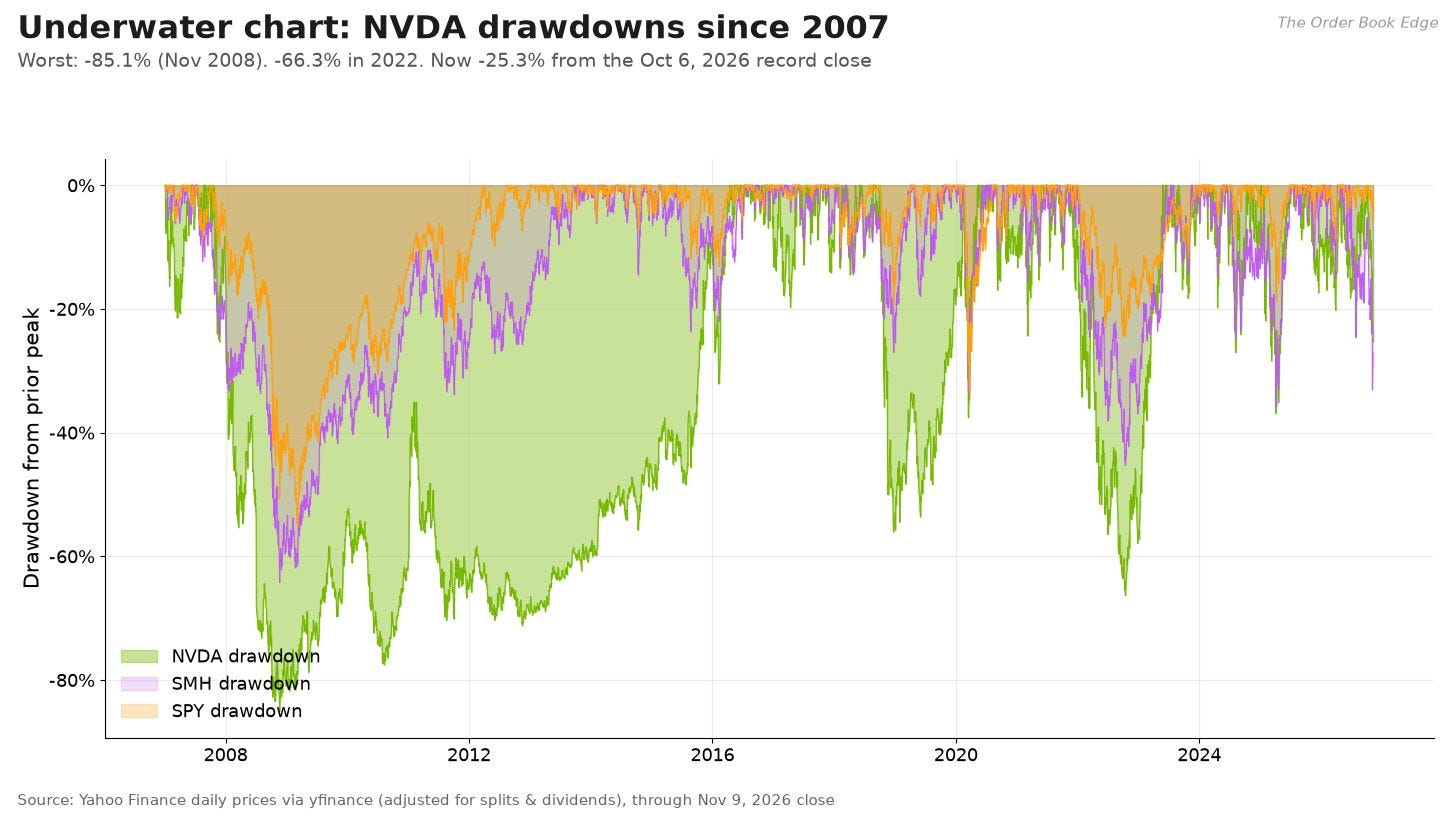
The drawdown on day t is the percentage decline from the highest price reached so far:

max_(s≤t) Pₛ is the running peak up to day t, and MDD (maximum drawdown) is the deepest drawdown in the sample. NVDA’s maximum drawdown since 2005 is −85.1%, reached on November 20, 2008. Since 2015, the major drawdowns have been:
−66.3%: peak November 29, 2021, trough October 14, 2022, recovered May 25, 2023.
−56.0%: peak October 1, 2018, trough December 24, 2018, recovered February 14, 2020.
−37.6%: peak February 19, 2020, trough March 16, 2020, recovered May 11, 2020.
−36.9%: peak January 6, 2025, trough April 4, 2025, recovered June 25, 2025.
−27.0%: peak June 18, 2024, trough August 7, 2024, recovered October 14, 2024.
−25.3%: peak October 6, 2026 (close), ongoing as of November 9, 2026.
A drawdown of 25% or more has happened six times since 2015, about once every two years. Recovery times ranged from two months (2020) to 16 months (2018 to 2020). The current drawdown is a normal event for NVDA. What happens next depends on whether it stays a correction like 2024 and early 2025, or turns into a cyclical bear market like 2018 or 2022. In both of those episodes, the drawdown was driven by a fall in earnings, not just in the multiple. Today, earnings are still rising.
Monte Carlo: a range of one-year outcomes
The last quant tool turns these statistics into a distribution of possible prices one year out. The standard model is geometric Brownian motion (GBM), in which the price follows the stochastic differential equation:

Sₜ is the stock price at time t, μ is the expected annual return (the drift), σ is annual volatility, dt is a small time step, and Wₜ is a standard Brownian motion (a random walk in continuous time) whose increments dWₜ are normally distributed with mean zero and variance dt. Applying Itô’s lemma to ln Sₜ gives the exact solution:

S₀ is today’s price, T is the horizon in years, and N(0, T) is a normal distribution with mean 0 and variance T. The −σ²/2 term is the volatility drag: for a given expected return, more volatility lowers the median outcome. With NVDA’s volatility, the drag is about 13 percentage points a year.
GBM assumes normal returns, and we have seen that NVDA’s returns are not normal. So I also run a block bootstrap. It samples 10-day blocks of actual historical returns, which preserves fat tails and short-term clustering, and recenters them so the drift matches the GBM drift:

rₜ is a historical daily log return from the past ten years, r̄ is their mean, σₕ² is their annualized variance, r̃ₜ is the recentered return, r̃⁽ʲ⁾ₖ is the k-th return drawn for simulated path j, and S⁽ʲ⁾_T is the simulated price one year out on that path.
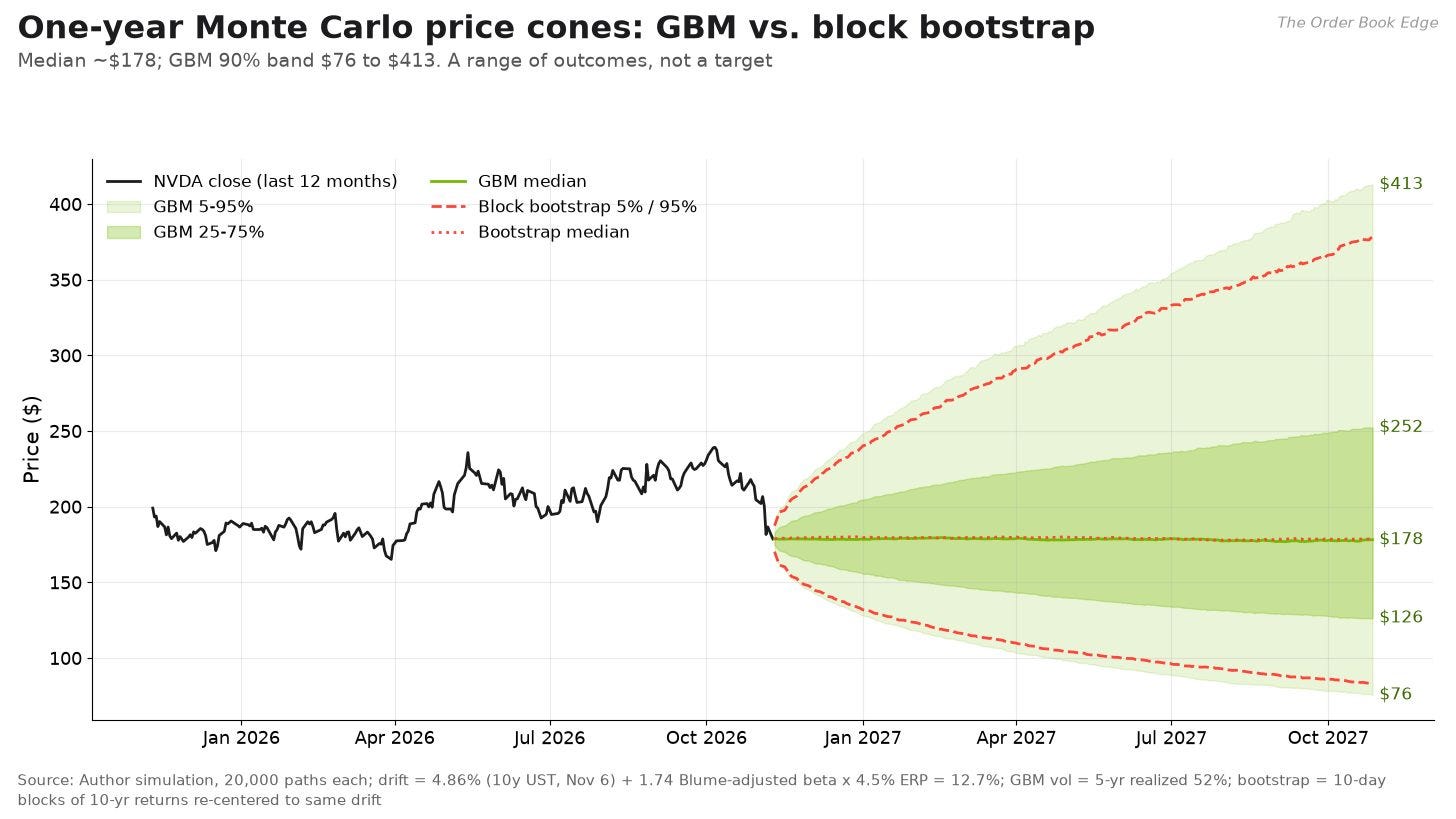
Simulation assumptions (the author’s): 20,000 paths for each method, 252 trading days, starting at $178.67. The drift is the CAPM cost of equity: 4.86% plus a Blume-adjusted beta of 1.74 times a 4.5% equity risk premium, or 12.7%. GBM volatility is the five-year realized volatility of 51.5%.
The results are wide. The GBM median one-year price is about $178, essentially today’s price, because the 12.7% drift is almost exactly cancelled by the volatility drag. The 25th to 75th percentile range is about $126 to $252, and the 5th to 95th percentile range is about $76 to $413. The bootstrap gives a slightly narrower band: a median of about $178, an interquartile range of about $131 to $243, and a 5th to 95th range of about $83 to $378. Under GBM, the chance of finishing the year above the October record close of $239.24 is about 28%, and under the bootstrap about 26%. The chance of finishing below $120 is about 22% and 19%. The chance of a further peak-to-trough decline of more than 30% at some point during the year is high in both models, about 85% under GBM and 77% under the bootstrap. That reflects NVDA’s volatility, not a forecast of a crash.
The point of this exercise is not the median. It is the width of the distribution. Even with a positive expected return, a stock with 50% volatility spends a lot of time far from where it started, in both directions. That has practical implications for position size.
Momentum, mean reversion and seasonality
Is NVDA’s short-term behavior predictable? Mostly not. The lag-1 autocorrelation of daily returns is −0.081, which points to mild day-to-day reversal. Lag 2 is +0.046 and lag 5 is +0.010. Weekly returns have an autocorrelation of +0.042 and monthly returns +0.076. Variance ratios, which compare the variance of multi-day returns with a scaled single-day variance, are 0.89 at 5 days, 0.86 at 21 days and 0.89 at 63 days. A variance ratio below 1 points to mild mean reversion. These effects are small and do not provide a trading edge on their own.
Momentum indicators tell a more useful story. Over the past ten years, when the 14-day RSI was below 30 (33 such days), NVDA’s average 20-day forward return was +0.07%, positive 55% of the time. When RSI was above 70 (320 days), the average was +6.0%, positive 73% of the time. Across all days, it was +4.6%, positive 65% of the time. For NVDA, strength has tended to lead to more strength, and oversold readings have not been reliable buy signals. The 12-month momentum excluding the latest month (the “12-1” measure) is +22.2% today, still positive despite the decline. Since 2006, after positive 12-1 momentum, the next month averaged +3.1% (190 months). After negative momentum it averaged +4.6% (60 months), a reminder that the strongest rebounds have often come out of deep drawdowns.
Seasonality over 2006 to 2025 is noisy. November has been one of the stronger months, with a mean return of +5.6%, a median of +6.5% and a positive result in 15 of 20 years. May (+7.9%, 75% positive), August (+7.5%, 80%) and February (+5.7%, 75%) have also been strong. September (+0.6%) and April (+0.8%) have been weak. Twenty observations per month are too few to support a strategy. I include them for context only.
Earnings reactions
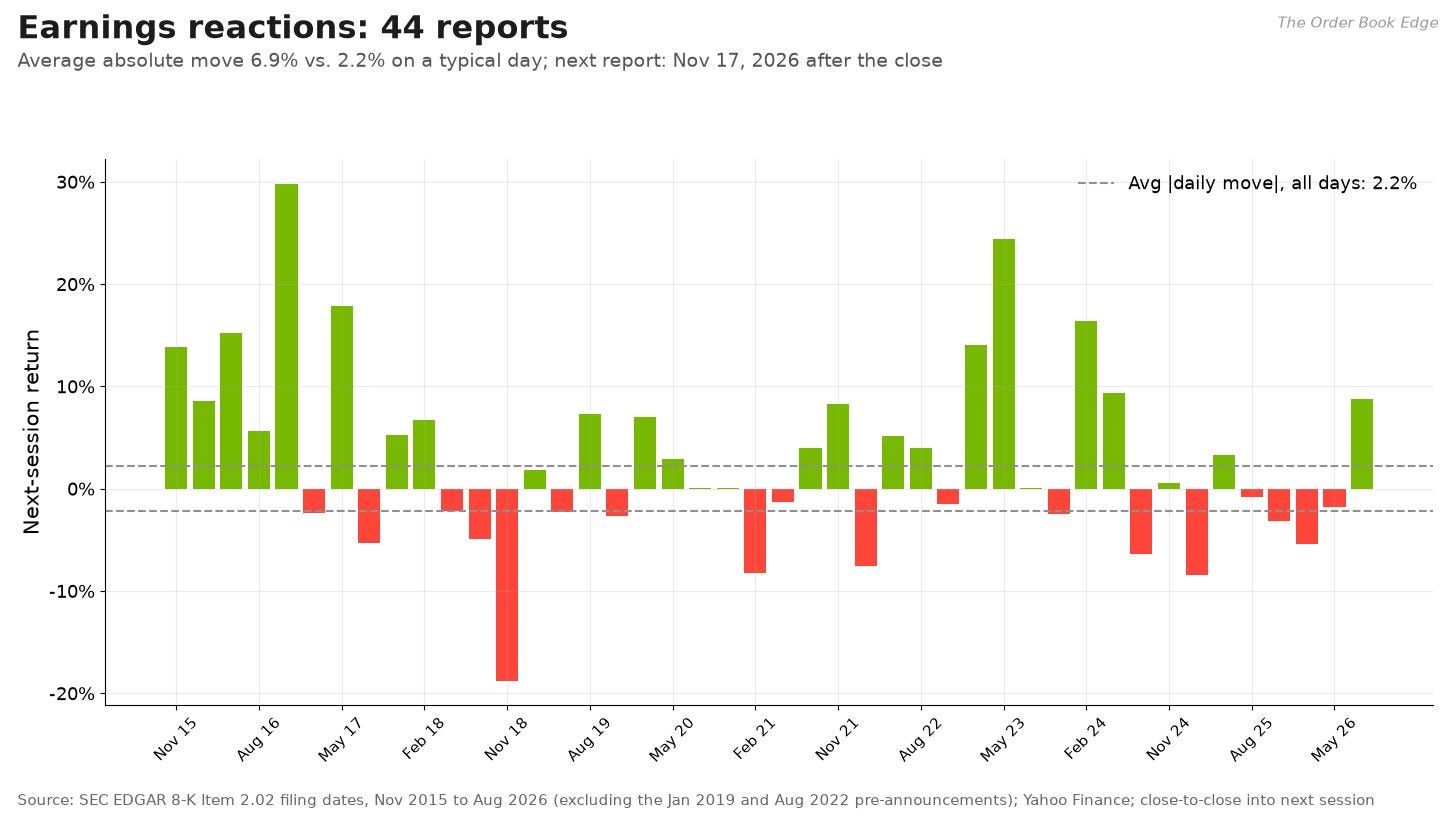
Using 8-K earnings filing dates from November 2015 to August 2026, I measured NVDA’s close-to-close return from the report date to the next session for 44 reports. I excluded two pre-announcements, in January 2019 and August 2022, because they came before the market opened. The average absolute move was 6.9%, and the median 5.3%, compared with an average absolute move of 2.2% on a typical day. The stock rose after 59% of reports, with an average return of +3.1%. The largest moves were +29.8% in November 2016, +24.4% in May 2023 and −18.8% in November 2018. The last eight reports produced smaller moves, averaging 4.0%, as NVDA’s size and analyst coverage grew. The most recent, on August 27, 2026, was +8.7%. Options Whale puts the options-implied move for November 17 at about 9.3%. That is a single source that I have not checked against option prices, so treat it as indicative only.
The technical view: trend, momentum and levels
Technical analysis does not tell you what a company is worth. It describes how the stock is trading: the trend, the strength of momentum, and the price zones where a lot of shares have changed hands. For a stock as widely held and heavily traded as NVDA, those zones can matter because so many participants watch the same levels.
Trend: moving averages and Bollinger bands
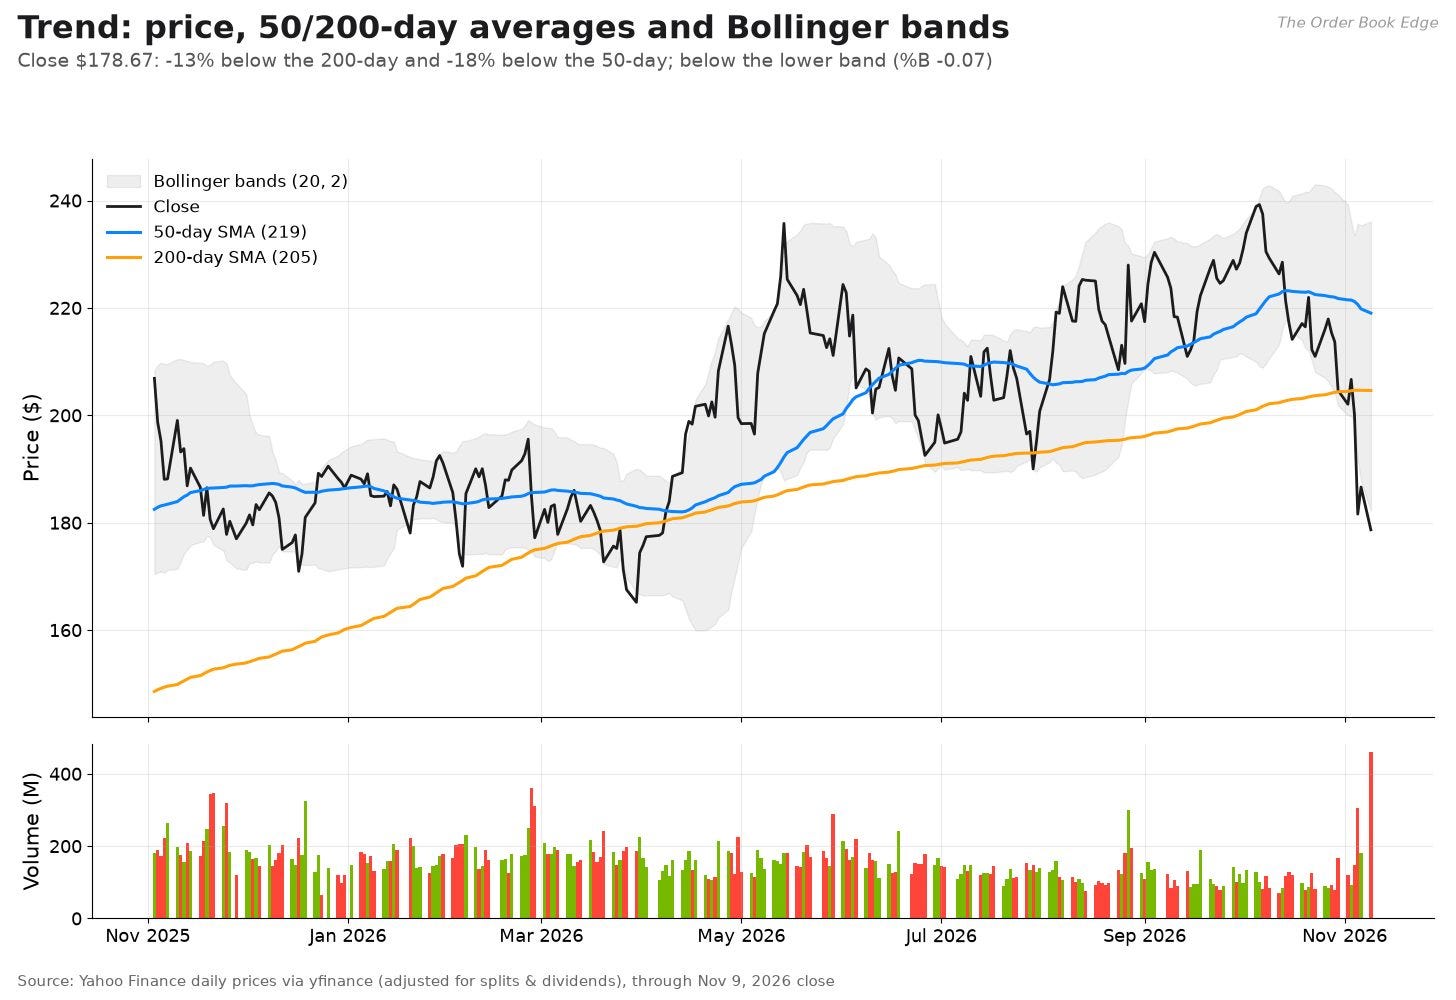
The simple moving average over n days and the Bollinger bands are defined as:

Pₜ is the closing price, SMAₙ(t) is the average of the last n closes, σ₂₀(t) is the standard deviation of the last 20 closes, BB⁺ₜ and BB⁻ₜ are the upper and lower bands, and %Bₜ shows where the price sits within the bands. A value of 0 means the price is on the lower band, 1 means it is on the upper band, and a negative value means it is below the lower band. Band width, the distance between the bands divided by the middle band, measures how volatile the recent period has been.
As of November 9:
50-day SMA: $219.04. The close of $178.67 is 18.4% below it.
200-day SMA: $204.63, still rising (+1.1% over the past 20 sessions). The close is 12.7% below it.
Crosses: The latest signal is a “golden cross” on June 27, 2025, when the 50-day moved above the 200-day. It is still in effect, because the 50-day is still about 7% above the 200-day. Earlier signals were a death cross on March 20, 2025, a golden cross on January 24, 2023, a death cross on April 20, 2022, a golden cross on August 22, 2019 and a death cross on November 13, 2018. If the price stays near current levels, the 50-day will keep falling toward the 200-day, so a new death cross is possible in the coming weeks.
Bollinger bands: upper $236.09, middle $209.16, lower $182.24. The close is below the lower band, with %B at −0.07. Band width is 25.7%, at the 97th percentile of the past year, which means the recent move has been unusually volatile.
The trend has turned down in the short term, but the long-term trend has not yet broken. The slope of the 200-day average is the best way to tell a correction from a bear market in NVDA’s history. In the 2024 correction, the 200-day kept rising the whole time. In the early-2025 drawdown, it dipped only slightly, falling by at most 1.8% over any 20-session stretch, and rose again within weeks. In 2018 and 2022, by contrast, it fell for about 200 sessions in each episode, at times by 6% to 8% over 20 sessions, and those declines lasted far longer. Today the 200-day is still rising, slowly.
Momentum: RSI and MACD
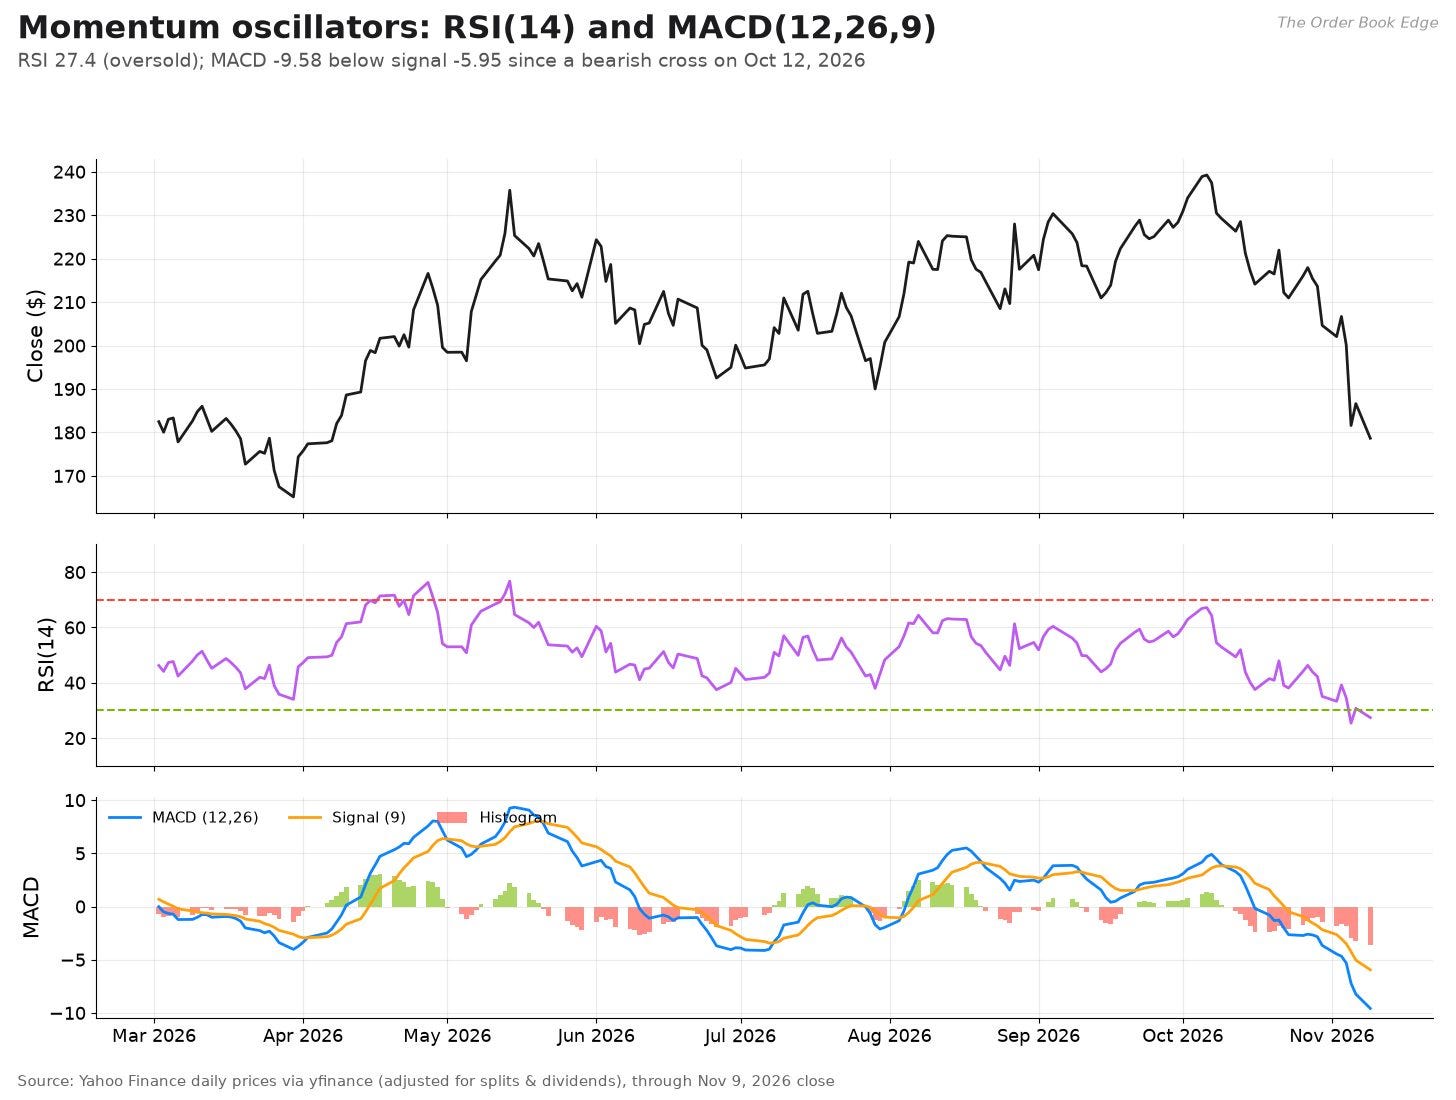
The relative strength index (RSI) and the moving average convergence divergence indicator (MACD) are defined as:


Ūₜ and D̄ₜ are Wilder’s smoothed averages of daily up moves and down moves over 14 days (an exponential average with weight 1/14). RSₜ is their ratio. EMAₙ is an exponential moving average over n periods with smoothing weight λ. The MACD is the gap between a fast and a slow average of the price. The signal line is a 9-day average of the MACD, and the histogram is MACD minus signal. RSI above 70 is conventionally called overbought, and below 30 oversold.
NVDA’s RSI is 27.4, in oversold territory. The MACD is −9.58 against a signal line of −5.95, so the histogram is −3.63. The MACD crossed below its signal on October 12, 2026, less than a week after the record close, and it has stayed below since. Both indicators confirm the strength of the decline. As shown in the quant section, though, an oversold RSI has not been a reliable timing signal for NVDA. Over the past ten years, 20-day returns after RSI readings below 30 were roughly flat on average. The stock’s best periods began from strength, not from oversold conditions. A bullish MACD crossover, or a recovery of RSI above 50, would be a more meaningful sign that the decline has run its course.
Volume
On-balance volume (OBV), which adds a day’s volume when the stock closes up and subtracts it when the stock closes down, fell by about 973 million shares over the past 63 sessions and by about 292 million over the past year. That points to net distribution, meaning more volume on down days than on up days. The 20-day average volume is 137.1 million shares, below the one-year average of 156.5 million. Most of the selling has been concentrated in a few very heavy sessions rather than spread evenly. About 306 million shares traded on November 5, and about 459 million on November 9, the first session after the board’s statement. That was roughly three times the one-year average and the heaviest day in the chart. That is consistent with a sentiment shock rather than a steady exodus.
Relative strength
Relative strength (RS) compares NVDA with a benchmark by dividing one price series by the other:
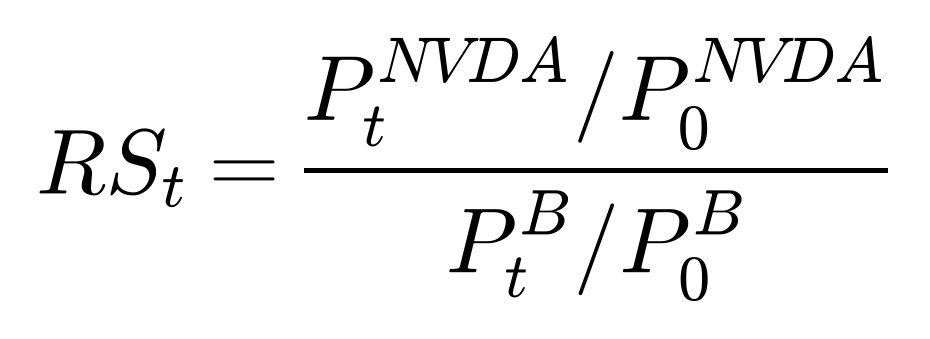
P^(NVDA)ₜ and P^Bₜ are the adjusted prices of NVDA and the benchmark B, and the subscript 0 marks the start date, so the ratio starts at 1. A rising line means NVDA is outperforming.
Against SPY, NVDA’s relative performance was −16.0% over three months, −20.2% over six months and −16.1% over one year. Against QQQ it was −13.1%, −14.5% and −14.7%. Against the chip ETFs the picture splits by horizon. Over three and six months, NVDA has roughly kept pace with SMH (−3.3% and −3.5%) and SOXX (−0.3% and −1.4%). Over one year it has lagged badly: −31.6% against SMH and −35.9% against SOXX. Most of NVDA’s underperformance against its sector happened in late 2025 and early 2026, as other chip names rallied. In the recent sell-off it has fallen about as much as the sector. NVDA lost its market leadership a year ago. The past month was a sector-wide event.
Support and resistance
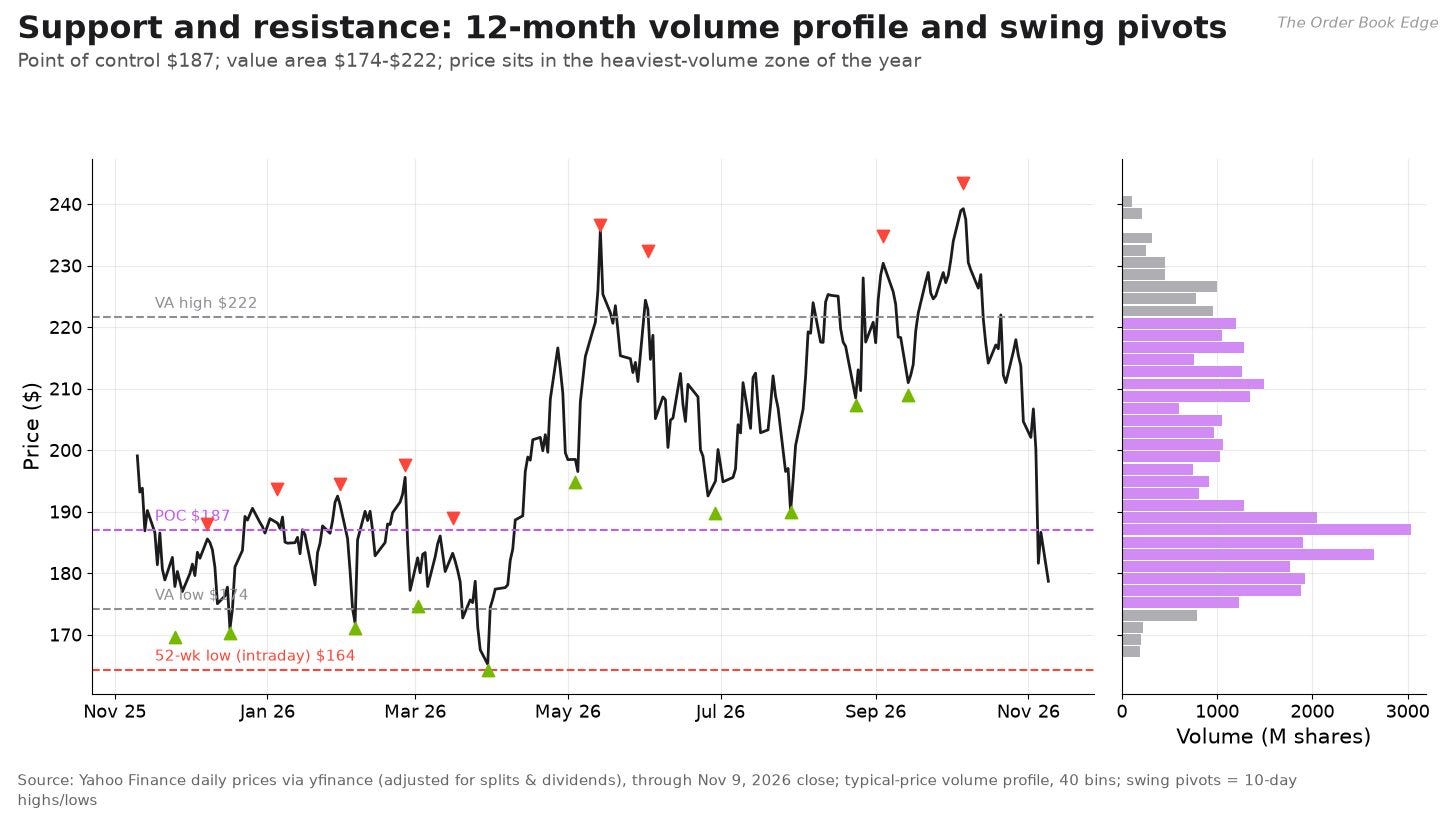
The volume profile shows how many shares traded at each price over the past year. The point of control, the price with the most volume, is about $187. The value area, which contains about 70% of the year’s volume, runs from about $174 to $222. The heaviest volume nodes are clustered between about $179 and $189, which is where the stock trades now. A lot of shares changed hands here, so buyers and sellers have a reference price in this range.
Using the volume profile and recent swing points (10-day highs and lows), the main levels are:
Support: the lower edge of the value area near $174, then the 52-week intraday low of $164.27 from March 30, 2026. A close below the March low would mark a new 52-week low and a break of the year’s trading range.
First resistance: the $187 to $190 area, which includes the point of control and the late-June and late-July swing lows ($189.80 and $190.01).
Higher resistance: the 200-day average near $205 and the August and September swing lows near $207 to $209. Above that, the 50-day average near $219.
Major resistance: the swing highs of $232 to $237 from May, June and September, and the record intraday high of $243.37 from October 6.
Shares traded lower again in early trading on November 10, the day this was written. I base all levels in this article on the November 9 close and do not analyze intraday prices.
Lessons from the 2018 and 2022 drawdowns
NVDA’s two deepest drawdowns since 2015 are the most useful comparisons, because both began as sentiment shocks and became fundamental ones. Each followed a similar sequence.
In 2018, revenue had been flat at about $3.1 billion to $3.2 billion a quarter for three quarters while gross margin slipped from 64.5% to 60.4%. Then the January 2019 quarter came in at $2.2 billion, a 31% sequential drop, as a glut of gaming cards built for cryptocurrency mining had to be cleared. Gross margin fell to 54.7%. The stock bottomed on December 24, 2018, a month before the company cut its guidance and two months before it reported the worst quarter.
In 2022, revenue peaked at $8.3 billion in the April quarter. Gross margin then collapsed to 43.5% in the July quarter on inventory charges, and revenue fell to $5.9 billion by the October quarter, down 28% from the peak. U.S. export restrictions on advanced chips to China arrived in the same period. The stock bottomed on October 14, 2022, two weeks before the trough quarter ended.
Three lessons follow. First, in both cases gross margin and inventory warned before revenue did. Second, both downturns hit earnings, not only the multiple: fiscal 2023 net income fell 55%. Third, the stock bottomed around the worst quarter, not after the recovery showed up in the numbers. The market looked ahead in both directions.
Today, the warning signs are mixed. Gross margin is holding at 75%, and guidance calls for 74%, nothing like the drops that came before the last two downturns. Inventory and receivables, though, are rising quickly, and supply commitments have more than doubled in a quarter. The data that would separate a correction from a cyclical downturn will come in the next one or two reports, in gross margin, inventory and receivables more than in revenue.
Putting it together
Scorecard
Here is how the three lenses line up:
Fundamentals: strong. Revenue is growing about 100% a year at a 75% gross margin, with record free cash flow, net cash and a management outlook of about 70% growth next year. The caveats are customer concentration, rising receivables and inventory, $279 billion of supply commitments, a $105 billion lease guarantee and nearly $94 billion of equity stakes in the AI ecosystem.
Valuation: cheap on multiples, demanding on cash flow. The P/E of 22.5 is a 10-year low and the run-rate P/E is about 18.5. But the reverse DCF still requires about 20% annual cash-flow growth for five years at an 11% discount rate, on a base of about $120 billion.
Quant: high risk, high historical reward. Beta 1.8, volatility around 40% to 50%, fat tails, and a history of drawdowns of 25% or more about once every two years. Long-run risk-adjusted returns are excellent. The one-year Sharpe is negative.
Technicals: weak in the short term, intact in the long term. Price is below both major averages, momentum is negative and RSI is oversold. The 200-day average is still rising, and the stock is sitting in its heaviest-volume zone of the year.
The bull case
The AI build-out is still accelerating. Hyperscaler spending is planned to grow from about $800 billion to about $1.3 trillion next year, according to management. Supply, not demand, is the constraint through fiscal 2028. Vera Rubin raises revenue per gigawatt by 60%. NVIDIA controls the supply chain through commitments its rivals cannot match. On this view, the stock fell for reasons unrelated to the business: politics, a sector-wide de-risking and a headline about the CEO. Meanwhile earnings kept compounding, which pulled the P/E down to a decade low. If the next two years look like the last two, today’s price will look cheap in hindsight. The bull DCF puts value at about $330.
The bear case
The AI build-out is a capital-spending cycle, and capital-spending cycles end. NVIDIA’s margins are far above anything the semiconductor industry has sustained, and the largest customers are building their own chips specifically to reduce what they pay NVIDIA. Receivables and inventory are rising faster than revenue. The company is now guaranteeing customer leases and holding large equity stakes in customers, which ties its results to their access to capital. China is effectively closed. On this view, the P/E is low because the market expects earnings to peak, as it does with other cyclical businesses at the top. The bear DCF puts value at about $62.
The base case
My base case sits in between. Growth stays strong for a few years and slows as the industry matures. The base DCF gives about $159, about 11% below the price, with a wide sensitivity range of roughly $104 to $256 depending on the discount rate and terminal growth. Put simply: at $178.67, NVDA is priced for a cycle that lasts several more years, not one that ends soon. That is a reasonable bet, but it is not a margin of safety.
What to watch
November 17 earnings. The guide is $108 billion of revenue at a 74% gross margin. More important than the headline figures will be the January-quarter guide, the size of the Rubin ramp, any update to the fiscal 2028 outlook, and the trend in receivables, inventory and supply commitments.
The board investigation. Any findings, any change to leadership responsibilities, or any regulatory response.
Hyperscaler capex. Spending plans for 2027 from the largest cloud companies, and whether they shift spending from NVIDIA systems toward custom chips.
China. Whether Beijing approves the H200s waiting in Hong Kong, and whether U.S. policy changes again.
Technical levels. Holding the $174 to $187 zone, recovering the 200-day near $205, a possible death cross, and the March low of $164.27.
A note on risk
The quant section showed that drawdowns of 25% or more happen about every two years, and the Monte Carlo cones showed how wide a one-year range is for a stock with 50% volatility. Whatever your view, position size matters more than entry price for a stock like this. A position you can hold through a 40% decline is one you can still own when the thesis plays out. A position you would be forced to sell after a 40% decline is a bet on timing.
Sources and method notes
Primary sources:
NVIDIA SEC filings (CIK 0001045810): EDGAR filing index; XBRL company facts; Form 10-K for fiscal 2026 (filed February 25, 2026); Form 10-Q for Q2 fiscal 2027 (filed August 26, 2026); Q2 fiscal 2027 press release and CFO commentary (Form 8-K, August 26, 2026); and the fiscal 2018, 2020 and 2023 10-Ks for older market-platform revenue.
NVIDIA investor relations: Board statement, November 8, 2026; Q3 fiscal 2027 conference call announcement; Q2 fiscal 2027 earnings call transcript.
Market data: daily prices from Yahoo Finance via yfinance, through November 9, 2026. Treasury yields from FRED DGS10 and FRED DGS3MO, as of November 6, 2026. Factors from the Kenneth R. French Data Library, through September 30, 2026.
Policy: Federal Register, January 15, 2026 (BIS license review policy).
News and commentary: CNBC, November 5; The Herald Business; etf.net; CNBC, November 9; NBC News; NPR; CNBC, January 14; Reuters via Investing.com on H200 stockpiles; Reuters via Investing.com on IDC China share data; Yahoo Finance on Google TPUs; TrendForce; Tom’s Hardware; MarketBeat; Options Whale.
Method notes:
Returns are total returns calculated from adjusted closes. Technical indicators use regular closes. Rolling windows are measured in trading days.
Sharpe and Sortino ratios use the 3-month Treasury bill yield as the risk-free rate. Regressions use ordinary least squares, and the factor regression uses Newey-West standard errors with five lags.
Quarterly figures for each fiscal fourth quarter are the full year minus the first nine months. Trailing P/E history uses TTM net income from SEC filings and the share count on each filing’s cover page, adjusted for the 2021 and 2024 splits.
“Core” earnings exclude my estimate of after-tax gains on equity securities, using a 16.5% tax rate. This is not a company-reported measure.
The DCF, reverse DCF, path scenarios, discount rates, equity risk premium and Monte Carlo drift are the author’s assumptions, stated in full where they are used.
Earnings dates are 8-K Item 2.02 filing dates. The January 2019 and August 2022 pre-announcements are excluded.
Not independently verified: MarketBeat’s consensus figures and average target, the Options Whale implied move, the IDC market-share figures reported by Reuters, and management’s statements about hyperscaler capex, cloud backlog and revenue per gigawatt. The board investigation is ongoing. October-quarter results had not been reported at the time of writing. The mapping of the old Gaming, Professional Visualization and Automotive lines into the new Edge Computing category is my reading of the new disclosures.
Final word
NVIDIA is one of the most profitable businesses ever built, and it is still growing at a pace that would be remarkable for a company one-hundredth its size. The stock is down a quarter from its peak, and on trailing earnings it is cheaper than at any point in the past decade. The quant work describes a volatile, fat-tailed, high-beta stock that has rewarded patient holders over long periods and punished them sharply along the way. The technical picture is a sharp short-term downtrend inside a long-term uptrend that has not yet broken. The fundamental work says the price does not require heroics in the next year or two. It requires the AI spending cycle to last well beyond that.
That is the real question for NVDA, and no single quarter will answer it. The November 17 report will add one more data point.
If you found this useful, subscribing is free.
Disclaimer: This article is for informational and educational purposes only and is not investment, financial, tax or legal advice, or a recommendation to buy, sell or hold any security. The author may or may not hold positions in the securities discussed. Models, scenarios and simulations rest on the author’s assumptions and historical data, which do not guarantee future results. Do your own research and consider consulting a licensed financial professional before making investment decisions.