


Important disclaimer. Every trade in this article is a simulated (paper) trade. The bots ran on live CME/CBOT market data delivered through a Rithmic gateway, but no orders reached an exchange and no money was at risk. Simulated fills are not real fills. This article is research and education, not financial advice, and nothing here is a recommendation to buy or sell any futures contract. Futures are leveraged, and you can lose more than your initial margin. Past simulated performance does not predict future results.
The short version
On Monday I took a snapshot of my local Bot Console, the dashboard that supervises a fleet of 90 automated futures bots. Then I pulled every simulated trade those bots closed during the session straight from their raw log files. Here is what the day looked like once the numbers were cleaned up:
90 bot instances were running. 22 of them closed at least one trade today, and the other 68 stayed flat or held positions without closing them.
14 instances finished green and 8 finished red. I count a bot as a “winner” if its net P&L for the day is above zero.
Across the whole fleet there were 43 closed trades: 22 wins and 21 losses. That’s a fleet win rate of 51%, and with this sample size the 95% confidence interval runs from about 37% to 65%. In other words, it’s a coin flip.
The 14 winners together made about +$7,251 (contract-multiplier estimate) on 28 trades, going 19 wins to 9 losses. Their combined profit factor was about 39, and their combined intraday max drawdown was only $94.
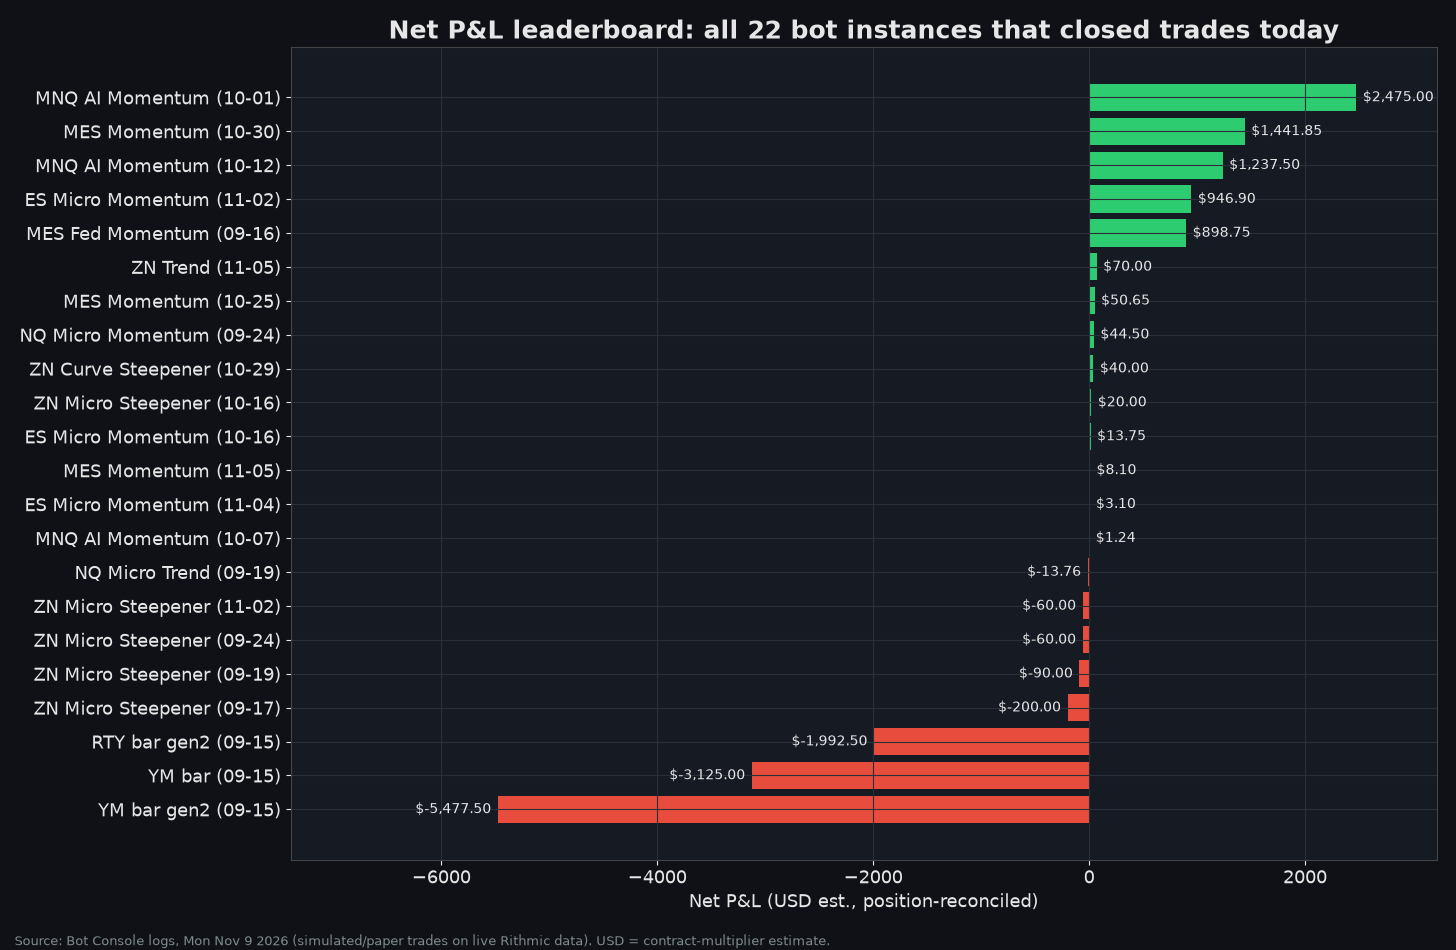
The 8 losers together lost about -$11,019, and almost all of it came from three short-biased “bar” bots on the Dow (YM) and Russell (RTY) that were positioned against a very strong rally.
97.6% of the winners’ profit came from six profit-target exits in a nine-minute window between 12:05 and 12:14 ET. Every one of those was a micro S&P (MES) or micro Nasdaq (MNQ) long opened at 09:30 ET.
The market context: the S&P 500 rose 2.41% and the Nasdaq Composite 2.67%, the S&P’s biggest one-day gain since April. Oil fell about 4%, chips rebounded more than 6%, and the 10-year Treasury yield barely moved ahead of Tuesday’s CPI report.
So the honest headline is that long-biased equity-index momentum bots were in the right place on a big risk-on rebound, and everything else either scratched or got run over. The rest of this article backs that up bot by bot and metric by metric. It also covers four bookkeeping problems in the raw console numbers that would have made the day look roughly six times better than it really was if I had taken them at face value.
What this article covers
The leaderboard: every instance that closed trades, with wins, losses, win/loss ratio and net P&L
Data integrity: how the console’s raw P&L numbers were rebuilt, and why that matters
What drove today’s profit: macro, cross-asset, and the market microstructure of the session
A portfolio-level view: P&L by contract, by direction, by exit type, and the distribution of trade outcomes
A deep dive on each of the 14 winners using standard portfolio metrics
Equity curves, drawdowns and a metrics heatmap
The bots that won more trades than they lost but still finished red
Every metric explained, with formulas and Python you can copy
Small-sample statistics: why one day proves very little, plus a bootstrap you can run
Engineering lessons for anyone running their own simulated fleet
What to watch on Tuesday
A note on what I won’t cover. The entry and exit logic, parameters, thresholds and code of these bots are proprietary. When I describe a strategy I describe it at the conceptual level only, for example “a long-biased intraday momentum model on micro S&P futures.” Exit-reason labels such as target_1R or time_exit are shown because they are generic risk-management categories, not trading rules.
The leaderboard
The table below lists all 22 instances that closed at least one trade on Monday, sorted by net P&L. The fleet often runs several copies of the same strategy family, each generated on a different date and kept in its own dated folder, so instances are labelled by strategy family plus that folder date (for example, MNQ AI Momentum (10-01)).
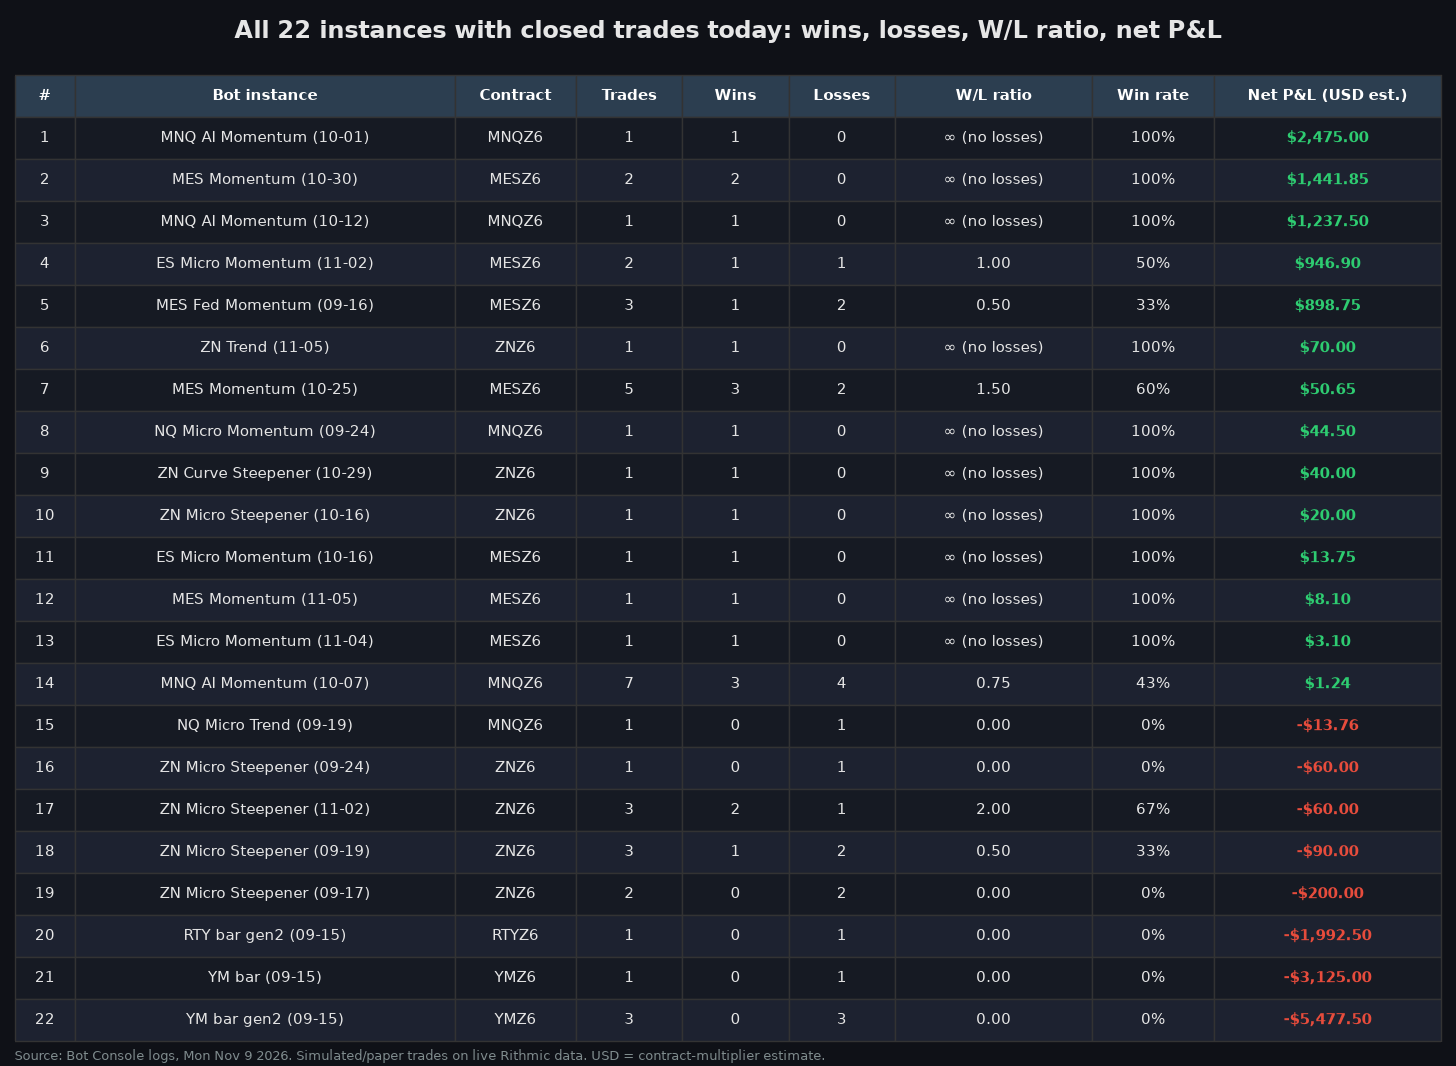
How to read the columns:
Trades counts closed trades, meaning exits logged today. The console’s own “trades” counter appears to count entries and exits together. For example, it showed 14 for MNQ AI Momentum (10-07), while the log contains 7 exits.
W/L ratio is wins ÷ losses. If a bot had no losses, the ratio is shown as “∞ (no losses)” rather than a misleading number.
Net P&L (USD est.) is the price-point P&L multiplied by each contract’s dollar multiplier, after the corrections explained in the data-integrity section. The multipliers are MES $5/pt, MNQ $2/pt, YM $5/pt, RTY $50/pt and ZN $1,000/pt.
Here are the 14 winners again with just the requested columns:
RankWinning bot instanceContractWinsLossesW/L ratioNet P&L (USD est.)1MNQ AI Momentum (10-01)MNQZ610∞ (no losses)$2,475.002MES Momentum (10-30)MESZ620∞ (no losses)$1,441.853MNQ AI Momentum (10-12)MNQZ610∞ (no losses)$1,237.504ES Micro Momentum (11-02)MESZ6111.00$946.905MES Fed Momentum (09-16)MESZ6120.50$898.756ZN Trend (11-05)ZNZ610∞ (no losses)$70.007MES Momentum (10-25)MESZ6321.50$50.658NQ Micro Momentum (09-24)MNQZ610∞ (no losses)$44.509ZN Curve Steepener (10-29)ZNZ610∞ (no losses)$40.0010ZN Micro Steepener (10-16)ZNZ610∞ (no losses)$20.0011ES Micro Momentum (10-16)MESZ610∞ (no losses)$13.7512MES Momentum (11-05)MESZ610∞ (no losses)$8.1013ES Micro Momentum (11-04)MESZ610∞ (no losses)$3.1014MNQ AI Momentum (10-07)MNQZ6340.75$1.24
(Substack flattens HTML tables, so the same data is also included above as an image.)
Three things stand out right away.
First, the leaderboard is extremely top-heavy. The top five instances made $7,000.00 between them, which is 96.5% of all winner profit. The other nine winners made $251.34 combined. Most of the “winners” are scratch trades that happened to close a few ticks positive.
Second, a high win/loss ratio didn’t predict a high P&L. Two of the top five winners had more losses than wins: ES Micro Momentum (11-02) went 1–1 and MES Fed Momentum (09-16) went 1–2. They still made nearly $900 each because one large winner covered several small losers. That’s the payoff ratio at work, and it’s covered in detail below.
Third, every top-five winner was long equity-index futures. None of the rates bots made more than $70, and no short trade appears anywhere in the top five.
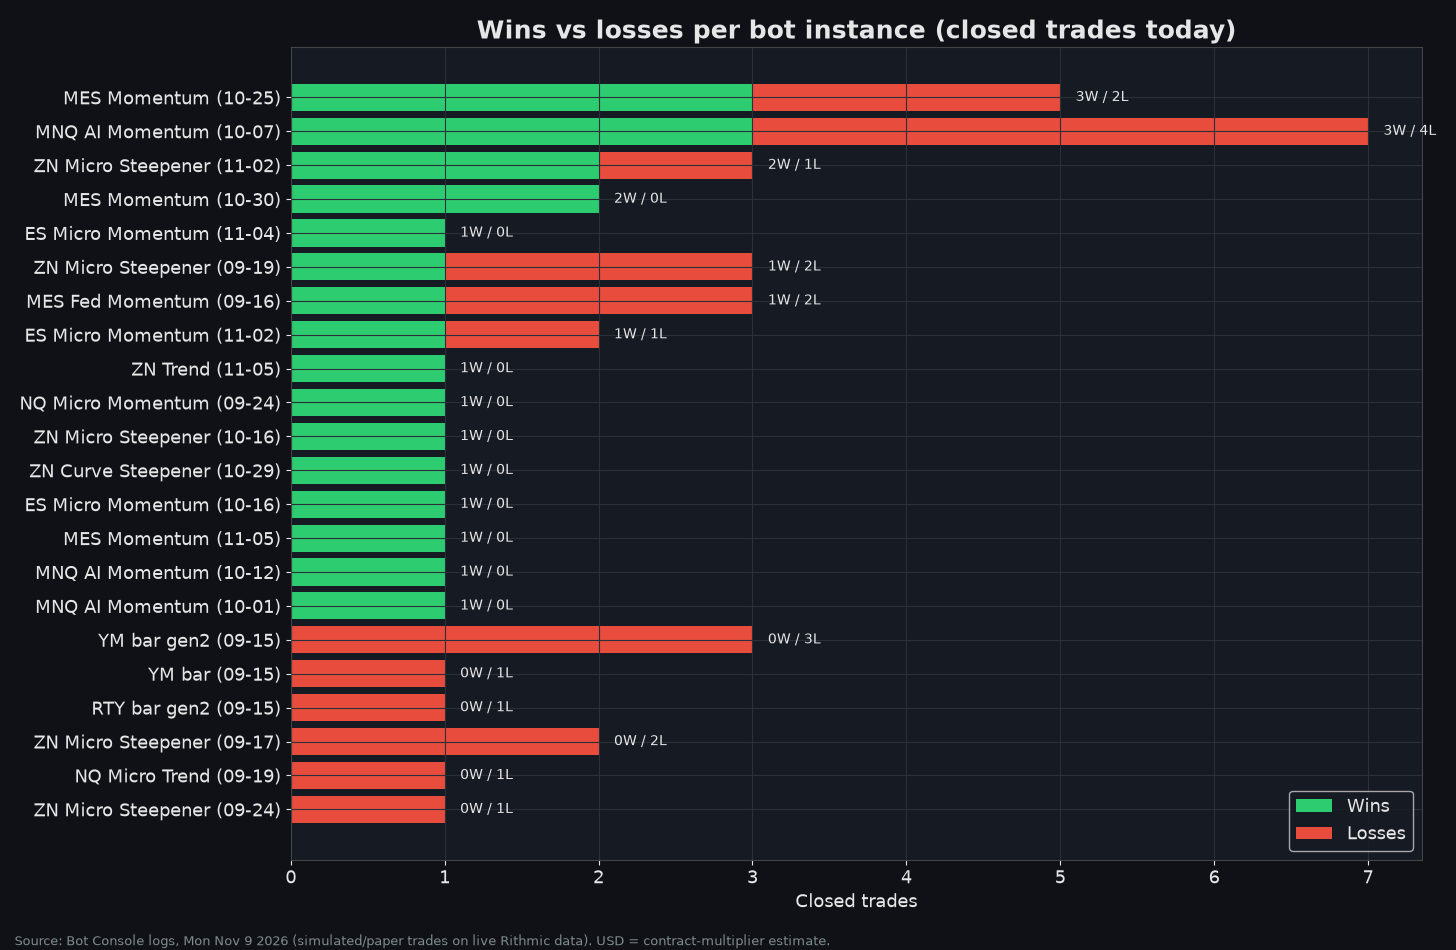
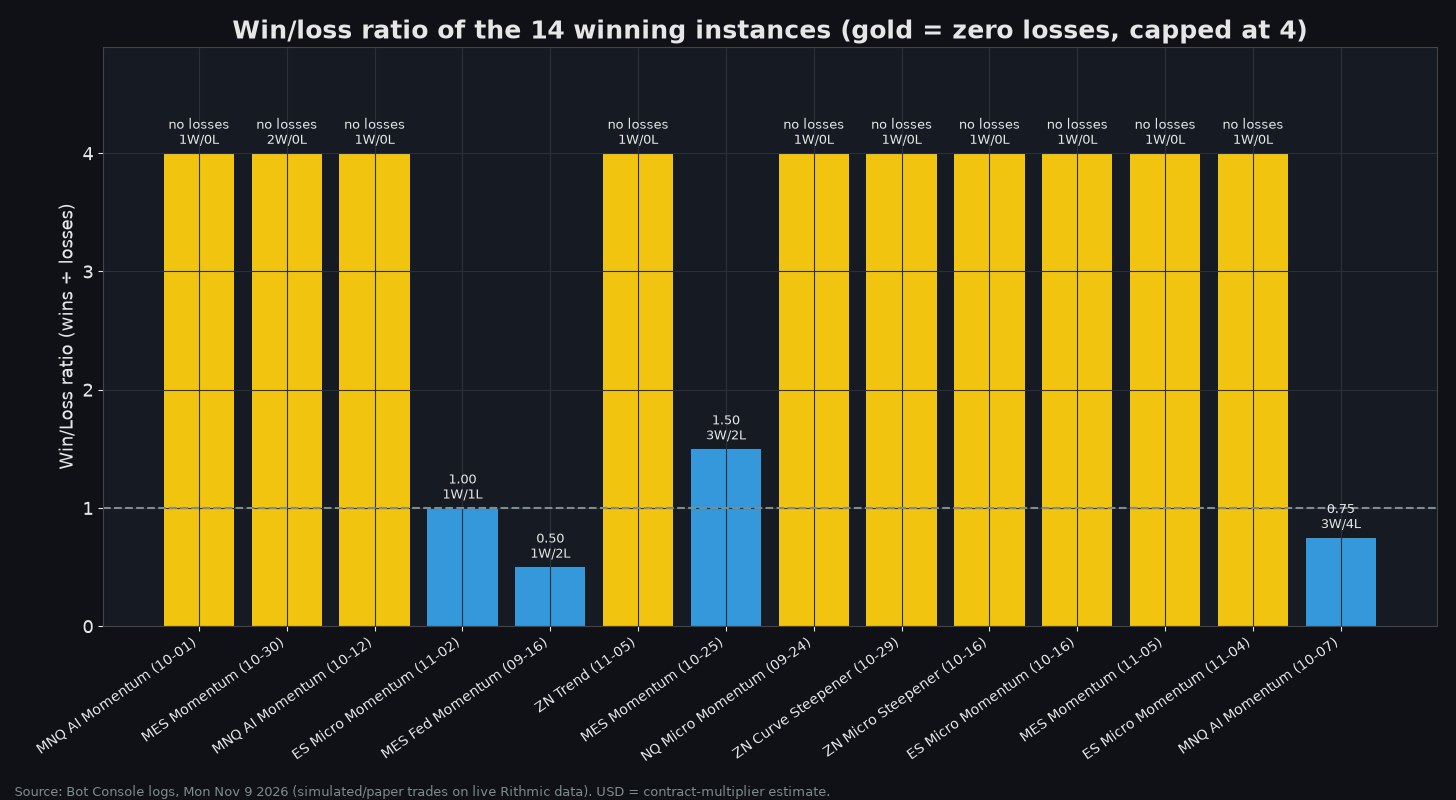
The win/loss ratio chart caps “no losses” at 4 so the bars stay readable. Ten of the fourteen winners had only one or two closed trades with no losers. Their ratio is technically infinite, but statistically it tells you almost nothing. Only four winners had a sample large enough to compute a real ratio: 1.50 (MES Momentum 10-25), 1.00 (ES Micro Momentum 11-02), 0.75 (MNQ AI Momentum 10-07) and 0.50 (MES Fed Momentum 09-16).
