
Simulated results only. Nothing here is investment advice. All P&L figures come from paper trades, not live orders.
The short version
On Monday, November 16, 2026, the day the Nasdaq Composite fell about 2.5% and Nvidia dropped about 5%, 39 of my simulated futures bots were running. Thirty of them never closed a trade. Nine did. Of those nine, six finished with a positive realized total, one finished with a negative realized total, and two never reported a realized total at all.
Here is the leaderboard in plain sentences, because I am deliberately not using any tables in this piece:
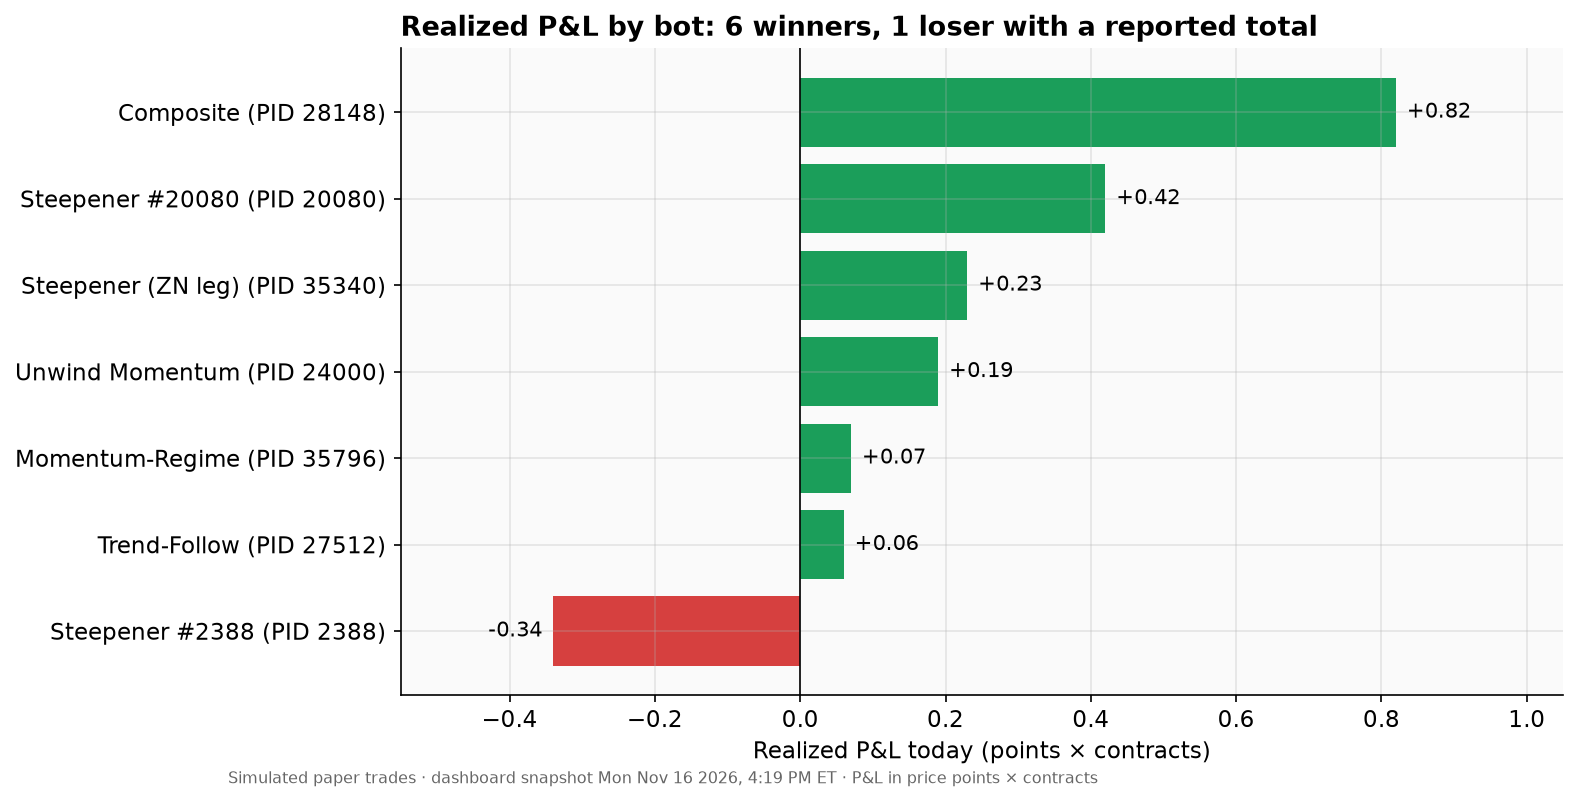
Composite made +0.82 on six trades and won all six. That is a 6-0 record and an undefined win/loss ratio, because it had zero losses.
Steepener #20080 made +0.42 on six trades: four wins, two losses, a win/loss ratio of 2.00.
Steepener (ZN leg) made +0.23 on twelve trades: six wins, six losses, a win/loss ratio of 1.00.
Unwind Momentum made +0.19 on eight trades: four wins, four losses, a ratio of 1.00.
Momentum-Regime made +0.07 on eight trades: two wins, four losses and two trades the dashboard did not classify as either. Its win/loss ratio is 0.50.
Trend-Follow made +0.06 on six trades: two wins, four losses, a ratio of 0.50.
Added together, the six winners made +1.79 across 46 closed trades (24 wins, 20 losses, 2 unclassified). Their pooled win/loss ratio is 1.20. One bot, Composite, produced 46% of that profit, and the top two produced 69%.
That is the headline. The rest of this article is about whether the headline deserves any trust. Here is the honest summary: the direction of Monday’s profit has a clear, sourced market explanation, and the size and ranking of the winners have very little statistical weight. The sample is 46 trades spread across six bots, most of which entered at the same price at roughly the same time. I will show you the arithmetic for both halves of that sentence.