


Executive Summary: The Ghost in the Modern Order Book
Whenever the S&P 500 stages a vertical, V-shaped recovery off critical technical support with no underlying fundamental catalyst, institutional trading desks and retail forums alike repeat the same shorthand: the Plunge Protection Team (PPT) has stepped into the tape.
To the public, the narrative is cinematic: a subterranean war room beneath the Marriner S. Eccles Federal Reserve building where unelected central bankers hammer the buy button on thousands of E-mini S&P 500 futures contracts to save public sentiment.
To quantitative derivatives traders, macro portfolio managers, and forensic microstructuralists, the real mechanics are far more systematic—and structural.
If the President’s Working Group on Financial Markets or monetary authorities choose to inflate asset prices, they do not issue press releases or leave transparent audit trails. What they leave are distinct microstructural footprints: order book liquidity voids, dealer delta-hedging feedback loops, weaponized forward-guidance releases, and balance-sheet adjustments that push reserve capital directly into cap-weighted index instruments.
Yet market researchers face an analytical paradox: nearly every signature of official state intervention can be mirrored by programmatic CTA trend-following rules, passive 401(k) allocations, and structural options dealer hedging.
PSEUDO-CODE: The Analytical Dilemma (Official Action vs. Algorithmic Convergence)

FUNCTION EvaluateMarketAnomaly(order_flow_event):
    signature_profile = ExtractOrderBookFootprint(order_flow_event)

    match signature_profile:
        CASE "Overnight_Thin_Volume_Ramp":
            probability_official_intervention = 0.35
            probability_systematic_cta_hedging = 0.65

        CASE "V_Shape_Reversal_At_Key_MA":
            probability_official_intervention = 0.40
            probability_gamma_flip_short_squeeze = 0.60

        CASE "Multi_Month_Multiple_Expansion_Low_Breadth":
            probability_official_intervention = 0.85 // Driven by stealth liquidity plumbing
            probability_organic_earnings_growth = 0.15

    RETURN AggregateSystemicInfluence(signature_profile)
END FUNCTION
This analysis deconstructs the legal authority, balance-sheet plumbing, and forensic order-book signatures of the modern financial system to answer a foundational question: Is the equity market rigged by state intervention, or is it the predictable result of socialized credit risk and algorithmic market mechanics?
1. The Statutory Reality: What the Fed and Treasury Can Legally Trade
To evaluate claims of equity manipulation, one must understand the statutory boundaries governing the Federal Reserve and the U.S. Department of the Treasury.
       ┌────────────────────────────────────────────────────────┐
       │     Executive Order 12631 (1987): The Working Group    │
       │       (Treasury Secretary, Fed Chair, SEC, CFTC)       │
       └──────────────────────────┬─────────────────────────────┘
                                  │ Policy Coordination & Moral Suasion
          ┌───────────────────────┴───────────────────────┐
          ▼                                               ▼
┌───────────────────────────────────┐   ┌───────────────────────────────────┐
│     The Federal Reserve Act       │   │    Exchange Stabilization Fund    │
│  • Section 13(3): Emergency credit │   │    (ESF - Gold Reserve Act 1934)  │
│  • Cannot buy common stock direct  │   │  • Unaudited FX & credit power    │
│  • Primary dealer balance-sheet   │   │  • Historically deployed abroad   │
│    liquidity backstops            │   │  • No verified domestic equity long│
└─────────────────┬─────────────────┘   └─────────────────┬─────────────────┘
                  │                                       │
                  └───────────────────┬───────────────────┘
                                      ▼
             ┌─────────────────────────────────────────────────┐
             │         Indirect Equity Market Transmission      │
             │   Credit Backstops + TGA / RRP Stealth Liquidity │
             └─────────────────────────────────────────────────┘
The Federal Reserve Act: Section 13(3) and Statutory Equity Restrictions
Under the Federal Reserve Act of 1913, the Federal Reserve is legally barred from directly purchasing corporate equities, common stock, or domestic equity index futures contracts under ordinary operations. Open-market operations under Section 14 restrict direct asset acquisitions to:
Direct obligations of the U.S. Treasury (Bills, Notes, Bonds).
Debt obligations guaranteed by U.S. government agencies.
Agency mortgage-backed securities (MBS).
In extreme market dislocations, the central bank turns to Section 13(3): its emergency lending facility authority. Under Section 13(3), subject to Treasury Secretary approval, the Fed can launch broad lending programs under “unusual and exigent circumstances.”
Even under Section 13(3), the Fed does not trade equities. Instead, it capitalizes Special Purpose Vehicles (SPVs) alongside equity provided by the Treasury. These vehicles lend against corporate collateral or buy corporate credit instruments. The Fed does not purchase equities directly; it backstops the solvency of corporate issuers, removing the downside credit default risk that would otherwise re-price the equity market downward.
The Exchange Stabilization Fund (ESF): The Real Sovereign Lever
If an executive branch organ possessed the operational mandate to intervene in financial markets to manage volatility, it would be the Exchange Stabilization Fund (ESF).
Established under Section 10 of the Gold Reserve Act of 1934, the ESF sits under the direct authority of the Secretary of the Treasury, subject only to Presidential direction. The statutory framework permits the Secretary to use the fund to “deal in gold, foreign exchange, and other instruments of credit and securities” to stabilize the exchange value of the U.S. dollar.
Because currency values, interest rates, and equity index futures are economically linked, the legal scope of “instruments of credit and securities” remains open to interpretation. The fund has historically been mobilized for international bailouts (such as the 1995 Mexican peso bailout) and for guaranteeing U.S. money market mutual funds in 2008.
However, no audited ledger, public filing, or historical disclosure has ever shown the ESF operating an active long position in U.S. equity index futures.
Executive Order 12631: The President’s Working Group
The phrase “Plunge Protection Team” entered the public lexicon following an August 1989 Washington Post article discussing the President’s Working Group on Financial Markets (PWG). Formed by Ronald Reagan via Executive Order 12631 after the October 1987 “Black Monday” crash, the PWG consists of:
The Secretary of the Treasury (Chair).
The Chairman of the Board of Governors of the Federal Reserve System.
The Chairman of the Securities and Exchange Commission (SEC).
The Chairman of the Commodity Futures Trading Commission (CFTC).
The PWG is an administrative coordination committee, not an execution desk. It possesses no trading accounts, no order routing infrastructure, and no proprietary risk capital. When a systemic break threatens markets, the PWG coordinates:
Bilateral repo lines and commercial paper liquidity.
Regulatory relief for bank balance sheets (such as Supplementary Leverage Ratio adjustments).
Coordinated public communication across agencies to stabilize market expectations.
PSEUDO-CODE: Official Regulatory Intervention Logic (PWG Playbook)

PROCEDURE ProcessSystemicMarketStress(market_state):
    IF market_state.realized_volatility > threshold_critical AND market_state.liquidity_freeze == TRUE THEN
        CALL ConvenePresidentsWorkingGroup(Treasury, Fed, SEC, CFTC)

        // Step 1: Open balance-sheet pipelines to primary dealers
        CALL ExpandPrimaryDealerRepoLines(liquidity_volume=UNLIMITED)

        // Step 2: Regulatory capital relief
        CALL RelaxSupplementaryLeverageRatio(allow_treasury_exemption=TRUE)

        // Step 3: Coordinated open-mouth operations
        CALL ScheduleOfficialStatements(tone="Dovish_Systemic_Backstop")

        // Note: No direct equity purchasing command exists in statutory code
        ASSERT market_state.direct_equity_purchases == NULL
    END IF
END PROCEDURE
2. The 10 Microstructural Signatures of an “Artificial” Rally
Quantitative trading desks and market microstructure researchers look directly at execution dynamics to evaluate non-economic or policy-driven buying programs.
Below are the ten microstructural signatures commonly viewed as evidence of market intervention, alongside the mechanical market algorithms that explain them.
Signature 1: The Overnight / Pre-Market Futures Ramp
The Phenomenon
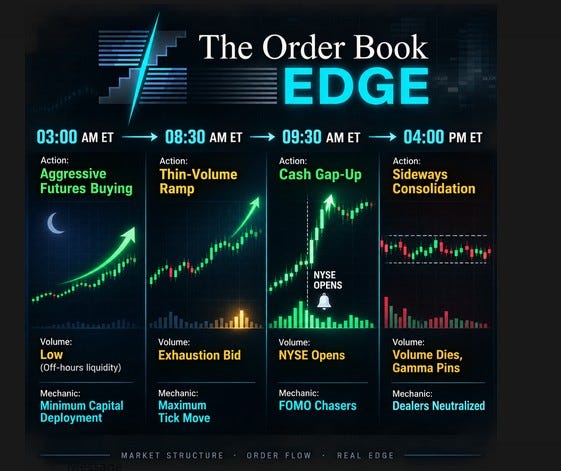
The New York cash session closes weak at 4:00 PM ET. Global macro news prints bearish. Yet, between 3:00 AM and 8:30 AM ET—during low-volume London and Asian trading hours—a persistent buying program lifts S&P 500 E-mini (ES) and Nasdaq-100 (NQ) futures. By the 9:30 AM ET cash open, the prior day’s technical breakdown is entirely erased via a gap-up, forcing institutional short-sellers to cover into an illiquid opening cross.
Time:     03:00 AM ET ─────────────────► 08:30 AM ET ─────► 09:30 AM ET ─────► 04:00 PM ET
Action:   Aggressive Futures Buying      Thin-Volume Ramp     Cash Gap-Up       Sideways Consolidation
Volume:   Low (Off-hours liquidity)      Exhaustion Bid       NYSE Opens        Volume Dies, Gamma Pins
Mechanic: Minimum Capital Deployment     Maximum Tick Move    FOMO Chasers      Dealers Neutralized
PSEUDO-CODE: Pre-Market Algorithmic Futures Ramp vs. Arbitrage Parity

FUNCTION ExecuteOffHoursRamp(target_index_future, target_tick_advance):
    // Off-hours book has low depth: minimal contracts required per tick
    WHILE CurrentTime() >= "03:00:00" AND CurrentTime() < "09:30:00":
        order_book_depth = GetTopFiveLevelsDepth(target_index_future)

        IF order_book_depth.ask_liquidity < HISTORICAL_AVERAGE * 0.40 THEN
            // Low capital required to move the market
            required_contracts = CalculateContractsToSweep(levels=3)
            SendMarketOrder(BUY, target_index_future, required_contracts)
        END IF
    END WHILE

    // Once cash opens, market arbitrageurs force cash stocks to match futures
    ON CashSessionOpen():
        FOR EACH equity_component IN target_index_future.underlying_basket:
            IF equity_component.open_price < TheoreticalFairValue(target_index_future):
                SendBasketOrder(BUY, equity_component) // Arbitrage closes the gap
            END IF
        END FOR
END FUNCTION
Why It Looks Like Intervention
Order-book depth during Asian and early European hours is thin. An actor seeking to alter market sentiment can advance index futures by dozens of points with minimal capital compared to the billions required during regular trading hours. Once futures trade higher, index arbitrage programs force underlying cash stocks to open higher at 9:30 AM via fair-value pricing models.
The Structural Market Reality
This price action frequently stems from CTA momentum models and structural overnight portfolio rebalancing. Quantitative commodity trading advisors use overnight trend-following signals that trigger systematic order execution across global equity futures. Additionally, European structured products desks routinely hedge overnight index risks by sweeping E-mini liquidity pools when local European indices open.
Signature 2: The “V-Shaped” Recovery at Key Technical Inflection Points
The Phenomenon
The S&P 500 breaks down through a critical moving average (such as the 200-day or 50-day moving average) or a major monthly volume-weighted average price (VWAP) level. Selling accelerates, only to reverse abruptly on heavy volume. Within minutes, the market climbs out of the breakdown zone, forming a hammer or bullish engulfing candle on the daily chart.
PSEUDO-CODE: Algorithmic Dealer Hedging at Critical Technical Support

PROCEDURE ProcessTechnicalBounceAtSupport(price_series, support_level):
    current_price = price_series.current

    IF current_price <= support_level THEN
        // 1. Retail and discretionary stop-losses are triggered
        TriggerStopLossCascades(direction=SELL)

        // 2. Options dealers evaluate aggregate gamma exposure
        dealer_gamma = CalculateAggregatedDealerGamma()

        IF dealer_gamma < 0 THEN
            // Short gamma: dealers sell dips and buy rallies
            // As selling stalls, implied volatility (IV) drops
            iv_level = GetOptionsImpliedVolatility()

            IF DetectMomentumExhaustion() == TRUE THEN
                iv_level.drop() // Volatility crushes

                // Vanna and Charm flows trigger programmatic buying
                delta_hedge_requirement = CalculateVannaCharmDelta(iv_level)
                SendFuturesOrder(BUY, delta_hedge_requirement) // Aggressive vertical buy

                // Reversal confirmed algorithmically
                ASSERT price_series.current > support_level
            END IF
        END IF
    END IF
END PROCEDURE
Why It Looks Like Intervention
The mathematical precision with which markets reverse off technical levels leads many to suspect institutional price management. Often, these reversals occur alongside scheduled or impromptu speaking appearances by Federal Reserve regional presidents or Treasury officials offering reassuring guidance.
The Structural Market Reality
This dynamic is driven by dealer gamma exposure and volatility (vanna/charm) flows. When an index falls into a widely watched technical support level, retail and institutional participants buy downside protective puts.
As the market touches support and selling subsides, implied volatility drops sharply. Options market makers who are short those puts find their delta hedge requirements falling due to volatility compression (the vanna effect) and time decay (the charm effect). They are algorithmically required to purchase index futures to remain delta-neutral, generating a mechanical V-shaped reversal.
Signature 3: Negative Market Breadth Masked by Mega-Cap Index Levitation
The Phenomenon
The S&P 500 and Nasdaq-100 close in positive territory, while market internals paint a deteriorating picture:
The NYSE Advance-Decline (A/D) line drops.
Down volume outpaces up volume across the broad market.
The equal-weight S&P 500 index (RSP) finishes lower.
Only a handful of mega-cap technology firms (the top 5-7 companies by weighting) close higher.
┌────────────────────────────────────────────────────────┐
│             Capital Flow Divergence Architecture       │
├──────────────────────────┬─────────────────────────────┤
│   Mega-Cap Tech Basket   │   Underlying Broad Market   │
│   (AAPL, MSFT, NVDA)     │   (Russell 2000 / RSP)      │
├──────────────────────────┼─────────────────────────────┤
│  ▲ UP +2.5%              │  ▼ DOWN -1.2%               │
│  High weight in SPY/QQQ  │  Low weight in SPY/QQQ      │
│  High liquidity soak     │  Credit/Rate sensitive      │
├──────────────────────────┴─────────────────────────────┤
│  NET RESULT: SPX Closes Green (+0.75%)                 │
│  Optics: Healthy Bull Market                           │
│  Microstructure: Severe Capital Flight & Poor Breadth  │
└────────────────────────────────────────────────────────┘
PSEUDO-CODE: Passive Capital Allocation by Capitalization Weight

FUNCTION CalculatePassiveIndexInflowAllocation(inflow_capital_dollars, asset_universe):
    total_market_cap = 0
    FOR EACH asset IN asset_universe:
        total_market_cap = total_market_cap + (asset.shares_outstanding * asset.current_price)
    END FOR

    // Allocation per stock is mathematically tied to market cap weight
    FOR EACH asset IN asset_universe:
        asset_market_cap = asset.shares_outstanding * asset.current_price
        asset_weight = asset_market_cap / total_market_cap

        capital_to_allocate = inflow_capital_dollars * asset_weight
        SendLimitOrder(BUY, asset.ticker, capital_to_allocate)
    END FOR

    // Result: Top 5 stocks absorb ~30% of all blind passive 401(k) inflows
END FUNCTION
Why It Looks Like Intervention
If an authority wanted to project financial stability with limited resources, it would not buy all 500 stocks in the S&P 500. It would concentrate capital into the most heavily weighted names (e.g., Apple, Microsoft, Nvidia, Amazon, Alphabet, Meta). Because the S&P 500 is market-cap-weighted, lifting the top components mathematically pulls the entire headline index higher, creating an illusion of strength while the broader market weakens.
The Structural Market Reality
This concentration is the inevitable byproduct of the global shift toward passive index funds and automated retirement contributions. Every two weeks, automated 401(k) and target-date fund inflows purchase cap-weighted ETFs like SPY, VOO, and QQQ without evaluating valuations.
Because mega-cap technology firms hold balance sheets with large cash reserves and steady cash flows, institutional capital also uses them as safe-haven assets during periods of macro uncertainty. The divergence is a function of market structure, not a backroom policy directive.
Signature 4: Complete Breakdown of Inter-Market Macro Correlations
The Phenomenon
In fundamentally driven regimes, asset classes generally trade according to historical macroeconomic relationships: equity prices reflect real interest rates, credit spreads track corporate default probabilities, and currencies follow interest-rate differentials.
During an engineered liquidity phase, these inter-market correlations frequently decouple:
The 10-year Treasury yield climbs (raising discount rates).
The U.S. Dollar Index (DXY) rallies.
Growth and technology equities advance concurrently.
Commodities and gold break away from real yields.
Traditional Risk-On Regime:
Equities ▲  │  Treasury Yields ▲  │  Credit Spreads ▼  │  Gold ▼  │  DXY ▼

Liquidity-Overdrive Regime:
Equities ▲  │  Treasury Yields ▲  │  Credit Spreads Flat│  Gold ▲  │  DXY ▲
                                                    └─► (Fiat Denominator Dilution)
PSEUDO-CODE: Discounted Cash Flow Multiples vs. Liquidity Override

FUNCTION EvaluateEquityValuationModel(projected_cash_flows, risk_free_rate, equity_risk_premium, systemic_liquidity):
    // Standard Discounted Cash Flow valuation
    discount_rate = risk_free_rate + equity_risk_premium
    enterprise_value = 0

    FOR year = 1 TO length(projected_cash_flows):
        enterprise_value = enterprise_value + (projected_cash_flows[year] / ((1 + discount_rate) ^ year))
    END FOR

    // In a structural liquidity override regime:
    IF systemic_liquidity.expansion_rate > THRESHOLD_EXTREME THEN
        // Fiat denominator debasement overrides the discount rate penalty
        liquidity_multiple_expansion_factor = systemic_liquidity.expansion_rate * 1.5
        adjusted_market_price = enterprise_value * (1 + liquidity_multiple_expansion_factor)
        RETURN adjusted_market_price // Equities rally despite high rates
    ELSE
        RETURN enterprise_value
    END IF
END FUNCTION
Why It Looks Like Intervention
Standard corporate finance dictates that higher discount rates reduce the present value of distant cash flows, hurting long-duration technology multiples. When the equity market consistently ignores rising yields, critics suspect artificial liquidity supports are holding valuations above their fair fundamental levels.
The Structural Market Reality
Modern tech giants operate less like traditional speculative growth companies and more like cash-generative global platforms. During inflationary periods, global investors treat these businesses as inflation hedges with reliable pricing power.
Additionally, foreign institutional capital fleeing currency volatility in Europe or Asia routinely parks funds in mega-cap U.S. equities, driving up both the U.S. dollar and tech valuations simultaneously.
Signature 5: Stealth QE via the Treasury General Account and Reverse Repo Draining
The Phenomenon
The Federal Reserve announces Quantitative Tightening (QT), stating it is shrinking its balance sheet by allowing fixed-income assets to mature without reinvestment. In theory, withdrawing hundreds of billions in central bank reserves should drain liquidity from risk assets.
Yet, during QT, the equity market can mount powerful, sustained rallies.
┌────────────────────────────────────────────────────────────────────────┐
│                   The Federal Reserve Balance Sheet                    │
│                                                                        │
│   ┌────────────────────────────────────────────────────────────────┐   │
│   │                      Total Fed Assets                          │   │
│   │               (Contracting via QT: -$60B/mo)                   │   │
│   └───────────────────────────────┬────────────────────────────────┘   │
│                                   │                                    │
│                 Subtracted Liabilities (Sterilization)                 │
│         ┌─────────────────────────┴─────────────────────────┐          │
│         ▼                                                   ▼          │
│  ┌──────────────┐                                    ┌──────────────┐  │
│  │     TGA      │                                    │    ON RRP    │  │
│  │  (Treasury   │                                    │  (Cash at    │  │
│  │   Account)   │                                    │  the Fed)    │  │
│  └──────┬───────┘                                    └──────┬───────┘  │
│         │ Drains Cash (-$300B)                              │ Drains Cash (-$1.5T)
│         ▼                                                   ▼          │
│  ┌──────────────────────────────────────────────────────────────────┐  │
│  │            Surging Effective Bank Reserves (Net Liquidity)       │  │
│  │        High Reserves = Bank Lending = S&P 500 Multiples Expand   │  │
│  └──────────────────────────────────────────────────────────────────┘  │
└────────────────────────────────────────────────────────────────────────┘
PSEUDO-CODE: Net Liquidity Calculation Engine

FUNCTION CalculateNetFedLiquidity(fed_total_assets, treasury_general_account, overnight_reverse_repo):
    // Net Liquidity represents active reserves circulating in the banking system
    net_liquidity = fed_total_assets - treasury_general_account - overnight_reverse_repo
    RETURN net_liquidity
END FUNCTION

PROCEDURE EvaluateLiquidityImpactOnEquities(delta_time):
    change_in_fed_assets = GetFedAssetChange(delta_time) // e.g., -$60B (QT)
    change_in_tga        = GetTGAChange(delta_time)      // e.g., -$200B (Spending)
    change_in_on_rrp     = GetRRPChange(delta_time)      // e.g., -$400B (Draining)

    // Net liquidity delta formula
    net_liquidity_delta = change_in_fed_assets - (change_in_tga + change_in_on_rrp)

    // -$60B - (-$200B + -$400B) = -$60B - (-$600B) = +$540B Net Injected Liquidity
    IF net_liquidity_delta > 0 THEN
        market_bias = "BULLISH_MULTIPLE_EXPANSION"
        ExecuteTacticalAllocation(BUY, S_AND_P_500_FUTURES)
    END IF
END PROCEDURE
Why It Looks Like Intervention
To casual observers, an equity market rallying while the Fed publicly claims to tighten monetary policy looks like manipulation. It appears as though monetary authorities are quietly running an unannounced equity stabilization operation.
The Structural Market Reality
This dynamic is driven by the mechanics of the Net Fed Liquidity model. Headline central bank assets only tell half the story; commercial bank reserves are determined by liability line items on the Fed’s balance sheet:
The Treasury General Account (TGA): When the Treasury draws down its cash balance at the Fed to finance public spending, that money enters the commercial banking system, converting into active bank reserves.
The Overnight Reverse Repo Facility (ON RRP): When the Treasury issues high volumes of short-term Treasury bills, money-market funds pull cash from the Fed’s ON RRP facility to buy them.
When the TGA and ON RRP drain faster than the Fed rolls assets off its balance sheet, net bank reserves expand. This injection of active reserves easily offsets nominal QT, driving multiple expansion across the equity market.
Signature 6: The Credit Backstop Proxy (HYG, LQD, and Emergency Facilities)
The Phenomenon
During severe market corrections, high-yield corporate credit (HYG) and investment-grade corporate bonds (LQD) suddenly reverse higher without positive corporate earnings news. Shortly thereafter, equity index futures bottom and follow the credit proxies upward in lockstep.
Event Timeline: Credit Leading Equity Reversals
-------------------------------------------------------------------------
Day 1: High Yield (HYG) drops; S&P 500 futures sell off heavily.
Day 2: Rumors of liquidity facility; HYG stages an anomalous +4% surge.
Day 3: Credit spreads compress across primary dealer balance sheets.
Day 4: S&P 500 explodes higher; equity traders claim a "miracle bottom."
-------------------------------------------------------------------------
PSEUDO-CODE: Credit Floor Transmission to Equity Valuations

PROCEDURE MonitorCreditEquityTransmission(credit_etf_hyg, spx_index):
    credit_spread = GetOptionAdjustedSpread(credit_etf_hyg)

    // Check for official intervention in credit market (SMCCF template)
    IF credit_spread > STRESS_THRESHOLD AND FedAnnouncesFacility() == TRUE THEN
        // State establishes floor on corporate credit default risk
        credit_default_risk_premium = 0
        CompressCreditSpreads(credit_etf_hyg)

        // Equity risk is mathematically anchored by credit seniority
        // If debt default risk is removed, equity insolvency risk approaches zero
        equity_floor_price = CalculateInsolvencyFloor(spx_index)

        SendProgrammaticOrder(BUY, spx_index, volume="MAX_BALANCE_SHEET_CAPACITY")
    END IF
END PROCEDURE
Why It Looks Like Intervention
Credit spreads represent corporate solvency risk. When high-yield corporate debt spreads compress in the middle of a macroeconomic downturn, it signals that an institutional backstop has stepped in to absorb default risk. Because debt holders have seniority over equity holders, removing credit risk creates an implicit safety net under common stock.
The Structural Market Reality
The Federal Reserve established a clear blueprint for this in March 2020 via the Secondary Market Corporate Credit Facility (SMCCF). Using CARES Act equity capital provided by the U.S. Treasury, the Fed retained BlackRock to purchase shares of corporate bond ETFs (including LQD and HYG) on the open market.
The Fed did not need to buy shares of Apple or Microsoft directly. By putting a price floor on corporate debt, the central bank unblocked primary bond issuance and removed immediate insolvency risk. Institutional credit funds now trade with this precedent in mind, stepping in to buy credit whenever spreads hit stress thresholds because they expect the central bank to intervene before widespread defaults occur.
Signature 7: 0DTE Options Gamma Traps and Algorithmic Pinning
The Phenomenon
The market starts the trading day with aggressive selling pressure. By early afternoon, an immense wave of call buying hits zero-days-to-expiration (0DTE) options on SPY and SPX, heavily concentrated at a specific out-of-the-money strike price (such as SPX 5,500).
As the index nears the strike, the rally accelerates rapidly into the close, pinning the market near the target strike until the 4:00 PM ET expiration.
0DTE Volatility Mechanics: The Gamma Reflexivity Loop

[Retail / Algorithmic Flow] ──► Buys Thousands of 0DTE Out-of-the-Money Calls
                                             │
                                             ▼
[Options Market Makers]     ──► Sells Calls (Becomes Short Gamma / Short Delta)
                                             │
                                             ▼
[To Remain Hedged]          ──► Must Programmatically BUY Underlying Futures
                                             │
                                             ▼
[Underlying Price Rises]    ──► Delta Increases Rapidly (Gamma Escalation)
                                             │
                                             ▼
[Market Makers]             ──► Forced to Buy MORE Futures into the Close
                                (The Self-Fulfilling Gamma Squeeze)
PSEUDO-CODE: 0DTE Dealer Gamma Hedging Algorithm

PROCEDURE DynamicOptionsDeltaHedge(dealer_portfolio, spot_price, strike_k, time_to_maturity):
    // As time to expiration (T) approaches 0, Gamma approaches extreme levels
    options_delta = CalculateBlackScholesDelta(spot_price, strike_k, time_to_maturity)
    options_gamma = CalculateBlackScholesGamma(spot_price, strike_k, time_to_maturity)

    // Market maker sold calls to retail/funds -> Dealer is short gamma
    dealer_delta_position = dealer_portfolio.call_volume_sold * (-options_delta)

    hedge_discrepancy = dealer_portfolio.underlying_futures_held - dealer_delta_position

    IF hedge_discrepancy < 0 THEN
        // Dealer must buy underlying to maintain delta-neutral hedge
        required_futures_buy = Abs(hedge_discrepancy)
        SendMarketOrder(BUY, "ES_FUTURES", required_futures_buy)
    END IF

    // Self-reinforcing feedback loop:
    // As spot_price rises toward strike_k, options_delta accelerates upward
    // Forcing the dealer to buy more futures continuously into the closing bell
END PROCEDURE
Why It Looks Like Intervention
The size and timing of these late-session intraday turnarounds often lead retail traders to conclude that the PPT is stepping in to protect market benchmarks from closing at technical lows.
The Structural Market Reality
This is driven by the structural mechanics of 0DTE options liquidity.
Because gamma measures the rate of change of an option’s delta relative to moves in the underlying asset, gamma spikes dramatically as an option approaches expiration:
PSEUDO-CODE: Options Gamma Behavior Near Expiration

FUNCTION GetGammaProfile(time_to_maturity, volatility, spot, strike):
    IF time_to_maturity <= 0.001 THEN // Expiration day (0DTE)
        IF Abs(spot - strike) < 2.0 THEN
            gamma = EXTREME_HIGH // Infinite sensitivity at the money
        ELSE
            gamma = 0
        END IF
    ELSE
        gamma = StandardNormalDensityDerivative(spot, strike, volatility, time_to_maturity)
    END IF
    RETURN gamma
END FUNCTION
When market participants purchase short-dated out-of-the-money calls, options dealers take the other side of the trade, leaving them short gamma. To manage their risk, dealers must purchase underlying futures as the price rises. As the index approaches the strike price, the dealer’s hedge ratio expands rapidly, forcing them to buy increasing volumes of E-mini futures into the close. The resulting move is an automated derivatives-driven gamma squeeze, not a sovereign intervention.
Signature 8: Sustained Decoupling of Valuation Multiples from Earnings Realities
The Phenomenon
Macroeconomic indicators show clear deterioration:
The Conference Board Leading Economic Index (LEI) drops for consecutive quarters.
Corporate revenue expectations flatline.
Commercial bank lending standards tighten across the board.
Despite these headwinds, the S&P 500 advances. The entire rally is sustained by multiple expansion, with forward Price-to-Earnings (P/E) ratios climbing from 17x to 23x in an elevated rate environment.
┌────────────────────────────────────────────────────────┐
│             Anatomy of Multiple Expansion              │
├────────────────────────────────────────────────────────┤
│  Component 1: Corporate Earnings (Numerator)           │
│  Status: FLAT or DECLINING (-2% YoY)                   │
├────────────────────────────────────────────────────────┤
│  Component 2: Equity Valuation Multiple (Denominator)  │
│  Status: EXPANDING (+25% via Multiple Inflation)       │
├────────────────────────────────────────────────────────┤
│  NET RESULT: S&P 500 Rallies +23%                      │
│  Driver: Pure Multiple Expansion via Liquidity Premium │
└────────────────────────────────────────────────────────┘
PSEUDO-CODE: Equity Risk Premium and Multiple Expansion

FUNCTION CalculateEquityRiskPremium(earnings_per_share, index_price, risk_free_rate):
    earnings_yield = earnings_per_share / index_price
    equity_risk_premium = earnings_yield - risk_free_rate
    RETURN equity_risk_premium
END FUNCTION

PROCEDURE EvaluateFedPutValuationDistortion():
    // In an unmanipulated market, high rates + weak earnings = compressed multiples
    // But with the "Fed Put", downside default risk is socialized
    perceived_fed_put_protection = TRUE

    IF perceived_fed_put_protection == TRUE THEN
        // Investors accept an abnormally low Equity Risk Premium (ERP)
        acceptable_erp = 0.005 // Compressed to historic lows (0.5%)
        risk_free_rate = 0.045 // 4.5% Treasury yield

        required_earnings_yield = risk_free_rate + acceptable_erp // 5.0%

        // P/E multiple is the reciprocal of the earnings yield
        justified_pe_multiple = 1 / required_earnings_yield // Multiples expand to 20x+

        ASSERT justified_pe_multiple > HISTORIC_MEDIAN
    END IF
END PROCEDURE
Why It Looks Like Intervention
Traditional corporate finance dictates that index valuation reflects future discounted earnings. When multiples expand during periods of falling earnings and elevated interest rates, traders conclude that price discovery has been suspended by non-economic market participants.
The Structural Market Reality
Equity valuations are heavily influenced by the Equity Risk Premium (ERP). When the financial system operates under an implicit “Fed Put”—the institutional expectation that central banks will ease monetary conditions before market distress causes systemic damage—investors accept historically thin risk premiums.
Furthermore, during inflationary regimes, holding uninvested cash guarantees a real loss of purchasing power. Institutional capital moves into equities not because earnings are accelerating, but because large corporate platforms possess pricing power, making them effective stores of value.
Signature 9: Timed Media Trial Balloons and Narrative Engineering
The Phenomenon
The market approaches a critical technical breakdown at 1:30 PM ET, with sell-stops clustering directly beneath the morning low.
Suddenly, at 1:45 PM ET, an unscheduled article appears on financial news terminals from an authorized monetary policy reporter, bearing a headline such as: “Fed Officials Consider Slowing Pace of Quantitative Tightening as Funding Markets Show Strain.”
Within seconds, Treasury yields drop, interest rate futures adjust, and S&P 500 futures rally 1.2% off the lows, closing near session highs.
Transmission Sequence: The Narrative Lever
-----------------------------------------------------------------------------
13:30 ET: S&P 500 approaches critical 200-day moving average. Panic selling.
13:45 ET: Authorized reporter drops piece on potential "Fed balance sheet pause."
13:46 ET: Algorithmic Natural Language Processing (NLP) machines scrape headline.
13:47 ET: Rate-cut implied probabilities shift from 25% to 65%.
14:00 ET: Short-covering cascades ignite; the technical breakdown is averted.
-----------------------------------------------------------------------------
PSEUDO-CODE: Quantitative Natural Language Processing (NLP) News Scalper

PROCEDURE ProcessNewsFeedStream(news_feed_stream):
    FOR EACH article IN news_feed_stream:
        IF article.author IN AUTHORIZED_POLICY_LEAK_JOURNALISTS THEN
            sentiment_score = ScrapeAndAnalyzeKeywords(
                article.text,
                positive_lexicon=["pause", "slow runoff", "rate cut", "liquidity backstop"],
                negative_lexicon=["hike", "inflation persistent", "overheated"]
            )

            IF sentiment_score > DOVISH_THRESHOLD THEN
                // Algorithmic hedge funds buy index futures within 10 milliseconds
                contracts_to_buy = CalculateLeveragedOrderSize()
                SendMarketOrder(BUY, "ES_FUTURES", contracts_to_buy)
                SendMarketOrder(BUY, "NQ_FUTURES", contracts_to_buy)

                // Human traders only see the headline minutes later
            END IF
        END IF
    END FOR
END PROCEDURE
Why It Looks Like Intervention
The precise timing of these news drops—often landing exactly as the market threatens to break technical support—reinforces the idea that officials are actively monitoring the tape and deploying narrative interventions to prevent corrections.
The Structural Market Reality
This is the modern framework of central bank communications as a policy instrument. The Federal Reserve relies on forward guidance to influence financial conditions without having to call emergency meetings.
Monetary policy reporters are systematically briefed on central bank thinking. When market stress threatens funding stability, officials frequently use these media channels to float policy adjustments and gauge market reactions.
High-frequency algorithmic funds run Natural Language Processing (NLP) scrapers directly on these media feeds, executing futures purchases milliseconds after a dovish article drops. The central bank does not buy the futures; algorithms buy them based on the central bank’s communication cues.
Signature 10: Central Bank Dollar Liquidity Swaps and Offshore Capital Arbitrage
The Phenomenon
During periods of balance-sheet stress across European or Asian banking hubs, U.S. index futures experience unexplained, persistent buying during early European hours, despite weak local data.
At the same time, cross-currency basis swaps normalize and the U.S. dollar index trades softer against major international currencies.
       ┌────────────────────────────────────────────────────────┐
       │             Federal Reserve Swap Facility              │
       └──────────────────────────┬─────────────────────────────┘
                                  │ US Dollars Injected via FX Swaps
                                  ▼
       ┌────────────────────────────────────────────────────────┐
       │      Foreign Central Banks (ECB, BOJ, SNB, BOE)        │
       └──────────────────────────┬─────────────────────────────┘
                                  │ Offshore Commercial Dollar Liquidity
                                  ▼
       ┌────────────────────────────────────────────────────────┐
       │     Foreign Institutional & Sovereign Wealth Funds     │
       └──────────────────────────┬─────────────────────────────┘
                                  │ Capital Deployed into Deepest Markets
                                  ▼
       ┌────────────────────────────────────────────────────────┐
       │          U.S. Equities (S&P 500 Futures & Mega-Caps)   │
       └──────────────────────────┘
PSEUDO-CODE: Foreign Central Bank Dollar Swap & Allocation Loop

PROCEDURE ProcessCentralBankSwapLines(domestic_currency_collateral, foreign_central_bank):
    // 1. Foreign bank faces severe U.S. Dollar funding shortage
    IF foreign_central_bank.fx_basis_spread > STRESS_LIMIT THEN
        // Fed opens bilateral swap window: exchanges USD for foreign currency
        usd_liquidity = ExecuteFedSwapLine(foreign_central_bank, domestic_currency_collateral)

        // 2. Foreign central bank auctions USD to commercial banking network
        auctioned_capital = foreign_central_bank.DistributeToCommercialBanks(usd_liquidity)

        // 3. International sovereign reserve managers and asset allocators deploy capital
        FOR EACH institution IN auctioned_capital.participants:
            // Settle funding strain, then redeploy excess liquidity into deep assets
            allocation_to_us_assets = institution.portfolio_margin * 0.20

            SendCrossBorderOrder(BUY, "US_EQUITY_INDEX_FUTURES", allocation_to_us_assets)
        END FOR
    END IF
END PROCEDURE
Why It Looks Like Intervention
Domestic traders wake up to see S&P futures trading higher despite negative overnight news. Because foreign central bank swap operations occur outside domestic retail view, this buying is often assumed to be direct, clandestine market management.
The Structural Market Reality
This is the direct transmission of the Federal Reserve’s Standing Swap Facilities. When offshore financial institutions experience dollar funding shortages, they cannot access the Fed’s domestic discount window.
To prevent global dollar shortages from triggering forced liquidations of dollar-denominated assets, the Fed opens swap lines with:
The European Central Bank (ECB)
The Bank of Japan (BOJ)
The Swiss National Bank (SNB)
The Bank of England (BOE)
The Bank of Canada (BOC)
Once these dollars enter the global financial system, institutional reserve managers allocate portions of that capital into liquid U.S. dollar assets, including Treasuries and index futures. The liquidity facility is designed to stabilize foreign exchange settlement, but its side effect is to support the primary U.S. equity benchmarks.
3. Historical Precedents: Documented Reality vs. Conspiratorial Fiction
To distinguish actual sovereign intervention from market myth, historical state market interventions must be separated into verified operations and unsubstantiated theories.
Sovereign Market Operations Matrix
Historical Event / Program Operational Mechanism Legal Authority Documented Fact? Market Impact 1987 Brady Commission & PWG Creation Regulatory margin relief, Fed open-market repo expansion, bank moral suasion. Executive Order 12631 Yes(Public Record) Restored liquidity pipelines and established systemic volatility backstops. 2008 TARP & Capital Purchase Program Direct preferred equity injections into major money-center banks (Citi, BofA, Goldman). Emergency Economic Stabilization Act of 2008 Yes(Congressional Audits) Prevented a systemic banking collapse by directly bolstering institutional equity capital. 2020 SMCCF & Secondary Market ETF Purchases Fed used BlackRock to buy high-yield and corporate bond ETFs (HYG, LQD) via SPVs. Section 13(3) Federal Reserve Act / CARES Act Yes(Fed Monthly Disclosures) Marked the market bottom; backstopped corporate credit, which drove equity valuations higher. Direct Fed Purchase of E-Mini S&P Futures Alleged direct proprietary buying of CME equity futures by the New York Fed trading desk. None. Prohibited under Section 14 of the Federal Reserve Act. Unproven(Zero Audit Trails or Records) Operationally redundant. Official liquidity plumbing achieves the same result without legal exposure. ESF Direct Interventions in U.S. Stocks Treasury Exchange Stabilization Fund directly buying domestic equities. Gold Reserve Act of 1934 Unproven(No Verified Domestic Traces) Deployed for foreign sovereign bailouts (Mexico 1995); never verified for domestic equity buying.
4. The Quantitative Engine of “Plumbing Manipulation”
The modern stock market does not operate as an open auction of human participants debating corporate balance sheets. It functions as an interconnected financial network driven by reserve plumbing and algorithmic execution rules.
    ┌────────────────────────────────────────────────────────┐
    │          The Structural Feedback Loop Machine          │
    └──────────────────────────┬─────────────────────────────┘
                               │
                               ▼
    ┌────────────────────────────────────────────────────────┐
    │     1. Treasury & Fed Adjust Liquidity Parameters      │
    │        (TGA drawdowns, RRP drains, dovish jawboning)   │
    └──────────────────────────┬─────────────────────────────┘
                               │
                               ▼
    ┌────────────────────────────────────────────────────────┐
    │     2. Primary Dealer Reserves Expand                  │
    │        (Balance-sheet capacity increases)              │
    └──────────────────────────┬─────────────────────────────┘
                               │
                               ▼
    ┌────────────────────────────────────────────────────────┐
    │     3. Volatility (VIX) Suppressed Mechanically        │
    │        (Systematic volatility funds forced to buy)     │
    └──────────────────────────┬─────────────────────────────┘
                               │
                               ▼
    ┌────────────────────────────────────────────────────────┐
    │     4. Systematic Strategies Expand Leverage           │
    │        (CTA trend models, Risk-Parity funds step in)   │
    └──────────────────────────┬─────────────────────────────┘
                               │
                               ▼
    ┌────────────────────────────────────────────────────────┐
    │     5. Options Market Enters Positive Gamma Territory  │
    │        (Dealers trade against volatility, pinning tape)│
    └──────────────────────────┬─────────────────────────────┘
                               │
                               ▼
    ┌────────────────────────────────────────────────────────┐
    │     6. Passive 401(k) Pipelines Absorb the Float       │
    │        (Automated flows buy mega-caps unconditionally) │
    └────────────────────────────────────────────────────────┘
PSEUDO-CODE: The End-to-End Market Plumbing Transmission Engine

PROCEDURE RunModernMarketEngine():
    // Step 1: State Adjusts Liquidity Plumbing
    tga_drain = GetTreasuryGeneralAccountDrawdown()
    rrp_drain = GetReverseRepoDrawdown()
    systemic_bank_reserves = CalculateBankReserves(tga_drain, rrp_drain)

    // Step 2: Volatility Suppression
    IF systemic_bank_reserves.trend == EXPANDING THEN
        vix_index = SuppressRealizedVolatility()
    END IF

    // Step 3: Systematic Algorithm Re-leveraging
    FOR EACH fund IN [RiskParityFunds, CTAMomentumFunds, VolTargetFunds]:
        IF vix_index < VOLATILITY_THRESHOLD THEN
            target_equity_weight = fund.max_leverage * (1 / vix_index)
            fund.Rebalance(BUY, target_equity_weight)
        END IF
    END FOR

    // Step 4: Dealer Gamma Pinning
    dealer_gamma = CalculateAggregatedDealerGamma()
    IF dealer_gamma > 0 THEN
        // In positive gamma, dealers sell highs and buy dips, dampening volatility
        dealer.ExecuteHedgingOrders(ANTI_TREND_STABILIZATION)
    END IF

    // Step 5: Mechanical Passive Inflows
    ON BiWeeklyPayday():
        ProcessAutomated401kContributions(target="SPY_AND_QQQ", price_sensitivity=NONE)
END PROCEDURE
When critics argue that the equity market is “rigged,” this feedback system is what they are observing:
The State Calibrates Bank Reserves: The Fed and Treasury influence bank reserve liquidity through bill issuance, TGA operations, and repo facilities.
Dealer Capacity Expands: Higher reserve balances lower borrowing costs and expand primary dealer balance-sheet capacity.
Volatility Compresses: Expanding liquidity lowers systemic funding costs and reduces realized volatility (VIX).
Systematic Algorithms Re-leverage: Lower volatility triggers automated re-leveraging formulas within Risk Parity, Volatility-Targeting, and CTA momentum algorithms, which buy index futures programmatically.
Dealers Shift into Long Gamma: As prices climb, options dealers transition to “long gamma” positions, where they mechanically buy dips and sell rips, suppressing market swings.
Passive Inflows Lock Up Floating Supply: Bi-weekly 401(k) allocations sweep into market-cap-weighted indices, buying mega-cap shares without regard to price.
The state does not need a proprietary equity execution desk. By adjusting systemic reserve levels, market algorithms carry out the buying automatically.
5. Forensic Checklist: Distinguishing an Organic Rally from a Policy-Engineered Move
For macro portfolio managers and quantitative traders, distinguishing an organic economic expansion from a policy-driven liquidity rally requires systematic tracking across market microstructure and balance-sheet metrics.
       Liquidity-Engineered Tape Checklist:
       [ ] RSP / SPY Ratio Decoupling (Equal-weight underperforming)
       [ ] Net Fed Liquidity Surging (Assets - TGA - RRP Expanding)
       [ ] Junk Credit (HYG) Leading Equities without Fundamental News
       [ ] Negative Breadth Divergence (Declines > Advances during Index Green Days)
       [ ] 0DTE Extreme Gamma Clustering at Overhead Resistance
       [ ] V-Shape Reversal Exact to the Cent on a 200-DMA / Fed Speaker Day
PSEUDO-CODE: Quantitative Rally Classifier

FUNCTION ClassifyMarketRallyProfile(trading_session_data):
    // Metric 1: Equal-Weight vs. Cap-Weight Divergence
    ratio_rsp_to_spy = trading_session_data.rsp_return / trading_session_data.spy_return

    // Metric 2: Net Reserve Liquidity Delta
    net_liquidity_change = CalculateNetLiquidityDelta(trading_session_data.window_30d)

    // Metric 3: Market Breadth Ratio
    breadth_ratio = trading_session_data.advancing_stocks / trading_session_data.declining_stocks

    // Metric 4: Credit Spread Confirmation
    high_yield_spread_change = trading_session_data.hyg_oas_change

    // Quantitative Classification Logic
    IF net_liquidity_change > LIQUIDITY_EXPANSION_THRESHOLD
       AND ratio_rsp_to_spy < 0.70
       AND breadth_ratio < 1.0 THEN

        rally_type = "POLICY_ENGINEERED_STEALTH_LIQUIDITY_EXPANSION"
        trade_strategy = "MOMENTUM_LONG_MEGA_CAPS_ONLY_HEDGE_TAIL_RISK"

    ELSE IF net_liquidity_change <= 0
            AND ratio_rsp_to_spy >= 1.0
            AND breadth_ratio > 1.8
            AND high_yield_spread_change < 0 THEN

        rally_type = "ORGANIC_FUNDAMENTAL_ECONOMIC_EXPANSION"
        trade_strategy = "BROAD_CYCLICAL_AND_SMALL_CAP_EXPOSURE"

    ELSE
        rally_type = "AMBIGUOUS_TRANSITIONAL_REGIME"
        trade_strategy = "DELTA_NEUTRAL_PAIRS_TRADING"
    END IF

    RETURN (rally_type, trade_strategy)
END FUNCTION
1. The Breadth-to-Market-Cap Ratio
Organic Rally: The NYSE Advance-Decline line advances to new highs alongside the index. Mid caps, small caps (Russell 2000), and the Equal-Weight S&P 500 (RSP) outpace or track the headline market-cap index (SPY).
Engineered Move: The S&P 500 reaches new highs while the RSP lags or drops. Fewer than 50% of components trade above their 50-day moving averages. The headline index is lifted by a small cluster of mega-cap platform stocks.
2. The Net Liquidity Delta
Organic Rally: Equities rally while Net Liquidity (Fed Assets−TGA−ON RRP\text{Fed Assets} - \text{TGA} - \text{ON RRP}Fed Assets−TGA−ON RRP) remains flat or contracts. The rally is financed by private capital allocation, rising corporate investment, and bank loan growth.
Engineered Move: The index rallies alongside rapid drawdowns in the Treasury General Account or steep declines in the Overnight Reverse Repo facility, showing that the move is driven by central bank reserve expansion.
3. Credit Spread Confirmation
Organic Rally: High-yield and investment-grade credit spreads narrow gradually alongside higher revenues, declining corporate default forecasts, and solid capital expenditure.
Engineered Move: Credit spreads narrow sharply following unexpected central bank liquidity announcements, changes to bank leverage rules, or the activation of swap facilities, even as corporate balance-sheet leverage metrics worsen.
4. Volume Profile and Order Book Imbalance
Organic Rally: Advancing sessions show broad volume growth during regular New York cash hours. Cumulative delta reveals consistent institutional accumulation across sectors throughout the day.
Engineered Move: Volume is thin during regular trading hours, while outsized buying occurs in pre-market futures sessions. Intraday price action is dominated by gamma pins, low realized volatility, and programmatic Market-On-Close (MOC) buy orders into the 4:00 PM bell.
Conclusion: The Honest Bottom Line
Is the stock market rigged by the Federal Reserve and the Plunge Protection Team?
If “rigged” means that the U.S. government runs a secret trading room that buys S&P 500 E-mini futures to control stock prices, the answer is no.
No credible regulatory filing, financial audit, or historical record confirms the existence of direct, proprietary equity buying by U.S. monetary authorities. Such an operation would be legally vulnerable, politically high-risk, and functionally unnecessary.
However, if “rigged” means that equities operate in a state-managed financial ecosystem where credit downside is backstopped, banking reserves are steered through debt-management choices, and price discovery is secondary to preserving financial conditions, the answer is yes.
The modern stock market does not function as an isolated, laissez-faire capital auction; it is an interconnected financial network operating under explicit policy parameters.
When the Federal Reserve backstops high-yield debt to halt a liquidity freeze, when the Treasury manages its cash balances to inject liquidity ahead of major debt operations, and when central banks use currency swap lines to calm offshore dollar funding shortages, they fundamentally alter the risk landscape.
PSEUDO-CODE: The Macro Reality Check

FUNCTION FinalForensicVerdict():
    claims_of_secret_ppt_order_desk = FALSE // No secret trading room
    reality_of_policy_constructed_market = TRUE // Systemic state management

    IF reality_of_policy_constructed_market == TRUE THEN
        market_environment = "Socialized Credit Risk + Liquidity Siphons"
        optimal_trader_response = "Trade the plumbing, respect dealer gamma, abandon pure fundamental dogma"
    END IF

    RETURN market_environment, optimal_trader_response
END FUNCTION
These actions distort market pricing. They signal to institutional investors that downside credit risk is socialized by the state. In response, dealers, algorithmic models, and private funds position for this implicit liquidity backstop, concentrating capital in passive index giants and using options gamma to fuel low-volatility advances.
The state does not need to trade futures contracts. The daylight machinery of modern monetary policy, Treasury operations, and derivatives market structure achieves the exact same outcome: a financial system structured to prevent severe declines, trading at multiples that unassisted capital markets could not sustain.
Key Takeaways for Market Practitioners
PSEUDO-CODE: Professional Macro Trading Protocol

PROCEDURE ProfessionalExecutionProtocol():
    // Rule 1: Track the plumbing, ignore the rumors
    active_liquidity = CalculateNetFedLiquidity(FedAssets, TGA, ON_RRP)
    credit_spreads   = GetHighYieldSpread()

    // Rule 2: Quantify options dealer positioning
    dealer_gamma = GetDealerGammaState()
    IF dealer_gamma == "POSITIVE_GAMMA" THEN
        ExpectVolatilitySuppression()
        TradeMeanReversion()
    ELSE
        ExpectVolatilityExpansion()
        TradeMomentumBreakouts()
    END IF

    // Rule 3: Recognize the passive siphon
    // Understand that automated 401(k) flows blindly support mega-cap tech

    // Rule 4: Never short a liquidity ramp purely on valuation
    IF active_liquidity.trend == "EXPANDING" AND ValuationMultiple() > 20 THEN
        DoNotInitiateMacroShort() // Liquidity overrides DCF valuation models
    END IF
END PROCEDURE
Focus on Balance-Sheet Plumbing: Disregard rumors of secret futures buying. Track the real levers that drive modern liquidity: Net Fed Liquidity (Total Assets−TGA−ON RRP\text{Total Assets} - \text{TGA} - \text{ON RRP}Total Assets−TGA−ON RRP), high-yield credit spreads, and foreign exchange swap utilization.
Track the Options Gamma Environment: Follow dealer gamma profiles. When the market is in a deep “long gamma” state, volatility is dampened by dealer hedging; when it falls into a “short gamma” state, sharp drops and rapid V-shaped recoveries are generated by automated market-maker adjustments, not state intervention.
Account for the Passive Flow Multiplier: Every dollar of bank reserve liquidity that enters the financial system is routed through automated 401(k) allocations, channeling capital disproportionately into the largest cap-weighted market leaders.
Trade the Structure That Exists: Avoid shorting a liquidity-driven market based on traditional valuation metrics alone. In a financial system where systemic risk is managed by the state, multiple expansion can persist far longer than traditional valuation models suggest.
Disclaimer: This analysis is provided for macroeconomic research, historical analysis, and market microstructure education. It does not constitute financial, investment, or legal advice. Market microstructure, regulatory rules, and monetary facilities evolve with policy adjustments made by the Federal Reserve and the U.S. Department of the Treasury.