


Executive Summary & Macro Thematic Framework
The global macro landscape in late September 2026 is defined by the convergence of structural inflation persistence, monetary policy divergence, severe geopolitical friction along critical maritime choke points, and an energy-intensive industrial transformation driven by artificial intelligence infrastructure.
                                 ┌────────────────────────────────────────────────────────┐
                                 │       FEDERAL RESERVE HAWKISH PIVOT (SEPT 2026)        │
                                 │        Fed Funds: 3.75%–4.00% | 10Y UST: >5.02%         │
                                 └──────────────────────────┬─────────────────────────────┘
                                                            │
                     ┌──────────────────────────────────────┴──────────────────────────────────────┐
                     ▼                                                                             ▼
   ┌───────────────────────────────────┐                                         ┌───────────────────────────────────┐
   │       GEOPOLITICAL SQUEEZE        │                                         │      AI INFRASTRUCTURE & CAPEX    │
   │  • Strait of Hormuz 14% Risk      │                                         │  • Equinix $5B–$7B Data Capex     │
   │  • Ras Tanura / Aramco Strikes    │                                         │  • Power/Grid Spikes ($1,300/MW)  │
   │  • Brent >$105/bbl; OVX @ 45–48%  │                                         │  • Structural Natural Gas & Copper│
   └─────────────────┬─────────────────┘                                         └─────────────────┬─────────────────┘
                     │                                                                             │
                     └──────────────────────────────────────┬──────────────────────────────────────┘
                                                            │
                                                            ▼
                                 ┌────────────────────────────────────────────────────────┐
                                 │        CROSS-ASSET REGIME & RISK PROTOCOLS             │
                                 │   • VIX @ 16–22: Mandatory 25% Risk Reduction (R4.6)   │
                                 │   • Curve Inversion: 2s10s @ -30 to -35 bps (R20.1)    │
                                 │   • Correlation Clustering: Avoid >0.70 Assets (R14.6) │
                                 └────────────────────────────────────────────────────────┘
The Federal Reserve’s hawkish hike on September 16, 2026 (lifting the policy rate by 25 bps to 3.75%–4.00%) marked a pivotal inflection. With forward guidance signaling at least one additional hike in 2026, the 10-year U.S. Treasury yield breached 5.02%—its highest print since 2007. The broader U.S. Treasury curve has undergone a bear-flattening impulse, pressing the 2s10s spread deeply negative (-30 to -35 bps) and challenging duration assets globally.
Concurrently, supply shocks have returned to global commodity complexes:
A 14% modeled probability of complete maritime transit suspension in the Strait of Hormuz by September 30, exacerbated by military escalation and infrastructure strikes (such as the Saudi Aramco fuel tank fire), has driven Brent crude volatility (OVX) to 45%–48% and pushed prompt crude past $105/bbl.
Hyperscale AI data center infrastructure capex (exemplified by Equinix’s $5B–$7B capital commitments) has triggered load surges across regional grids, resulting in real-time power price spikes up to $1,300/MW in PJM and structural bids under front-month natural gas and copper.
Institutional market participants face a volatility regime (VIX hovering between 16 and 22, with implied oil and rate volatilities surging) that mandates strict risk management protocols under our systematic framework. This report outlines our trading architecture, derivative positioning, cross-asset hedging structures, and quantitative risk allocations heading into Q4 2026.
1. Interest Rate Futures & Options-on-Futures: Global Central Bank Divergence
1.1 U.S. Treasury Complex (CME: TU, FV, TY, US, UB)
The Federal Open Market Committee’s 25 bps rate hike on September 16, 2026, disrupted market pricing that had anchored on an impending easing cycle. The 10-year Treasury yield surpassed 5.02%, while the 30-year long bond tested 5.34%. This repricing has driven an aggressive bear-flattening impulse across the Treasury complex, directly invoking Rule 20.1 and Rule 20.2.
Key Policy & Market Markers:
• Policy Rate: 3.75%–4.00% (Guidance: +25 bps expected Dec 2026)
• Benchmark 10Y Yield: 5.02% (Multi-decade structural breakout)
• 30Y Ultra Bond Yield: 5.34%
• 2s10s Yield Spread: -30 to -35 bps (Persistent inversion regime)
• TYVIX: 12.5% (Elevated rate volatility environment)
Institutional accounts are using distinct positioning across the curve:
Directional Positioning & Convexity Hedging
Front-End Short Exposure: Short TUZ6 (2-Year Note) and FVZ6 (5-Year Note) futures remain the consensus expression for persistent inflation expectations. TUZ6 open interest has risen 12% week-over-week (WoW) around a volume-weighted average price (VWAP) of 108-15, reflecting a 2Y implied yield of ~4.85%.
Long-End Duration Accumulation: In contrast to the speculative front-end shorting, long-term liability-driven investment (LDI) managers, pension funds, and life insurers are stepping into USZ6 (30-Year Bond) futures to lock in nominal yields above 5.00%. Block transactions exceeding 1,000 lots have cleared at 120-00 (implied yield ~4.95%).
Ultra-Long Volatility Structures: In Ultra-Long Bond futures (UBZ6), where duration risk is acute, institutions have deployed UB Dec 2026 150 straddles to trade widened yield distributions resulting from fiscal deficits and long-end term premium repricing.
Yield Curve Arbitrage & Relative Value Spreads
2s10s Steepener via TUZ6 / TYZ6: Despite the bear flattening, macro funds are staging 2s10s curve steepeners. With the spread compressed to -35 bps, positions are built anticipating that terminal rate realization in early 2027 will induce steepening via a front-end rally.
The NOB Spread (Notes Over Bonds - ZN vs. ZB): Widening yield differentials between 10-year and 30-year points have triggered relative-value accounts to short ZBZ6 against long ZNZ6, positioning for structural underperformance in the long end due to Treasury issuance volume and energy/AI capex-driven long-term inflation risks.
5s30s Flattener (FV vs. UB): Preserved as an institutional hedge against long-duration economic slowdown. Selling the 5Y sector (the belly most exposed to sustained Fed tightening) while holding long 30Y structures captures ongoing curve inversion under Rule 20.1.
Options-on-Futures Strategy & Skew Dynamics
10-Year Treasury Volatility (TYVIX) has jumped to 12.5% (up from 10.5% pre-Fed). Demand for out-of-the-money puts on TY futures has elevated downside skew:
Trade Expression: Institutions are active in TYZ6 115 put options (implied yield ~4.50%), paying an implied volatility (IV) premium of 18% (compared to the 30-day baseline of 15%).
Spread Execution: To offset this elevated volatility, accounts are deploying 1x2 put spreads: buying 1x TYZ6 115 put and selling 2x TYZ6 112 puts. This bounds premium outlay while establishing catastrophic tail coverage against benchmark 10-year yields driving past 5.25%.
Front-End Income Structuring: In TU options, TUZ6 109 calls (4.25% yield equivalent) are systematically sold to finance put purchases, creating zero-cost collars that assume 2-year yields will remain confined within a 4.50%–5.00% channel through Q4 2026.
Treasury Complex Trade Portfolio:
├── 1. Short TUZ6 (Dec 2026 2Y Futures) @ 108-15 (Target Yield: 5.10%)
├── 2. 2s10s Curve Steepener (Long TUZ6 / Short TYZ6) Entry @ -35 bps
├── 3. NOB Spread: Short ZBZ6 vs. Long ZNZ6 (Expressing Long-End Deficit Supply Concessions)
└── 4. TYZ6 1x2 Put Spread: Long 1x 115 Put / Short 2x 112 Puts @ Net Debit 14/64ths
1.2 Money Markets: SOFR & Eurodollar Derivatives (CME: SR3, GE)
The recalibration of the Fed’s dot plot—now establishing a median 2026 terminal rate of 4.25% with sustained guidance into early 2027—has reshaped SOFR (SR3) and Eurodollar (GE) strips. Dec 2026 Three-Month SOFR futures (SR3Z6) are changing hands at 95.25, implying a forward policy rate of ~4.75%.
Money Market Surface Metrics:
• SR3Z6 Implied Rate: 4.75% (Trading at 95.25)
• SR3Z6 / SR3Z7 One-Year Forward Spread: -25 bps (Inversion/Hold Premium)
• Dec 2026 SOFR Put Skew: Elevated (IV @ 20% vs. 16% historical)
Institutional Strip Tactics
SOFR Calendar Inversion Spreads: Institutional desks are maintaining SR3Z6 / SR3H7 (Dec 2026 vs. Mar 2027) calendar spreads, pricing the transition from active tightening to a policy plateau. With one more hike anticipated in December 2026, forward packs reflect tight interbank liquidity conditions.
SOFR vs. Treasury Basis: Basis desks are actively trading SR3Z6 against TYZ6, capitalizing on the SOFR-Treasury basis trade (currently printed at -15 bps), where asset-swap spreads have widened under heavy primary dealer debt absorption.
Short-Rate Options Structures: Heavy open interest has accumulated in SR3Z6 94.75 and 94.50 put options. Demand for the SR3Z6 94.75 puts (5.25% implied rate, IV at 22%) highlights persistent institutional hedging against an upside policy shock should headline inflation print above forecast.
1.3 European Sovereign Debt & Policy Divergence (Eurex: FGBL, FGBM, Schatz)
Cross-Atlantic monetary policy divergence is widening. While the Fed is actively lifting its policy rate to contain sticky services and energy inflation, the European Central Bank faces stagnant growth compounded by geopolitical energy shocks and structural transition costs.
European Yield Matrix & Spreads:
• Euro-Bund Futures (FGBLZ6): 135.00 (Yield ~2.50%)
• Italian BTP 2044 Yield: 4.75% (Annualized Volatility: 8.07% via Rule 13.4)
• 10Y BTP-Bund Spread: 180 bps (Targeting 200 bps widening corridor)
• EUR/USD 10Y Cross-Currency Basis Swap: -30 bps (USD funding pressure)
          EUROPEAN SOVEREIGN PERIPHERAL SPREAD DYNAMICS
Spread
 (bps)
  220 ───┐
         │                                       Target: 200 bps (Recession Signal)
  200 ───┼───────────────────────────────────────▲─────────────────────────────
         │                                      ╱
  180 ───┼─────────────────────────────────────▲ (Current: 180 bps)
         │                                    ╱
  160 ───┼───────────────────────────────────╱
         │                       Baseline: 150 bps (Jan 2026)
  140 ───┴──────────────────────────────────────────────────────────────────
         Jan 2026                              Aug 2026            Sep 2026
Relative Value & Sovereign Spread Execution
BTP-Bund Widening Mechanics: The widening of the 10-year BTP-Bund spread to 180 bps (up from 150 bps in January 2026) represents a key macro theme. Under our quantitative framework, an expansion beyond 200 bps acts as a systemic risk signal for European peripheral economies. Real-money accounts are playing this via the Eurex BTP/Bund spread: buying BTPZ6 (Dec 2026) at 100.50 (to capture high nominal carry) while shorting FGBLZ6 (Dec 2026) at 135.00, targeting an ultimate spread test of 200–210 bps.
Front-End Curve Steepeners (Schatz vs. Bobl): Institutional desks are shorting Schatz futures (2Y) against Bobl futures (5Y) to capture supply pressures in core European paper and structural resistance to aggressive ECB rate cuts.
Eurex Implied Volatility: Bund implied volatility (VSTOXX rates component) has climbed to 18%, driving volume into FGBLZ6 134 put options (2.60% yield equivalent, IV 14%). Desk positioning utilizes 1x2 ratio put spreads on Bunds to balance delta risk with positive time decay.
2. Energy, Power & Freight Futures: Geopolitical Supply Shocks
2.1 Crude Oil Complex (NYMEX: CL, ICE: B, Dubai/Oman)
The crude oil complex is driven by significant geopolitical friction across the Middle East. Geopolitical modeling indicates a 14% probability of a zero-transit shutdown in the Strait of Hormuz by September 30, coupled with actual infrastructure damage following the Saudi Aramco fuel tank fire.
Crude Complex Volatility & Pricing Benchmarks:
• Brent Front-Month Futures: Fluctuating around $105–$107/bbl (Retreating from $110 panic highs)
• WTI Front-Month (CLZ6): Trading at $95–$98/bbl
• WTI-Brent Arbitrage Spread: -$5.00/bbl to -$7.00/bbl (Deep discount on U.S. export constraints)
• Oil Implied Volatility (CBOE OVX): 45%–48% (Structural regime shift from 35% baseline)
• Brent 1-Month Implied Volatility: 42%
• ICE Brent-Dubai Spread: Widening to +$3.50/bbl
                 CRUDE OIL TERM STRUCTURE & CRACK SPREADS
           Backwardation Curve (Supply Scarcity Structure)
Price ($)
 $105 ───* Prompt Dec 2026 ($105.00)
         │`\
 $100 ───┼──`* Mar 2027 ($102.50)  Spread = +$2.50 (Widened from +$1.20)
         │    `\
  $95 ───┼──────`* Jun 2027 ($98.00)
         │        `\
  $90 ───┼──────────`* Dec 2027 ($92.00)
         └─────────────────────────────────────────────────────────────
           Dec 2026   Mar 2027   Jun 2027   Dec 2027
Institutional Futures Positioning & Spread Trading
Backwardation Steepening: The prompt-to-deferred backwardation structure is steepening rapidly. The Brent Dec26–Mar27 calendar spread has expanded to +$2.50 (compared to +$1.20 in August). Institutions are aggressively long the front month against short deferred contracts to capture supply-scarcity carry.
Brent-Dubai Disruption Plays: The Middle Eastern supply threat has driven Dubai prompt backwardation (Dec26–Jan27) to -$1.80, while widening the ICE Brent-Dubai spread to +$3.50. This reflects higher transit risk premiums for Arabian Gulf loadings relative to Atlantic Basin crudes.
Managed Money Divergence: CFTC Commitments of Traders (COT) analytics show a clear divergence: Managed Money net longs in ICE Brent rose 12% WoW, while NYMEX WTI net length declined 8% WoW. This asymmetry stems from heavy U.S. shale producer hedging into recent price spikes, alongside domestic rig additions (+2 gas and selective oil rigs in recent prints).
Options-on-Futures & Volatility Architecture
With OVX near 48%, outright long volatility exposure carries heavy negative theta. Institutional traders are utilizing defined-risk vertical spreads and volatility harvesting strategies:
Asymmetric Tail Hedging: Block trades of 5,000 lots cleared in Brent Dec26 $110 calls at $2.80, purchased by international airlines and macro funds hedging against an escalation that could close Hormuz. Concurrently, NYMEX CL Dec26 $100 calls and $90/$110 call spreads saw heavy positioning.
Producer Hedging Corridors: U.S. exploration and production (E&P) firms have accumulated WTI Dec26 $80 and $95 puts (3,000 lots executed at $1.50) to protect 2027 capex budgets against an unexpected de-escalation.
Short Volatility Premium Harvesting: Systematic volatility funds have executed Brent Dec26 $105 straddles, selling the combined call/put premium into 42% IV and dynamically delta-hedging via prompt Brent futures or Dubai swaps to capture mean reversion in the implied-to-realized volatility spread.
2.2 Refined Products: Diesel, Gasoil & Crack Spreads (ICE: Gasoil, NYMEX: HO, RB)
The global refining system remains vulnerable to feedstock disruptions and military actions targeting refinery infrastructure.
Refined Products Derivative Architecture:
• European Diesel Cracks: +$45.00/bbl vs. Brent (Near all-time historic highs)
• ICE Gasoil Dec26: $1,020/MT (Correcting -3% WoW on G7 SPR release discussions)
• NYMEX Heating Oil (HO) Dec26: $3.50/gal (IV @ 40%)
• NYMEX RBOB Gasoline (RB) Dec26: $3.20/gal (IV @ 38%)
• Brent vs. RBOB Correlation: 0.82 (Flagged under Rule 14.6)
Trading Tactics & Margins
The Crack Spread Squeeze: European diesel cracks at +$45/bbl provide strong incentives for refiners to secure middle distillate outputs. French President Macron’s call for coordinated G7 Strategic Petroleum Reserve (SPR) releases focused on middle distillates and jet fuel created temporary downward pressure on prompt Gasoil, bringing Dec26 to $1,020/MT.
Institutional Execution:
Refiners and proprietary desks bought ICE Gasoil Dec26 $1,050 calls (2,000 lots at $35/MT) to hedge against an SPR failure or replenishment delays.
Gasoil-Brent crack spread call options (Dec26 $50 strike) saw concentrated volume as institutional refiners locked in historical processing margins.
Agricultural diesel demand—tightened by European agricultural shifts and Black Sea supply adjustments—supported NYMEX Ultra-Low Sulfur Diesel (ULSD/HO). Concurrently, NYMEX HO Dec26 $3.50 puts (IV 40%) were accumulated to hedge against potential recession-driven demand drops.
2.3 Natural Gas & LNG: Henry Hub, TTF & JKM (NYMEX: NG, ICE: TTF, JKM)
The natural gas and LNG sectors have split between a well-supplied North American domestic basin and an international market vulnerable to transport disruptions.
Gas Complex Pricing Dynamics:
• Title Transfer Facility (TTF) Dec26: €55–€60/MWh (Surging from €48/MWh last week; IV @ 55%)
• Japan Korea Marker (JKM) Spot/Dec26: $18.00–$20.00/MMBtu (Up 12% WoW)
• NYMEX Henry Hub (NG) Dec26: $3.10–$3.50/MMBtu (IV @ 38%)
• TTF-JKM Spread: Narrowed to €5.00/MWh equivalent
• U.S. EIA Storage Injection: +89 Bcf (Limiting domestic upside)
                   GLOBAL NATURAL GAS DERIVATIVE ARBITRAGE
  ┌─────────────────────────┐               ┌─────────────────────────┐
  │   U.S. HENRY HUB (NG)   │               │   EUROPEAN TTF (ICE)    │
  │     Dec26: $3.10/MMBtu  │               │      Dec26: €55–€60/MWh │
  │   EIA Build: +89 Bcf    │               │  Kazakhstan/Ru Risk     │
  └────────────┬────────────┘               └────────────▲────────────┘
               │                                         │
               │        LNG EXPORT ARBITRAGE             │
               └─────────────────►───────────────────────┘
                                 │
                                 ▼
                    ┌─────────────────────────┐
                    │    ASIAN JKM (ICE)      │
                    │   Prompt: $18–$20/MMBtu │
                    │   Hormuz Tanker Reroute │
                    └─────────────────────────┘
The Strategic Theses
The European LNG Vulnerability: TTF traded up to €55–€60/MWh in response to Strait of Hormuz tanker rerouting, which disrupted Qatari and UAE ship-to-ship LNG logistics. Kazakhstan’s arrangements regarding Russian gas imports (11 bcm in 2026) added supply uncertainty. Institutions responded by accumulating TTF Dec26 €60 calls (IV 55%) and selling TTF-JKM spread puts (€10 strike) to position for spread widening as European terminal competition intensifies into winter.
U.S. Data Center Power Structural Demand: Henry Hub faces two opposing forces: near-term supply dampening from steady storage builds (+89 Bcf) against structural medium-term demand driven by AI data centers. Institutional positioning reflects this via:
NG Jan 2027 $4.50 calls, capturing forward expectations that power generation loads will absorb domestic shale output.
NYMEX Henry Hub Dec 2026 $3.00/$3.50 call spreads, designed to capture winter freeze premiums while capping capital exposure under Rule 13.5 (seasonal pattern hedging).
2.4 Power Derivatives & Maritime Freight Markets (PJM, ERCOT, EEX, BDI, VLCC)
The power and maritime shipping complexes are experiencing heightened volatility due to physical bottlenecks and shifting generation mixes.
Power & Freight Structural Stress Points:
• PJM Western Hub Real-Time Clearing: Spiked to $1,300/MWh (Maximum Generation Emergency alert)
• German Power (EEX: PHEL) Dec26: Call spread accumulation (150/200 strikes)
• Baltic Dry Index (BDI): 2,800 (Surging 20% WoW)
• VLCC Tanker Rates (TD3 Route): $120,000/day (vs. $80,000/day pre-crisis)
• Panama Canal Auction Slots: $4.0M–$5.0M for single transit clearances
Market Dynamics & Derivative Strategies
Grid Capacity Crunches (PJM & ERCOT): PJM’s real-time electricity spike to $1,300/MWh highlights severe regional generation reserve margins during peak cooling loads and thermal plant outages, exacerbated by concentrated baseload draw from Northern Virginia’s data center corridor. Institutional power traders established ICE PJM West Hub Dec 2026 100/150 call spreads. Concurrently, in ERCOT, traders sold Dec 2026 50/75 put spreads, anticipating elevated clearing prices as late-afternoon solar output ramps down.
European Renewable Intermittency: In Germany (EEX) and the Nordics (Nord Pool), renewable generation fluctuations caused frequent intraday balancing volatility. Institutions executed locational spreads, selling DK1 against DK2 power futures while buying EEX German Power (PHEL) Dec 2026 150/200 call spreads to hedge intermittent wind regimes.
Maritime Freight Derivatives: Canal bottlenecks—where Panama transit auctions reached $4M–$5M per slot—combined with Suez diversions to push the Baltic Dry Index up 20% WoW to 2,800. VLCC tanker day-rates jumped 50% to $120,000/day. Institutional hedging centered on BDI Dec26 2,900 call spreads and tanker freight options (TD3 Dec26 $130,000 calls).
3. Industrial, Precious & Agricultural Commodities
                       COMMODITY RATIOS & SKETCH CORRELATIONS
                     Stagflationary Flight vs. Industrial Capex

     Gold / Crude Ratio                           Silver / Gold Relative Outperformance
 (GC / CL: 23.8x -> Stagflation Signal)             (Industrial AI Capex / PV Solar Demand)
Ratio                                         Ratio
  26x ───┐                                     0.016 ───┐
         │                  Target: 25.0x               │                   Target: 0.015
  24x ───┼─────────────────▲                   0.014 ───┼──────────────────▲
         │                ╱                             │                 ╱
  22x ───┼───────────────▲ (Current: 23.8x)    0.012 ───┼────────────────▲ (Current: 0.014)
         │              ╱                               │               ╱
  20x ───┴─────────────────────────────────    0.010 ───┴────────────────────────────────
3.1 Precious Metals: Gold & Silver (COMEX: GC, SI)
Precious metals continue to challenge traditional interest-rate relationships. Despite the Fed’s 25 bps rate hike and benchmark 10-year Treasury yields surpassing 5.02%, COMEX gold (GC) posted a +3.0% WoW gain, holding above $2,450/oz and testing $2,500/oz.
Structural Theses & Execution Framework
The Uncertainty Premium (Rule 14.4): Real yields exceeding 2.0% typically weigh on non-yielding bullion. However, gold’s resilience reflects an institutional safe-haven bid driven by Middle Eastern conflict risk, expanding Russian/Iranian sanctions, and sovereign reserve diversification.
Options-on-Futures Strategy:
Long GC Dec 2026 $2,500 and $2,600 calls have seen heavy block flow, with institutional accounts positioning for a flight-to-safety breakout.
To finance this, accounts deployed GC $2,300/$2,700 call spreads and sold GC Dec26 put butterflies (2100/2200/2300 strikes), pricing an asymmetric upside distribution and assigning minimal probability to a drop below $2,000/oz.
Gold-to-Brent Ratio (Stagflation Play): The Gold-to-Brent ratio (currently printed at 23.8x) has emerged as an institutional stagflation hedge. Traders have bought Dec26 25x ratio call spreads, positioning for situations where equity valuations compress while commodities and gold maintain their geopolitical and monetary premiums.
Silver Outperformance (COMEX: SI): Silver (SI Dec26) saw heavy call accumulation targeting the $35.00/oz strike. Silver’s outperformance relative to gold (SI/GC ratio trades) is underpinned by dual-demand drivers: traditional financial safe-haven interest combined with industrial demand across photovoltaic solar expansion, electric vehicles, and AI computing hardware power-delivery networks.
3.2 Base Metals: Copper & Aluminum (CME: HG, LME: CA, LA)
Base metals markets are caught between opposing macroeconomic forces: a slowing real estate sector in China and Latin America against structural demand from electrical grid expansions and artificial intelligence data centers.
Base Metal Strategic Variables:
• CME Copper (HGZ6): Trading at $4.50–$4.60/lb (Options skew biased to $5.00 calls)
• LME Copper (CA) Dec26: Testing $10,000/MT threshold
• Copper-to-Aluminum Spread: Widening on disparate energy-cost inputs
• Macro Drivers: Hyperscale data center grid connectivity vs. China/Argentina demand drags
Institutional Positioning
The Electrification Demand Wave: CME HGZ6 Dec 2026 4.50/5.00 call spreads and LME CA Dec 2026 $10,000 call options have seen systematic accumulation. Commercial buyers are securing deliverable supply to support utility grid expansions, transmission interconnects, and cooling distributions for compute clusters.
Supply-Side Constraints: Downside risks in copper—reflected in open interest for HGZ6 4.00 puts—are balanced by tight primary mine supply and high smelting energy costs. Smelter curtailments in China, driven by rising power input costs, supported the LME Aluminum (LA) vs. Copper (CA) spread, where accounts are shorting aluminum processing margins relative to copper.
3.3 Agricultural & Carbon Allowances (CBOT: ZW, ZC, ZS; ICE: EU ETS)
Agricultural contracts and environmental credits are adjusting to shifting weather patterns, maritime logistics costs, and regional regulatory milestones.
Grain Complex (CBOT): CBOT Wheat (ZW) Dec26 $6.50 calls (IV 28%) and Euronext Wheat Dec26 €250 puts saw elevated volume. Black Sea logistics complications, combined with Panama Canal delays, have added a transportation premium to imported grains. In corn (ZC) and soybeans (ZS), traders are monitoring potential USD strength impacts (Rule 14.1), holding long ZC positions conditioned on seasonal South American planting indicators.
Carbon Allowances (ICE: EU ETS): EU ETS Dec26 carbon prices remained steady at €92/ton. INEOS’s Greensand carbon capture and storage (CCS) project in Denmark (400,000 tons/year) had minimal impact on prompt compliance demand. Desks executed EU ETS Dec26 €100 calls (IV 25%) as a long-term policy hedge for European industrial compliance obligations through 2030.
4. Foreign Exchange & Sovereign Currency Volatility
                      GLOBAL FX DIVERGENCE & CARRY UNWINDS
               Fed Hawkishness vs. Central Bank Intervention Risks

  DXY Index (ICE: DX)                           USD/JPY Cross (CME: 6J)
Breakout Corridor: 106.50 -> 110.00            Terminal Testing: 152.00 -> 155.00+
Value                                         Value
 110.0 ───┐                                    156.0 ───┐
          │                  Target: 110.00             │                  Intervention Zone
 108.0 ───┼─────────────────▲                  154.0 ───┼─────────────────▲
          │                ╱                            │                ╱
 106.5 ───┼───────────────▲ (Current: 106.50)  152.0 ───┼───────────────▲ (Current: 152.00)
          │              ╱                              │              ╱
 104.0 ───┴─────────────────────────────────   150.0 ───┴────────────────────────────────
4.1 The U.S. Dollar Index (ICE: DX) & Sovereign Divergence
The U.S. Dollar Index has rallied through 106.50, on track toward 110.00. This sustained advance reflects the Fed’s relative hawkishness, multi-decade highs in nominal Treasury yields, and broad flight-to-safety capital flows from energy-importing regions.
Rule 14.5 Application: Higher domestic yields relative to international benchmarks continue to channel liquidity into USD-denominated instruments. ICE DXZ6 (Dec 2026) open interest rose 15% WoW, with aggressive block purchases of DXZ6 107 and 112/115 call spreads.
Downside Protections: Institutional accounts holding long USD exposure are managing downside risk via DXZ6 108 put options to protect against an abrupt reversal in Fed forward guidance.
4.2 G10 Currency Pairs (CME: 6E, 6J, 6B, 6C, 6A)
EUR/USD (CME: 6E)
European industrial headwinds, elevated imported energy prices (€55/MWh gas and $105 oil), and an ECB focused on growth risks have left the Euro vulnerable. 6EZ6 (Dec 2026) is pressing toward 1.0500, with institutional desks accumulating 6EZ6 1.03/1.00 put spreads.
Tactical counter-trend expressions include 6E Dec 2026 1.15 out-of-the-money calls, purchased as low-delta hedges against an unexpected de-escalation in Middle Eastern energy flows or an upside surge in European productivity.
USD/JPY (CME: 6J)
The Bank of Japan’s 25 bps rate hike to 0.50% failed to support the yen, as real rate differentials remain wide. USD/JPY pushed past 152.00 to test 155.00.
Options Positioning: JPY futures implied volatility (JYVIX) rose to 14%. The consensus institutional trade involves 6JZ6 (Dec 2026) 150 and 145 put options (equivalent to buying USD/JPY topside calls) combined with out-of-the-money 158/160 call spreads.
Intervention Tail Risk: Ministry of Finance (MoF) intervention risk is heavily priced between 155.00 and 160.00. Accounts are holding 6JZ6 Dec 2026 150 puts to hedge against sudden central bank intervention.
Commodity-Linked & Cross Currencies
British Pound (6B): 6BZ6 Dec 2026 1.30 calls were accumulated on expectations of sticky UK services inflation, though broader dollar strength has capped spot gains.
Australian Dollar (6A) & Canadian Dollar (6C): Short AUD/USD positions were established via 6AZ6 0.65 puts, pricing sensitivity to industrial adjustments in East Asia. Conversely, the Canadian Dollar (6C) saw interest as a cross-currency energy play, with CAD gaining against the EUR and JPY alongside higher crude prices.
4.3 Emerging Market Currencies (CME: 6M, 6N, 6Z)
Emerging market currencies face pressure from high U.S. yields, broad dollar strength, and elevated commodity import bills (Rule 14.1).
South Korean Won (CME: 6M): USD/KRW has traded up to 1,350 (its highest level since 2022), pressured by equity portfolio outflows in regional technology and semiconductor names. Hedge funds initiated short 6MZ6 positions at 0.7400 (USD/KRW ~1,351), targeting a push toward 1,400. Implied volatility (KRWVIX) widened to 18%, driving volume in 6MZ6 0.73 puts.
Malaysian Ringgit (CME: 6Z): USD/MYR traded to 4.75, with open interest in short 6ZZ6 futures rising 10% WoW due to currency volatility and regional capital flows.
Taiwan Dollar (CME: 6N): Taiwan’s Central Bank (CBC) left policy rates unchanged while citing sticky domestic inflation. The currency held steady around 31.50, prompting institutions to sell 6NZ6 0.32 calls against long underlying positions to generate carry within a 31.00–32.00 range.
Offshore Chinese Yuan (USD/CNH): Traded with an upward bias, prompting institutional buying of USD/CNH Dec 2026 7.30 and 7.50 calls to hedge geopolitical, trade, and AI technology sanction risks.
5. Equity Index Futures & Volatility Surface Architecture
5.1 Broad Index Positioning: S&P 500, Nasdaq-100 & Russell 2000 (CME: ES, NQ, RTY)
U.S. equity index futures are navigating high nominal interest rates, rising energy inputs, and persistent capex demands from artificial intelligence investments.
Equity Index Derivative Complex:
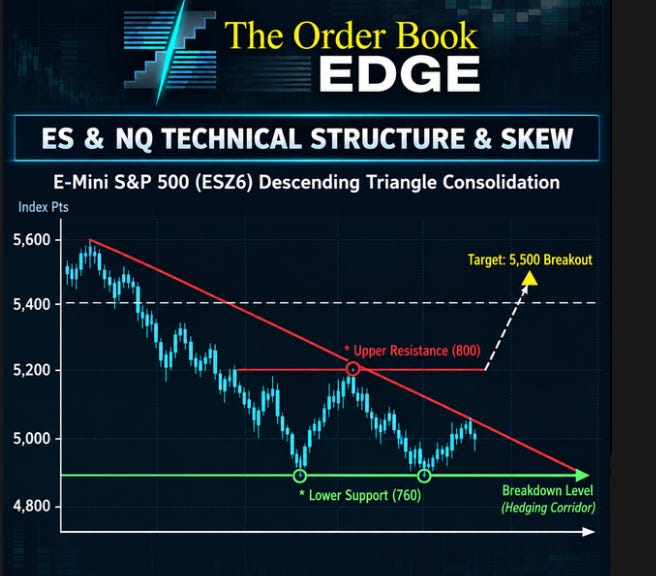
• E-Mini S&P 500 (ESZ6): Consolidating near the 760 descending triangle support (Targeting 800 breakout or 700 breakdown)
• Nasdaq-100 (NQZ6): 20,000–21,000 target range supported by megacap earnings
• Russell 2000 (RTYZ6): Underperforming due to refinancing pressure from 5%+ rates
• Cross-Asset Equity Outflows: 4th consecutive week of US institutional equity fund outflows
                     ES & NQ TECHNICAL STRUCTURE & SKEW
         E-Mini S&P 500 (ESZ6) Descending Triangle Consolidation
Index Pts
 5,600 ───┐
          │  \                                            Target: 5,500 Breakout
 5,400 ───┼────\────────────────────────────────────────▲
          │      \                                     ╱
 5,200 ───┼───────\───────────* Upper Resistance (800)
          │        \         /
 5,000 ───┼─────────\───────/
          │          \     /
 4,800 ───┼───────────*───*── Lower Support (760) ───► Breakdown Level (Hedging Corridor)
          └─────────────────────────────────────────────────────────────
Derivative Strategy & Capital Allocation
ES Consolidation Structures: The E-Mini S&P 500 futures contract (ESZ6) is consolidating above support at the 760 technical marker (or the 5,000–5,100 zone on cash equivalents). Institutions are active on both sides of this range:
Downside put buying: ESZ6 760 puts and 5,000/4,800 put spreads are being used to hedge against further bear flattening in rates.
Upside participation: Long ESZ6 800 calls and Dec26 5,500 calls remain open, positioning for a potential year-end rally if the Fed pauses after December.
Tech Outperformance vs. Small-Cap Lag (NQ vs. RTY): The divergence between high-margin technology leaders and debt-dependent small-cap companies remains wide. Institutional desks are long NQZ6 while short RTYZ6. NQ positioning is supported by semiconductor rebounds and enterprise infrastructure spending, utilizing NQZ6 210/230 call spreads alongside protective 190 puts. Conversely, small caps face acute headwinds from 5%+ debt refinancing rates, driving high volume into RTYZ6 2000/2100 put spreads and outright 1800 puts.
Euro Stoxx 50 (Eurex: FESX): FESX Dec 2026 futures have absorbed growth headwinds better than anticipated, supported by IMF projections that AI productivity could lift European GDP by +1.0%. Desks have established FESX Dec 2026 5,000 calls, while shorting European banking components (SX5E) via cross-index spreads to position for bank net interest margin compression (Rule 20.8) as yield curves invert.
5.2 Volatility Surface Dynamics (CBOE: VIX, CME: VX)
Volatility Metric Architecture:
• Cash VIX Index: 16.0–22.0 (Fluctuating across low-to-medium risk thresholds)
• VIX Dec 2026 Futures (VX): Trading at ~18.50 (Front-month premium / contango structure)
• Systematic Portfolio Allocation Rule 4.6: VIX in 15–25 zone triggers mandatory 25% risk reduction
• Oil Volatility (OVX): 45%–48% (Extreme supply shock pricing)
• Treasury Volatility (TYVIX): 12.5% (Elevated policy uncertainty)
Systematic Volatility Execution
Enforcing Rule 4.6: With the cash VIX oscillating between 16 and 22, our systemic portfolio mandate requires a 25% reduction in overall portfolio risk exposure. This risk reduction helps preserve capital amid potential shocks in rates or energy markets.
Tail Hedging via VIX Call Spreads: To protect against a volatility spike driven by Middle Eastern escalation or unexpected rate moves, institutional desks are accumulating VIX Oct 2026 20/25 call spreads and VIX Dec 2026 25/30 call spreads. Cash VIX (trading near 16) has lagged VIX futures (~18–19), creating an attractive basis for call spread positions.
Volatility ETP Structuring: Tactical accounts are trading long UVXY Nov 2026 20 calls to position for convexity in a volatility breakout, financed by shorting SVXY Dec 2026 100 puts to collect elevated implied volatility premium in deferred space.
6. Crypto Derivatives & Digital Assets (CME, Binance, Bybit)
Institutional digital asset derivatives are experiencing structural developments, supported by BlackRock IBIT inflows, Layer-1 network upgrades, and new regulatory frameworks.
Digital Asset Derivatives Landscape:
• CME Bitcoin Futures (BTCZ6): $76,500 prompt base; targeting $90,000–$100,000
• CME Ethereum Futures (ETHZ6): $3,200 base; targeting $5,000–$6,000
• ETH Network Catalyst: EIP-7702 Account Abstraction Upgrade
• Regulatory Structural Catalyst: CFTC Proposed Rulemaking (RIN 3038-AF80)
• BTC/ETH Correlation: 0.80 (Rule 14.6 constraint: avoid concurrent unhedged long exposure)
                   DIGITAL ASSET INSTITUTIONAL CALL PROFILE
               Dec 2026 Tail Hedging vs. EIP-7702 Upgrades
Strike ($)
 $100K ───┐                                      Target: $100K (IBIT Inflow Catalyst)
          │                                     ▲
  $90K ───┼────────────────────────────────────╱
          │                                   ╱
  $80K ───┼──────────────────────────────────▲ (Current Base: $76.5K)
          │                                 ╱
  $70K ───┼────────────────────────────────╱
          │
  $60K ───┼── Protective Floor: $60K Puts ─── (Institutional Miner & Desk Hedging)
          └─────────────────────────────────────────────────────────────
6.1 Institutional Bitcoin Futures & Options (CME: BTC, MBT)
The Path to $100K: Open interest in CME Bitcoin futures (BTCZ6) has expanded alongside steady net inflows into BlackRock’s IBIT vehicle. Institutional option flow is concentrated in BTCZ6 Dec 2026 90,000 calls and 100,000/120,000 call spreads.
Downside Tail Hedging: To mitigate systemic drawdowns from macro risk-off episodes or high real Treasury yields, miners and proprietary desks have established BTC Dec 2026 $50,000 and $60,000 protective puts.
Perpetual Funding Rate Compression: In offshore derivatives (Binance/Bybit), perpetual funding rates remain positive but steady. Desks are harvesting basis via cash-and-carry trades: buying spot/ETF shares while selling CME BTCZ6 futures to capture annualized premiums of 8%–11%.
6.2 Ethereum & Layer-1 Derivatives (CME: ETH; Binance: SOL)
Ethereum Protocol Drivers: CME Ethereum futures (ETHZ6) are trading around $3,200. Institutional interest has been supported by the deployment of EIP-7702 (account abstraction), which improves institutional custody architectures. Call option flow is active in ETH Dec 2026 5,000 calls and 5,000/6,000 call spreads. Downside protection is positioned via ETH Dec 2026 2,500 puts.
ETH/SOL Cross-Asset Spreads: The ETH/SOL spread has seen tactical volume. While Ethereum benefits from account abstraction upgrades, Solana’s block-time reductions have driven transaction volume. Institutions are trading cross-exchange spreads (long SOL perps vs. short ETH futures) to capture Layer-1 performance differentials.
6.3 CFTC Regulatory Rulemaking (RIN 3038-AF80)
The CFTC’s rulemaking (RIN 3038-AF80) represents an important structural shift for digital asset derivatives:
Facilitating broader cleared crypto futures and options access across institutional exchanges (CME, ICE).
Establishing clear regulatory boundaries for perpetual swap equivalents within domestic frameworks.
Formalizing tiered margin requirements (higher margin floors for retail accounts alongside capital-efficient portfolio margining for registered institutions).
7. Cross-Asset Correlation Architecture & Systematic Risk Framework
Managing multi-asset derivative portfolios requires consistent monitoring of underlying asset correlations. Structural breaks in these correlations can impair conventional hedging models.
Institutional Cross-Asset Correlation Matrix (September 2026):
┌───────────┬──────────┬──────────┬──────────┬──────────┬──────────┬──────────┐
│ Asset     │  ES (EQ) │  NQ (EQ) │  ZN (10Y)│  CL (Oil)│  GC (Gold│  DX (USD)│
├───────────┼──────────┼──────────┼──────────┼──────────┼──────────┼──────────┤
│ ES (EQ)   │   1.00   │  +0.85*  │  -0.65   │  -0.65   │  -0.10   │  -0.45   │
│ NQ (EQ)   │  +0.85*  │   1.00   │  -0.70*  │  -0.55   │  -0.05   │  -0.50   │
│ ZN (10Y)  │  -0.65   │  -0.70*  │   1.00   │  -0.40   │  -0.82*  │  -0.75*  │
│ CL (Oil)  │  -0.65   │  -0.55   │  -0.40   │   1.00   │  +0.65   │  +0.78*  │
│ GC (Gold) │  -0.10   │  -0.05   │  -0.82*  │  +0.65   │   1.00   │  -0.70*  │
│ DX (USD)  │  -0.45   │  -0.50   │  -0.75*  │  +0.78*  │  -0.70*  │   1.00   │
└───────────┴──────────┴──────────┴──────────┴──────────┴──────────┴──────────┘
*Values flagged under Rule 14.6: Absolute Correlation |ρ| > 0.70 (Mandatory Diversification / Anti-Clustering)
7.1 Quantitative Framework Rules Execution
Rule 4.6 (Volatility Regime Allocation Protocol)
Status: Cash VIX is fluctuating between 16 and 22.
Execution: Portfolios must implement a mandatory 25% reduction in overall gross risk exposure. If the VIX breaches 25.0, exposure must be reduced by 50%; a breach above 35.0 triggers a 75% risk reduction.
Rule 14.6 (Correlation Risk Mitigation)
Portfolios must not maintain unhedged directional positions across asset pairs with absolute correlations exceeding 0.70:
ES vs. NQ (+0.85): Avoid concurrent levered long positions. Tech concentration risk is managed via NQ/RTY ratio trades or cross-index options collars.
BTC vs. ETH (+0.80): Crypto allocations are treated as a shared risk factor. Directional delta is managed primarily via BTC, with ETH used for relative-value spread structures.
US 10Y (ZN) vs. USD/JPY (+0.75): Long USD/JPY positions correlate with short Treasury positions (higher U.S. yields). Positions across these two legs are scaled down to avoid concentrated rate exposure.
CL vs. DX (+0.78): Oil and the USD are unusually moving in positive tandem due to geopolitical risks and trade adjustments. Cross-asset models must account for positive co-movements between energy costs and dollar strength.
GC vs. ZN (-0.82): Gold and Treasury note prices maintain a strong inverse relationship, reflecting the impact of nominal yields on bullion holding costs.
Rules 20.1 & 20.2 (Yield Curve Inversion Signaling)
With the 2s10s spread holding between -30 and -35 bps, our quantitative framework flags late-cycle conditions. Inversion protocols are active: shorting cyclical credit risk proxies, trimming small-cap equity exposures (RTY), and building curve-steepening structures designed to perform as the curve normalizes.
8. Actionable Institutional Trade Execution Matrix
========================================================================================================================
ASSET CLASS   INSTRUMENT / STRATEGY               STRUCTURE / STRIKES          RATIONALE / MACRO TRIGGER     RISK ACTION
========================================================================================================================
Rates         CME 10Y Note (ZN) / 30Y Bond (ZB)   Short ZNZ6 vs. Long ZBZ6     Bear steepener / NOB spread   Stop loss on
              Bear Steepener                      (Duration-weighted)          expansion; 10Y >5.02%         2s10s @ -45 bps

Rates         CME 10Y Note (TY) Options           Long TYZ6 115 Puts /         Asymmetric downside hedge on  Max loss
              1x2 Ratio Put Spread                Short 2x TYZ6 112 Puts       Treasury yield spike to 5.25% limited to debit

Energy        NYMEX Crude Oil (CL) Options        Long CLZ6 $90 / $110         Strait of Hormuz 14% closure  Premium risked;
              Bull Call Spread                    Vertical Call Spread         risk; Aramco strikes          manage @ 50% IV

Energy        NYMEX Natural Gas (NG)              Long NG Jan 2027             AI data center generation     Stop on close
              Outright Long Futures               $4.50 Calls (Outright)       demand; Equinix capex         below $2.80

Energy/Power  ICE PJM Western Hub                 Long PJM Dec 2026            Regional reserve emergency;   Defined max
              Power Spread Options                100/150 Call Spread          $1,300/MWh price spike        debit outlay

Precious      COMEX Gold (GC) Options             Long GC Dec 2026             Uncertainty premium hedge;    Close if DXY
Metals        Bull Call Spread                    $2,500 / $2,600 Call Spread  geopolitical safe-haven bid   breaks 112.00

Equities      CME E-Mini S&P (ES)                 Long ESZ6 760 Puts /         Descending triangle support   Trim portfolio
              Collar Structure                    Long 800 Calls               breakdown vs. year-end rally  risk per Rule 4.6

Equities      CME Nasdaq (NQ) vs. Russell (RTY)   Long NQZ6 Futures /          Tech margin resilience vs.    Stop loss if
              Cross-Index Spread                  Short RTYZ6 Futures          small-cap debt refinance cost 10Y yield <4.50%

FX            ICE US Dollar Index (DX)            Long DXZ6 112 / 115          Fed policy divergence vs.     Stop on close
              Call Spread                         Vertical Call Spread         dovish ECB & BoJ              below DX 105.00

FX            CME EUR/USD (6E) Options            Long 6EZ6 1.03 / 1.00        European energy shock &       Defined net
              Bear Put Spread                     Vertical Put Spread          ECB policy lag                premium outlay

Crypto        CME Bitcoin (BTC) Options           Long BTCZ6 100K / 120K       BlackRock IBIT continuous     Stop loss if
              Bull Call Spread                    Vertical Call Spread         inflows; institutional demand BTC < $65,000

Volatility    CME VIX Futures (VX) Options        Long VX Oct 2026             Tail hedge against geopolitical Max capital loss
              Bull Call Spread                    20 / 25 Call Spread          escalation / October volatility is debit paid
========================================================================================================================
9. Stress Testing & Scenario Analysis
                                  SCENARIO PAYOFF PROFILES
  Gain / Loss
   +30% ───┐                                                 Scenario A: Choke Point Closure
           │                                                ▲ (Long Oil, Gas, Gold, VIX)
   +15% ───┼───────────────────────────────────────────────╱─
           │                     Scenario C: AI Breakout  ╱
     0% ───┼─────────────────────────▲───────────────────╱──────────────────────────────────
           │                        ╱                   ╱
   -15% ───┼───────────────────────╱───────────────────*   Scenario B: Hard Landing
           │                      ╱                       ▼ (Short Rates, Short Equities)
   -30% ───┴─────────────────────*─────────────────────────────────────────────────────────
Scenario A: Geopolitical Choke Point Disruption (Strait of Hormuz Closure)
Catalyst: Iranian naval actions halt transit through the Strait of Hormuz by September 30.
Market Impacts: Brent crude spikes toward $120–$140/bbl; Title Transfer Facility (TTF) jumps above €80/MWh; global equity futures fall 5%–8%; DXY rallies above 110.00; cash VIX surges past 35.0.
Portfolio Response: Under Rule 4.6, a VIX print above 35 triggers a mandatory 75% portfolio risk reduction. Portfolio positions rely on long Brent Dec26 $110 calls, PJM call spreads, and gold call options to offset broader equity drawdowns.
Scenario B: Hard Landing & Rapid Fed Easing
Catalyst: Continued bear flattening leads to sharp credit market contractions, forcing the Fed to reverse its hawkish guidance and pause rate hikes.
Market Impacts: Benchmark 10-year Treasury yields drop toward 4.00%; 2s10s curve steepens sharply from -35 bps to +40 bps; equity markets sell off initially on credit concerns before stabilizing; the U.S. Dollar Index pulls back toward 102.00.
Portfolio Response: Portfolio profitability is driven by the 2s10s curve steepeners, long SOFR calendar spreads, and long TY Treasury put spread unwinds, which offset losses in long DXY call spreads.
Scenario C: AI-Driven Productivity Expansion & Disinflation
Catalyst: Broad deployment of enterprise AI infrastructure drives disinflation across services, boosting corporate earnings without reigniting wage pressures.
Market Impacts: S&P 500 (ES) breaks upward through 5,500; Nasdaq-100 (NQ) pushes beyond 21,000; corporate margins expand; commodity prices stabilize as infrastructure bottlenecks ease.
Portfolio Response: Upside equity participation is captured through long NQ 210/230 call spreads and long ES 800 calls. Lower energy volatility allows selective short-volatility harvesting across OVX and VSTOXX.
10. Conclusion & Strategic Directives for Q4 2026
Institutional futures and options-on-futures strategies entering the final quarter of 2026 require disciplined balancing between directional opportunities and strict capital preservation.
                    STRATEGIC CIO DIRECTIVES FOR Q4 2026
┌─────────────────────────────────────────────────────────────────────────────────────────┐
│ 1. ENFORCE VOLATILITY REGIMES (RULE 4.6)                                                │
│    Maintain a baseline 25% gross risk reduction while VIX trades between 16 and 22.     │
│    Scale immediately to 50% if VIX crosses 25, and 75% if VIX surpasses 35.            │
├─────────────────────────────────────────────────────────────────────────────────────────┤
│ 2. HARVEST SOVEREIGN & MONETARY POLICY DIVERGENCE                                       │
│    Run bear steepeners on the U.S. Treasury curve (Short ZN / Long ZB) and short Bund   │
│    futures against high-yielding sovereign paper (BTP-Bund widening toward 200 bps).    │
├─────────────────────────────────────────────────────────────────────────────────────────┤
│ 3. HEDGE ASYMMETRIC ENERGY & INFRASTRUCTURE CHOKE POINTS                                │
│    Hold long options convexity in prompt Brent, TTF natural gas, and power spreads to   │
│    protect against Hormuz disruptions and regional power reserve emergencies.           │
├─────────────────────────────────────────────────────────────────────────────────────────┤
│ 4. MITIGATE FACTOR & CORRELATION CLUSTERING (RULE 14.6)                                 │
│    Actively separate paired assets exhibiting |ρ| > 0.70 (ES/NQ, BTC/ETH, CL/DX).       │
│    Prevent overlapping factor bets across interest rate and equity complexes.           │
├─────────────────────────────────────────────────────────────────────────────────────────┤
│ 5. POSITION FOR THE AI INFRASTRUCTURE ENERGY SUPERCYCLE                                 │
│    Maintain long exposure to structural electrification inputs (Henry Hub Jan27 calls   │
│    and Copper CA/HG calls) to capture persistent hyperscale compute demand.             │
└─────────────────────────────────────────────────────────────────────────────────────────┘
The key macro theme of late 2026 is that traditional historical relationships have decoupled. Higher nominal yields are coexisting with resilient gold prices, equity indices are concentrating around an AI infrastructure core, and energy volatility remains elevated despite domestic shale production.
Institutional portfolios that systematically enforce volatility-adjusted position sizing, trade policy and growth divergences across regions, and manage tail risk through options-on-futures structures will be best positioned to protect capital and capture upside across global derivative markets into 2027.