


Hawkish Fed, $94 Brent and the $4,000 gold line: the three forces behind this playbook.
Important disclaimer: please read first. This article is for education and research only. It is not financial, investment, tax or trading advice, and it is not a recommendation or solicitation to buy or sell any security, futures contract or option. Futures and options carry substantial risk of loss, and you can lose more than your initial margin. Every strike, premium, spread level and dollar P&L in the diagrams below is an illustrative example, not a live quote. Market levels quoted as “reported” come from a news-analysis report dated November 12, 2026 and may already be stale by the time you read this. Talk to a qualified, licensed professional before you trade.
Why this market needs structures, not just direction
Some weeks the tape tells you one story. This isn’t one of those weeks.
Read the headlines from November 12, 2026 side by side and they contradict each other. The October CPI print, released November 10, came in hotter than expected. Fed speakers leaned hard in the hawkish direction: one called for more tightening and warned that the AI investment boom could itself become an inflation engine, and another reportedly supported a 50-basis-point move. The market responded by pricing roughly an 86% probability of a December hike. The 10-year Treasury yield pushed toward 5% and the U.S. Dollar Index climbed to about 103, a one-year high. Sterling slid toward 1.32 and the Australian dollar fell to a ten-month low.
At the same time, the geopolitical tape was the opposite of calm. Brent printed $94 after U.S. comments that there was “no need for an Iran deal,” and reports said four tankers were struck by explosions in the Strait of Hormuz. Yet the same session’s EIA data showed a 4.7 million barrel crude build, with builds in gasoline and distillates as well. In metals, gold broke the $4,000 psychological level and then fell nearly 3% as rising yields raised the cost of holding a non-yielding asset. Silver slid into bear-market territory.
Then there’s crypto. The source material describes “extreme fear”. Bitcoin had fallen below its short-term holder cost basis of roughly $75,700 to about $71,300, and perpetual-swap liquidations were cascading. Ether fell below $2,000 with spot-ETF outflows near $700 million. A sweeping Democratic midterm result raised the prospect of tighter crypto regulation.
When the drivers point in different directions, a plain outright long or short futures position is a blunt tool. It pays when you’re right about direction and punishes you when you’re wrong, no matter why you were wrong. Institutional desks handle a market like this differently. They break each view into its parts, such as direction, timing, curve shape, volatility and correlation, and pick the structure that isolates the part they have an edge in while capping the parts they don’t.
That’s what this article does. It takes the November 12 news flow, turns it into eight specific options-on-futures and futures-spread structures, and walks through each one: the thesis, the structure, the entry logic, the risk, max gain and loss, breakevens, and what would prove it wrong. Every structure gets a payoff-at-expiry diagram. Where the math gets dense, you’ll find pseudocode instead of equations, so you can follow the logic or turn it into your own spreadsheet or script.
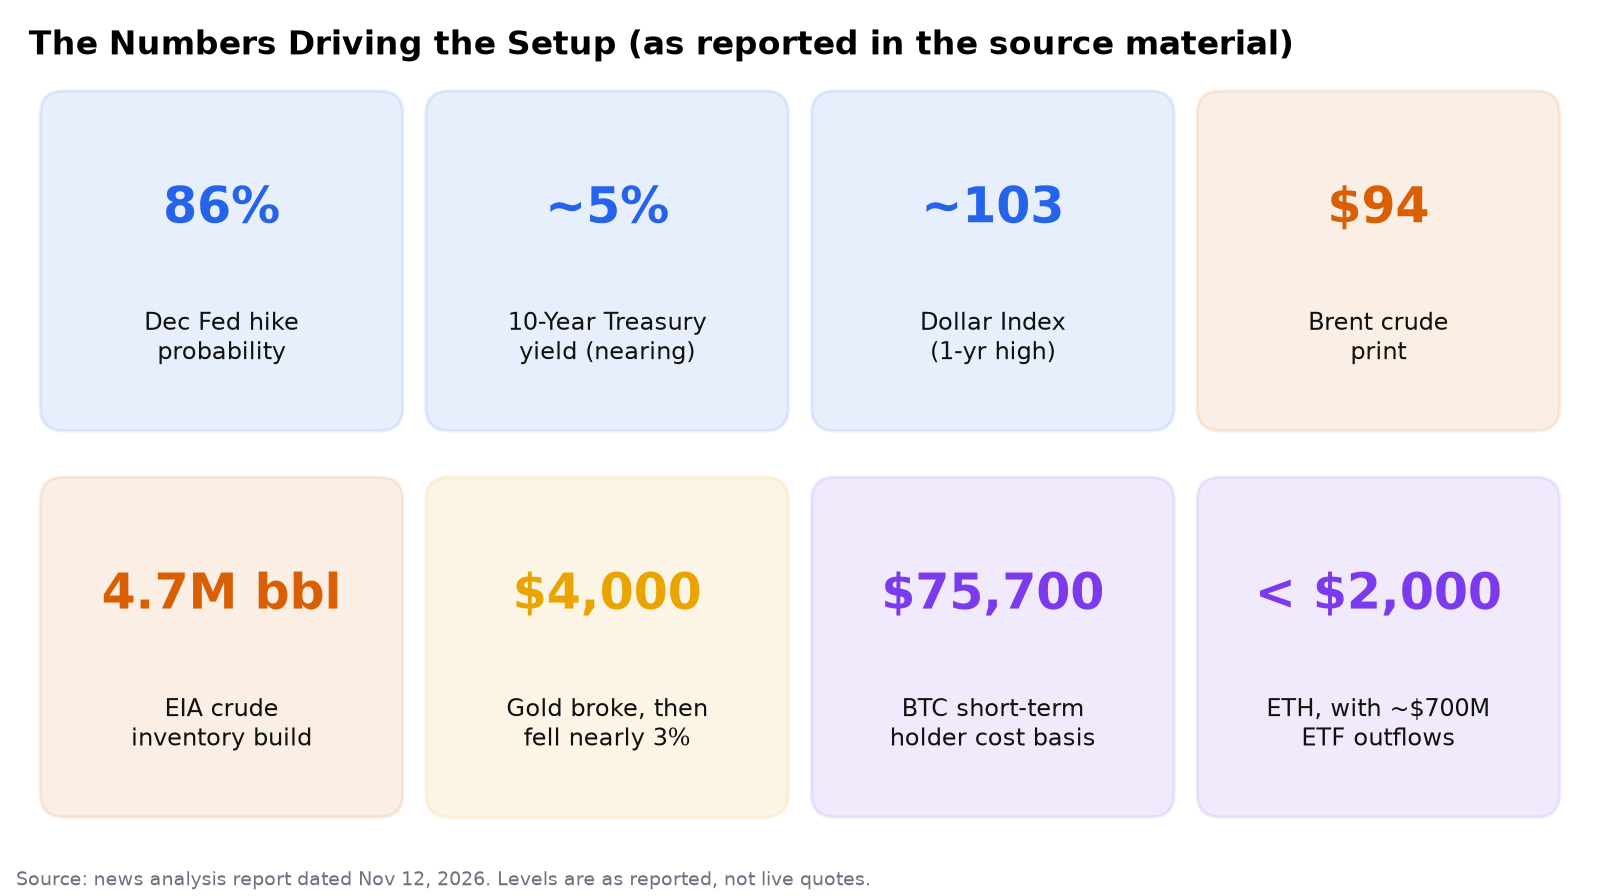
The reported levels behind this setup: hike odds, yields, the dollar, Brent, gold and crypto. These are as reported in the source news analysis, not live quotes.
The transmission map: from headlines to trades
Before getting to individual trades, it helps to see how the news fits together. Three clusters of headlines drive almost everything:
The hawkish rate cluster. Hot CPI, hawkish Fed speakers and a tight labor market (initial jobless claims were described as historically low) push front-end yields higher. That lifts the dollar and weighs on non-yielding assets like gold.
The geopolitical energy cluster. The Hormuz tanker strikes, the Iran rhetoric, Europe’s rush to buy Russian LNG ahead of a January ban (European gas rallied for a third straight day) and the start of winter heating demand add a risk premium to crude and gas. A large U.S. inventory build pushes the other way.
The crypto-stress cluster. Prices below key cost-basis levels, ETF outflows, liquidations and regulatory uncertainty after the midterms create a high-volatility, two-way market.
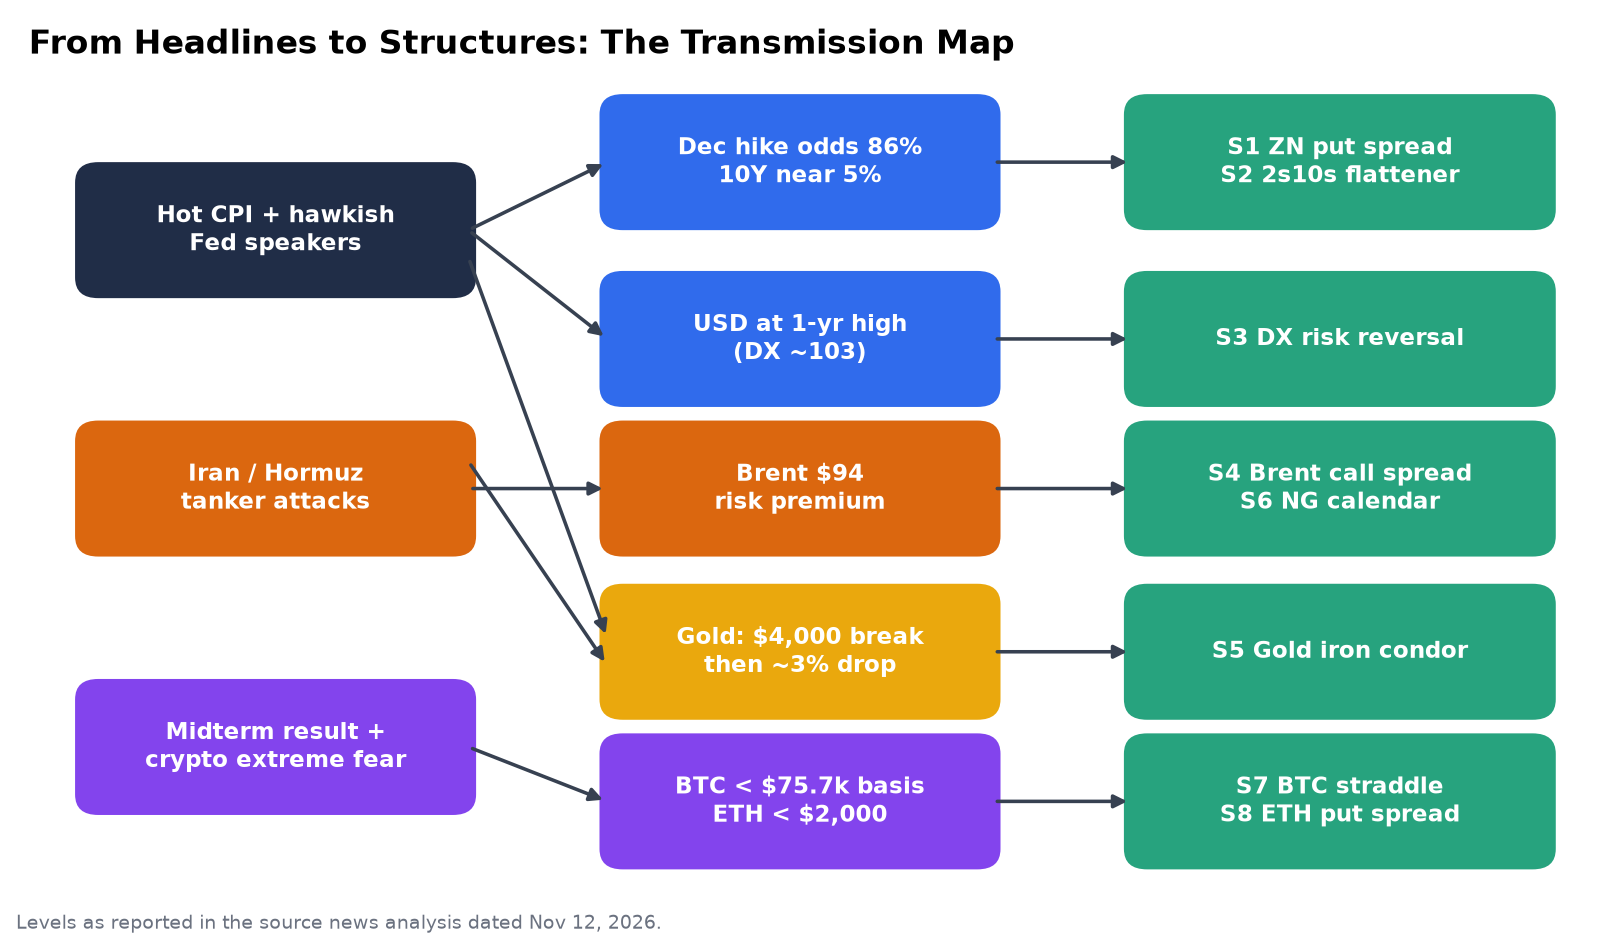
How the three headline clusters map onto the eight structures in this article.
The key point is that these clusters interact. Higher oil feeds inflation expectations, which supports the hawkish rates view. A stronger dollar normally pressures dollar-priced commodities, yet oil rallied anyway on supply fear. Gold is caught between an uncertainty bid and a real-yield headwind. A book that simply “goes short bonds, long dollar, short gold” is really one trade placed three times. We come back to that correlation trap near the end.
How to read the payoff diagrams
Every strategy section has a chart with the same layout:
The x-axis is the price of the underlying futures contract at option expiry, or the level of the spread for spread trades.
The y-axis is profit or loss in dollars, for the contract size noted on the chart.
Green shading marks the profit zone and orange shading marks the loss zone.
Dotted vertical lines mark the breakevens, labelled “BE”.
A blue dashed line marks the reference level. Where it’s labelled “source”, the level comes from the November 12 news material. Where it’s labelled “illustrative”, it’s a made-up anchor for the example.
Every chart is stamped ILLUSTRATIVE EXAMPLE. The strikes and premiums are hypothetical round numbers chosen to show the shape of the trade, not quotes you could trade on.
The general payoff logic for any options structure at expiry is simple enough to write as pseudocode:
# Payoff of a multi-leg options structure at expiry (pseudocode)
function structure_pnl(underlying_price, legs, net_premium, multiplier):
    total = 0
    for leg in legs:
        if leg.type == "call":
            intrinsic = max(underlying_price - leg.strike, 0)
        else:  # put
            intrinsic = max(leg.strike - underlying_price, 0)
        total += leg.quantity * intrinsic        # +1 for bought, -1 for sold
    total -= net_premium                          # debit paid (or + credit received)
    return total * multiplier
Breakevens are the underlying prices where that function crosses zero. Max profit and max loss are its highest and lowest values across the price range. That’s all the diagrams show.
Strategy 1: 10-Year Note (ZN) bear put spread
Theme: a hawkish repricing of duration, with defined risk.
The thesis from the news
This is the most direct expression of the week’s dominant story. Hot CPI, hawkish Fed speakers, roughly 86% odds of a December hike and a 10-year yield pushing toward 5% all point the same way: higher yields, and therefore lower Treasury futures prices. The source analysis notes that institutions are positioned short duration across the belly and long end, and that downside put skew in Treasury options is bid as real-money accounts cut duration.
So why not just short ZN futures? Because the same news flow has two-sided tail risk. A geopolitical shock (Hormuz) or a growth scare (the source flags record auto-loan stress on consumers) could spark a flight-to-quality bond rally almost overnight. A short futures position has open-ended risk in that case. A put spread doesn’t.
The structure (illustrative)
Buy one ZN 110 put
Sell one ZN 108 put
Net debit: 0.50 points ($500 per spread, at $1,000 per full point)
Same expiry, chosen to sit beyond the December policy decision
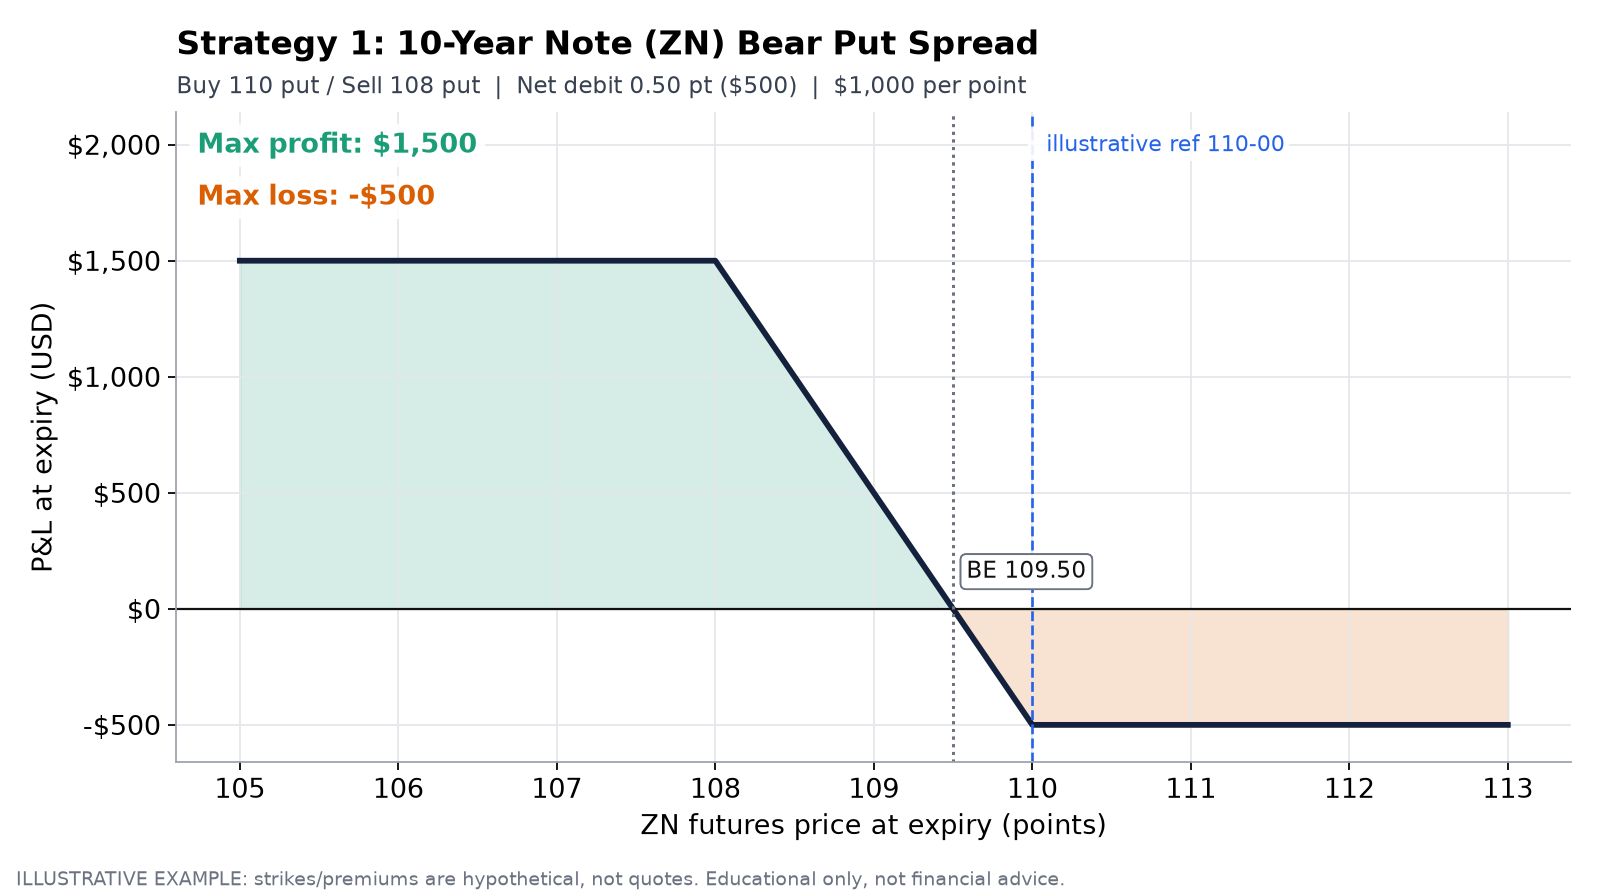
Strategy 1 payoff at expiry: ZN 110/108 bear put spread. Max loss is the $500 debit and max profit is $1,500 below 108. Illustrative strikes and premium.
The numbers
Max loss: the debit, $500. It’s realised if ZN finishes at or above 110.
Max profit: strike width minus debit, so 2.00 − 0.50 = 1.50 points, or $1,500. It’s realised at or below 108.
Breakeven: 110 − 0.50 = 109.50.
Reward-to-risk: 3:1.
Entry logic
The source makes a point that matters here: markets discount news fast. Daly’s comments and the CPI print were likely priced into rates within minutes. A disciplined entry doesn’t chase the move. It waits for a corrective bounce in ZN, a relief rally on a softer data point or a safe-haven bid, and buys the put spread into strength, when the puts are cheaper.
# Entry filter: buy the bear put spread on a relief bounce, not after the selloff
if hawkish_regime_confirmed and zn_bounced_from_recent_low_by >= bounce_threshold:
    if implied_vol_percentile < vol_ceiling:      # avoid overpaying for puts
        buy_put(strike = near_the_money)
        sell_put(strike = near_the_money - spread_width)
Risk and management
Theta. The spread loses value every day ZN goes nowhere. Long-dated puts decay slowly at first and then faster. See the time-decay chart later in this article.
Vega. A long put spread is roughly vega-neutral to slightly long vega near the money, so a volatility crush hurts less than it would on an outright put.
Take profits early. Many desks close a vertical at 50% to 75% of max profit rather than holding into expiry, when the last few ticks of value aren’t worth the gamma risk.
What invalidates it
A dovish surprise: a soft data print, or Fed speakers walking back hike expectations.
A flight-to-quality rally driven by a geopolitical shock or a growth scare.
Hike odds falling sharply from the mid-80s.
If any of these happen, the max loss is already known. That’s the point of the structure.
Strategy 2: the 2s10s bear flattener (short ZT / long ZN, DV01-neutral)
Theme: trade the shape of the curve, not its direction.
The thesis from the news
Hike expectations hit the front end of the curve hardest, because the 2-year note is basically a bet on the next few Fed meetings. The 10-year carries more term premium, growth expectations and long-run inflation views, and the source notes that recession signals (consumer debt stress) may cap long-end yields. The source analysis describes the 2s10s and 5s30s spreads trading as flatteners.
A flattener says: “I don’t need to know whether yields go up or down overall. I just need 2-year yields to rise faster than 10-year yields.”
The structure (illustrative)
Short 2-Year Note futures (ZT)
Long 10-Year Note futures (ZN)
Weighted so the package has equal dollar sensitivity per basis point (DV01) on each leg. A parallel shift in yields then roughly cancels out, and only the change in the spread drives P&L.
Here’s the DV01-matching logic as pseudocode instead of a formula:
# DV01-neutral curve spread sizing (pseudocode)
dv01_2y_per_contract  = lookup_futures_dv01("ZT")   # $ change per 1bp yield move
dv01_10y_per_contract = lookup_futures_dv01("ZN")

target_dv01 = 1000                                   # $ per bp of spread, chosen risk budget
n_10y = round(target_dv01 / dv01_10y_per_contract)
n_2y  = round(n_10y * dv01_10y_per_contract / dv01_2y_per_contract)

position = { "ZT": -n_2y, "ZN": +n_10y }             # flattener: short front, long back
pnl_approx = -target_dv01 * change_in_spread_bp      # spread = 10y yield - 2y yield
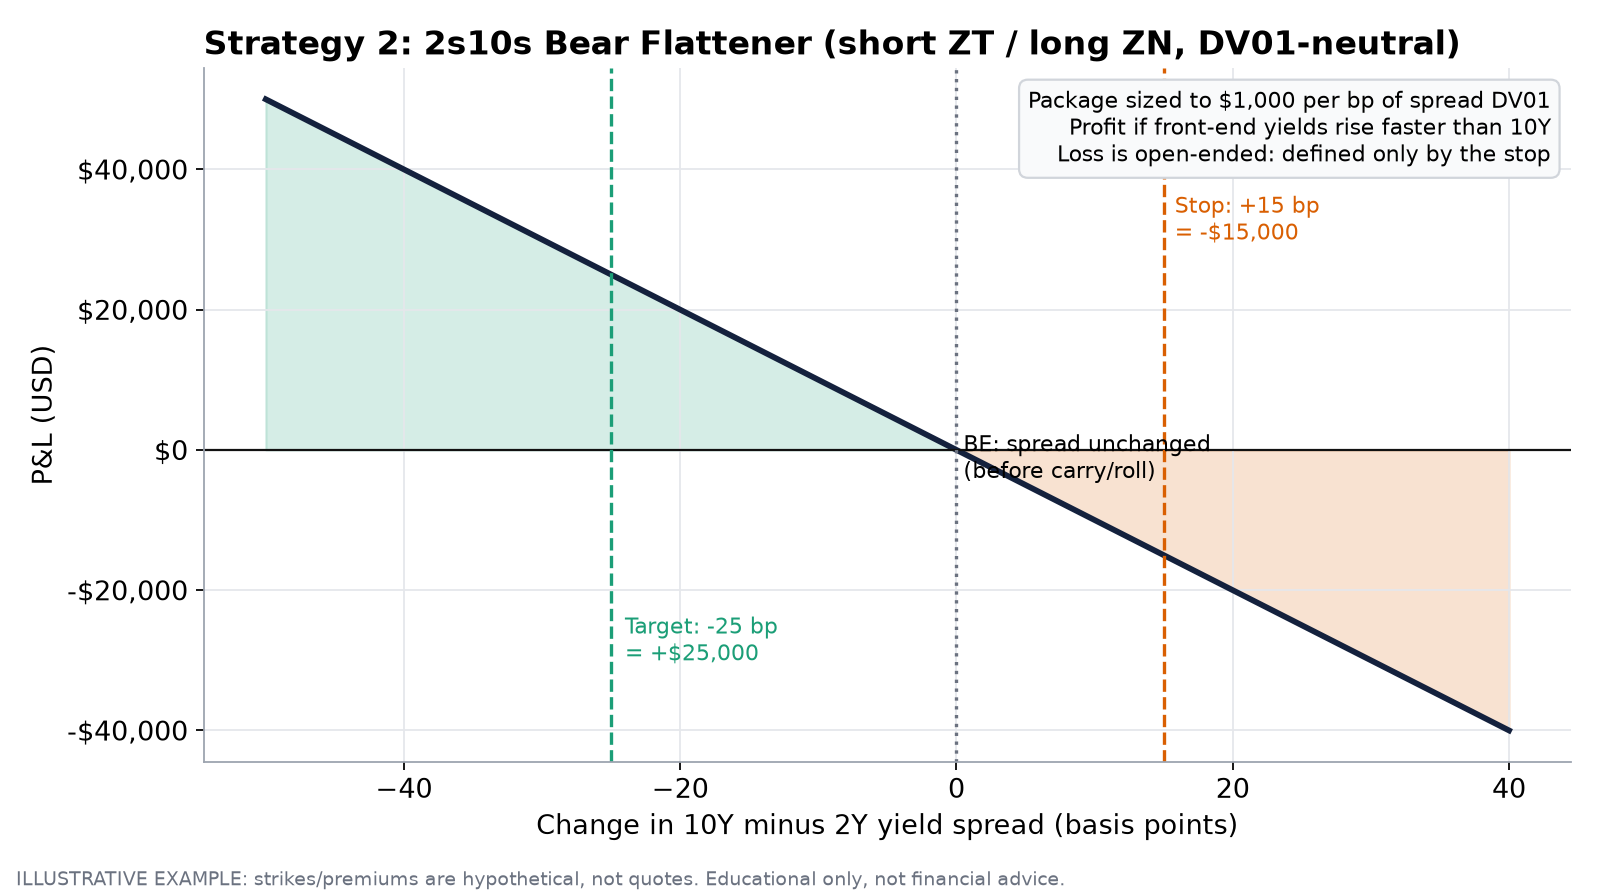
Strategy 2 payoff: a DV01-neutral 2s10s flattener sized at $1,000 per basis point. P&L is linear in the spread change, so the stop defines the risk. Illustrative sizing.
The numbers (illustrative, $1,000/bp package)
P&L: about −$1,000 for every 1bp the spread steepens, and +$1,000 for every 1bp it flattens.
Breakeven: spread unchanged, before carry and roll-down.
Target: −25bp, or about +$25,000.
Stop: +15bp, or about −$15,000.
Max loss: not capped by the structure. It’s defined only by the stop. That’s the main difference from the option trades in this article.
Entry logic and risk
Curve trades are slower and steadier than outright duration trades, and they usually need lower margin because exchanges recognise the offsetting legs. The risks are:
Bull steepening. If a growth shock makes the market price cuts, the front end rallies hardest and the curve steepens fast. This is the scenario that hurts flatteners most.
Bear steepening from supply. The source mentions fiscal supply and debt-auction pressure. Heavy long-end issuance can push 10-year yields up faster than 2-year yields.
DV01 drift. Hedge ratios change as yields move, so the package needs periodic rebalancing.
What invalidates it
A dovish pivot, a growth scare that brings forward rate-cut pricing, or a long-end supply shock that overwhelms Fed pricing. The source also flags that if 2s10s inverts deeply, that’s historically a recession warning. At that point, many desks take profits on flatteners and start building steepener hedges.
Strategy 3: U.S. Dollar Index (DX) zero-cost risk reversal
Theme: own the dollar’s upside, financed by selling the downside.
The thesis from the news
Higher U.S. rates attract capital and support the dollar. The source reports DX near 103, a one-year high, with sterling sliding toward 1.32, the Aussie at a ten-month low and the euro under pressure from Europe’s energy-security costs. It also reports USD-call skew in FX options, plus foreign corporate dollar borrowing that adds to dollar demand. The source names 102.50 as support and 103.50 as an upside target.
The structure (illustrative)
Sell one DX 102.50 put
Buy one DX 103.50 call
Net premium: approximately zero. The put premium funds the call.
$1,000 per index point
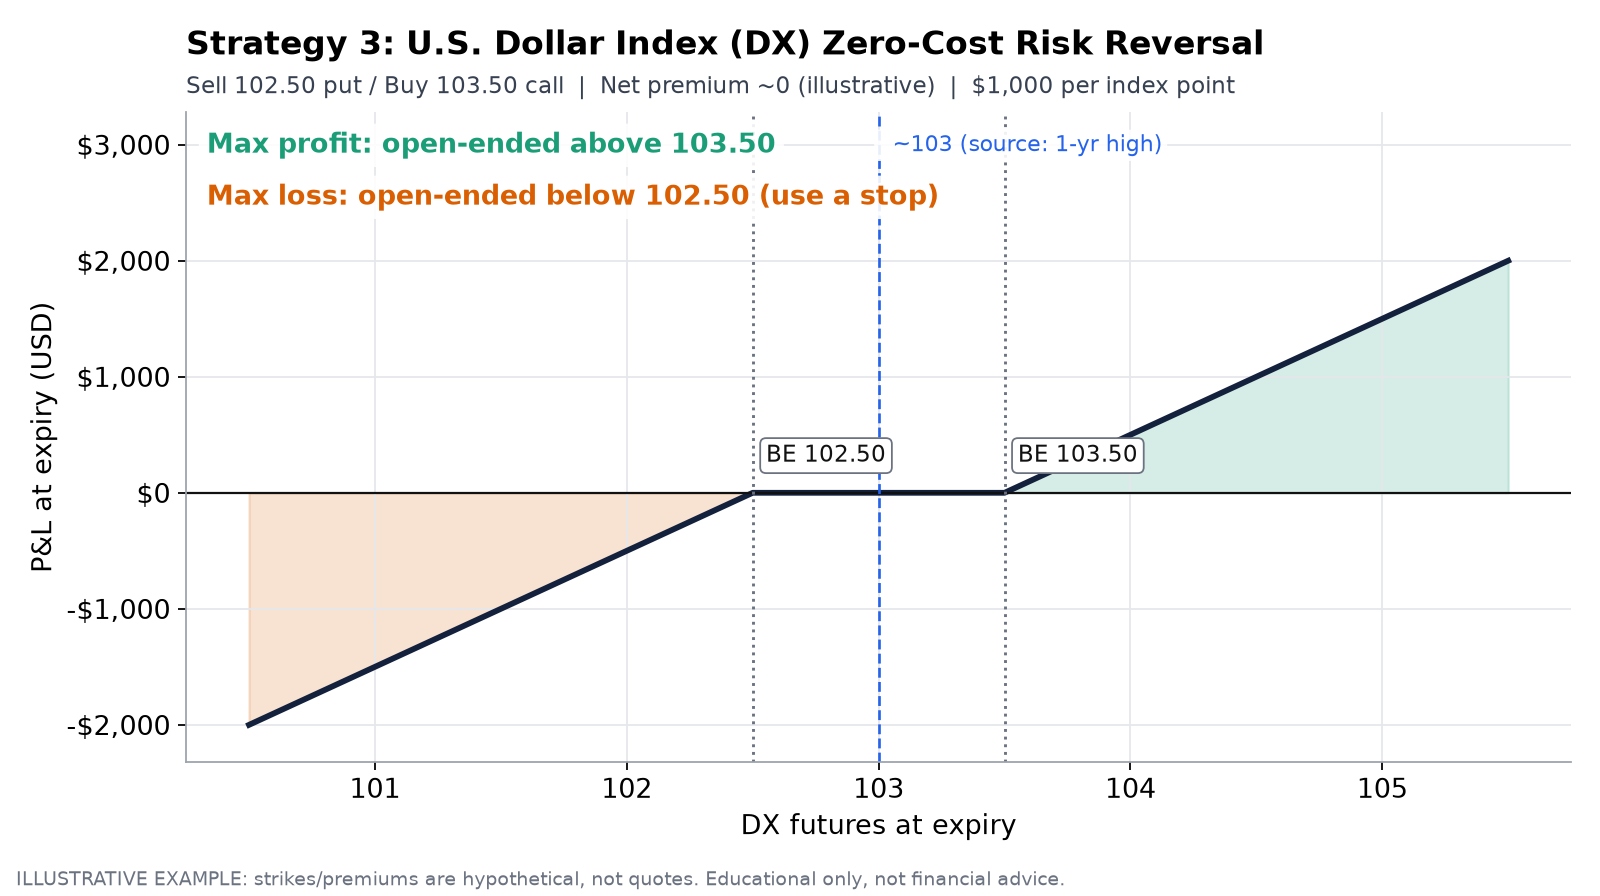
Strategy 3 payoff at expiry: DX 102.50/103.50 zero-cost risk reversal. It’s flat between the strikes, gains above 103.50 and loses below 102.50. Strikes are taken from the source’s support and target levels; premiums are illustrative.
The numbers
Between 102.50 and 103.50: P&L ≈ $0. You keep the view at no premium cost.
Above 103.50: +$1,000 per point. Open-ended.
Below 102.50: −$1,000 per point. Also open-ended. This is a synthetic long position with a dead zone, and it needs a stop.
Breakevens: 102.50 and 103.50 at zero cost.
Why a risk reversal instead of long futures?
Two reasons:
The dead zone. If the dollar chops around near 103, a long futures position bleeds on noise. The risk reversal sits flat.
Skew monetisation. When the market pays up for dollar calls, selling the put side lets you harvest richly priced downside premium to fund the upside. If skew is the other way round, the trade gets more expensive, and you should check before entering.
# Risk-reversal entry check (pseudocode)
put_premium  = quote("DX", put,  strike = support_level)
call_premium = quote("DX", call, strike = upside_level)
net = call_premium - put_premium
if net <= max_acceptable_debit:
    sell_put(support_level); buy_call(upside_level)
    set_stop(underlying < support_level - stop_buffer)   # the short put is the real risk
What invalidates it
A dovish Fed turn.
A sharp risk-on unwind of the dollar.
A coordinated policy response abroad.
The source also cautions that the one-year high means a lot of good news is already priced. Chasing the dollar at the highs is the classic “markets discount fast” mistake, so the risk reversal is best initiated on a pullback toward support, not at the peak.
Strategy 4: Brent crude bull call spread
Theme: pay a capped premium for Hormuz tail risk.
The thesis from the news
The source describes an energy complex that’s bifurcated: a bearish 4.7M-barrel U.S. crude build against a $94 Brent print and explosions on four tankers in the Strait of Hormuz. It argues the inventory data was likely already discounted, and that the new, tradeable information is the Hormuz attack vector. Because waterborne Brent is more exposed to Gulf disruption than U.S.-landlocked WTI, Brent is the cleaner instrument. The source also notes steep call skew in crude options and prompt-month backwardation.
The structure (illustrative)
Buy one Brent 95 call
Sell one Brent 105 call
Net debit: $3.00/bbl, or $3,000 per spread (1,000 barrels)
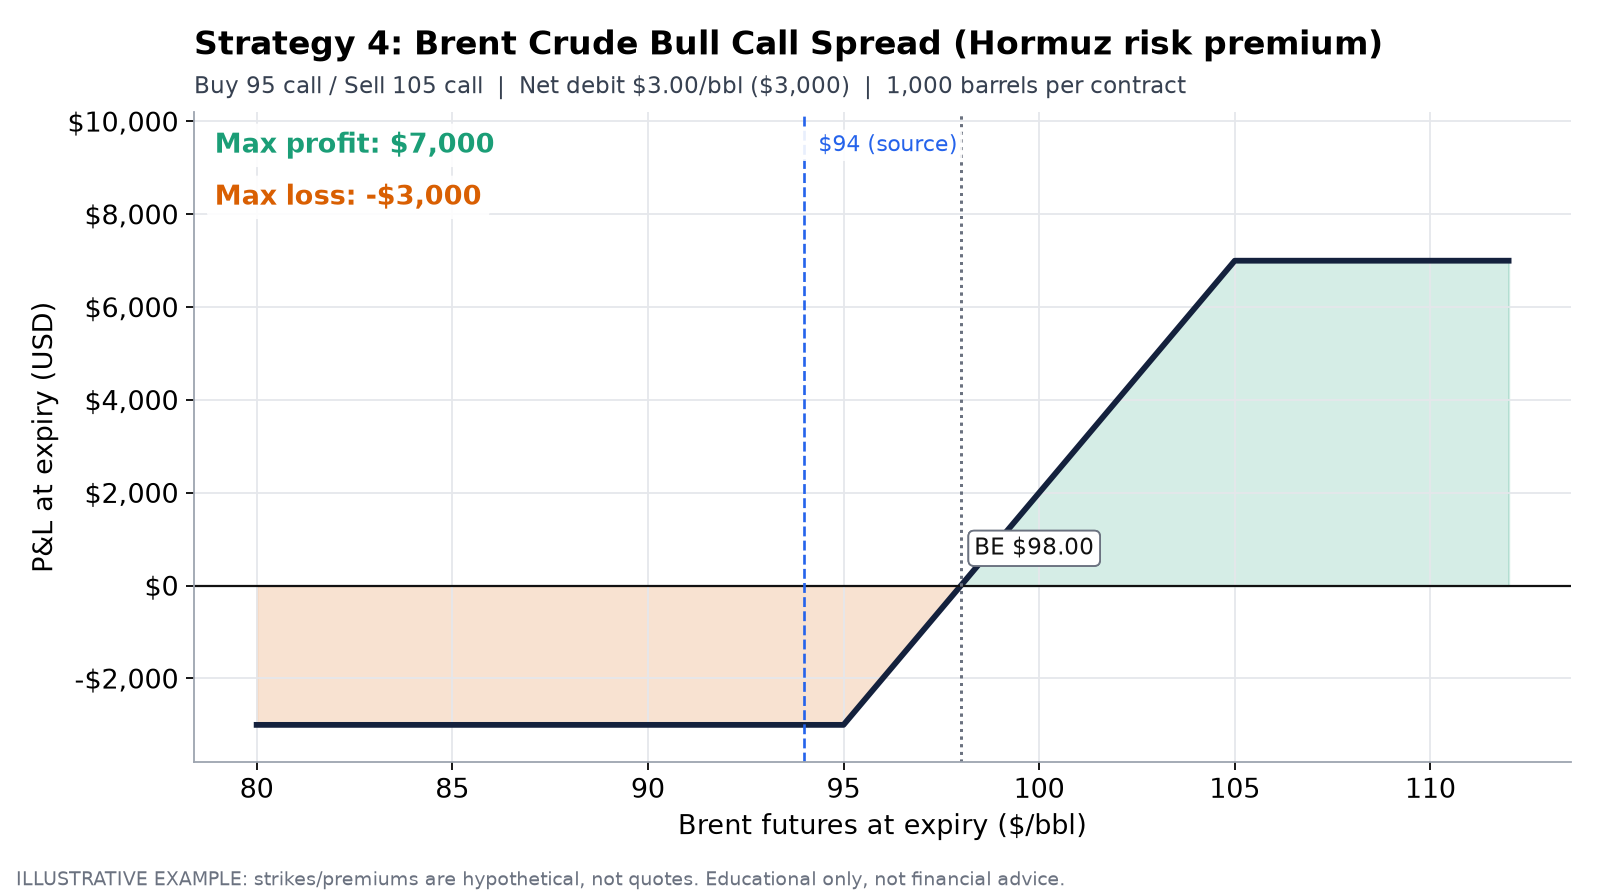
Strategy 4 payoff at expiry: Brent 95/105 bull call spread. Max loss is the $3,000 debit, max profit is $7,000 above $105, and breakeven is $98. The $94 reference is from the source; strikes and premium are illustrative.
The numbers
Max loss: $3,000, if Brent finishes at or below 95.
Max profit: (10 − 3) × 1,000 = $7,000, if Brent finishes at or above 105.
Breakeven: $98.00.
Reward-to-risk: about 2.3:1.
Why a call spread instead of an outright call?
When call skew is steep, upside strikes are expensive. Selling the 105 call sells back the most overpriced part of the curve and sharply cuts the debit. The cost is giving up the right tail above 105, but a true supply-shock tail is better hedged separately with a small, far-OTM call, if at all.
Mark-to-market matters as much as expiry
The payoff-at-expiry line is only the end state. Before expiry, a vertical spread trades as a smoothed version of that line. It moves less than the expiry payoff suggests, in both directions, because there’s still time value in both legs.
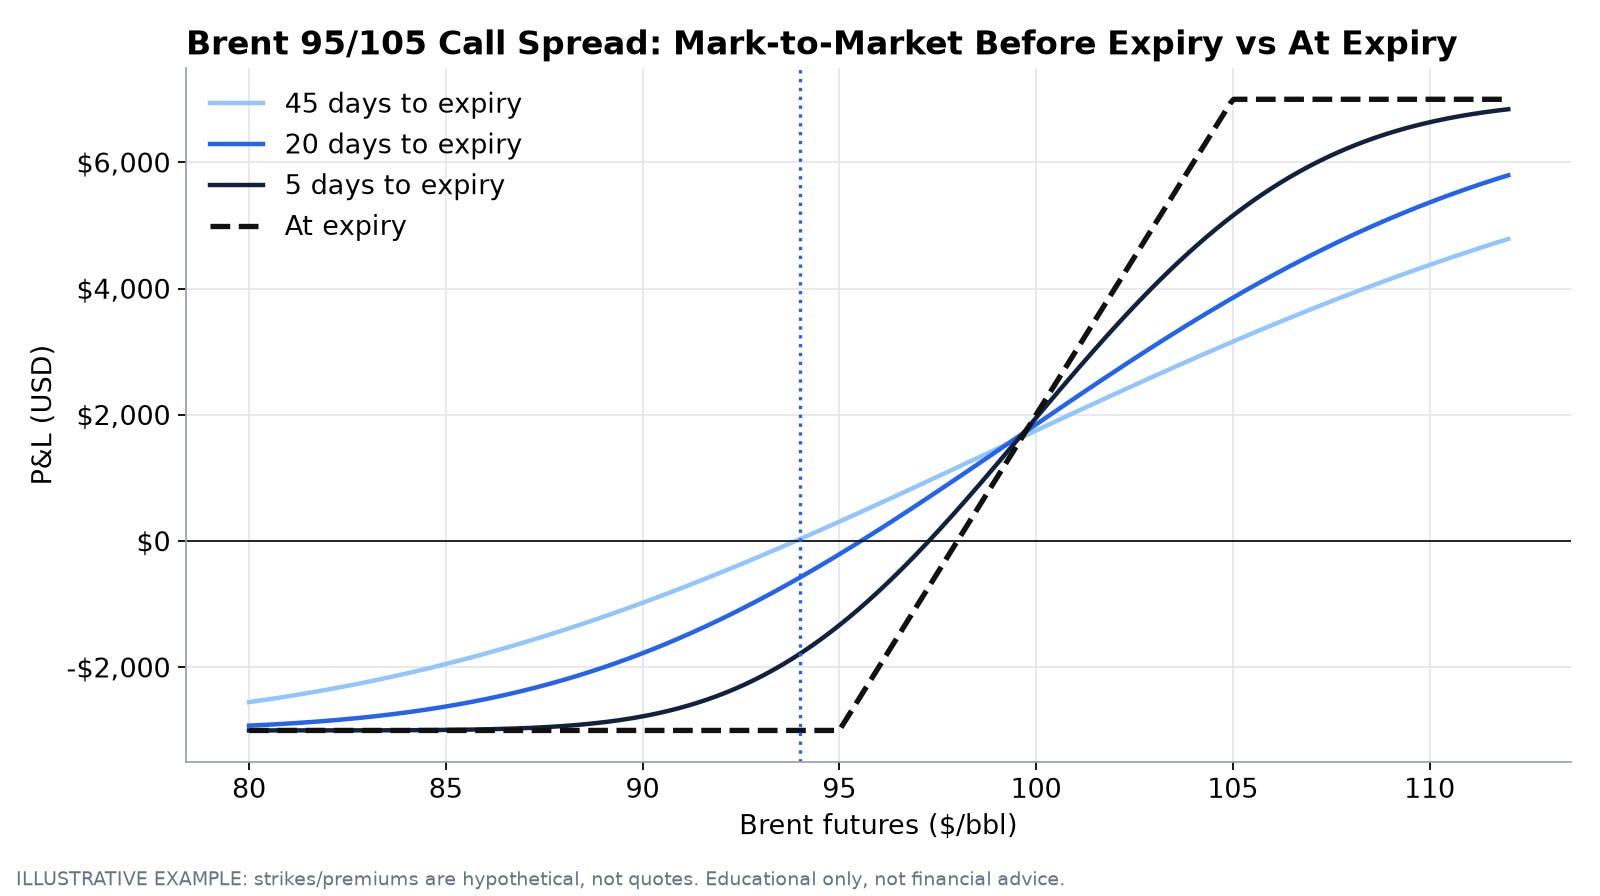
The Brent 95/105 call spread valued 45, 20 and 5 days before expiry versus at expiry. With more time remaining, the curve is flatter, so you capture less of the move early. Illustrative Black-76 values with an assumed 38% volatility.
Here’s how those pre-expiry curves are computed, written in pseudocode rather than the standard closed-form equations:
# Pricing an option on a futures contract (Black-76 style), pseudocode only
function option_value(F, K, days_to_expiry, vol, type):
    T = days_to_expiry / 365
    spread_term = (log(F / K) + 0.5 * vol^2 * T) / (vol * sqrt(T))
    other_term  = spread_term - vol * sqrt(T)
    if type == "call":
        return F * normal_cdf(spread_term) - K * normal_cdf(other_term)
    else:
        return K * normal_cdf(-other_term) - F * normal_cdf(-spread_term)
    # (discounting omitted for clarity)
What invalidates it
De-escalation, such as diplomatic progress or credible shipping protection.
More inventory builds.
Supply increases. The source mentions Venezuela pledging to pump more.
A strong-dollar wave that overwhelms the risk premium.
Any of these would take Brent back below 95, and the most you lose is the debit.
Strategy 5: Gold iron condor around the $4,000 battleground
Theme: sell expensive volatility in a market pulled hard in two directions.
The thesis from the news
Gold is caught in a tug-of-war. Geopolitical uncertainty is a classic safe-haven driver, and the source points to the Hormuz events, export-control tensions and even a $2.24 billion reserve audit on a tokenized-gold product as signs of demand for gold. Against that, rising real yields and a one-year-high dollar raise the cost of holding bullion. The result in the headlines: gold broke $4,000, then fell nearly 3%. The source notes that implied volatility in gold options is elevated after that break, and that some institutions look to sell premium.
When two strong forces cancel out and options are expensive, the edge isn’t direction. It’s selling the volatility premium inside a defined range, while capping the tails.
The structure (illustrative, centred near 3,900)
Sell 3,750 put / buy 3,650 put (bull put spread)
Sell 4,050 call / buy 4,150 call (bear call spread)
Net credit: $35/oz, or $3,500 per condor (100 oz)
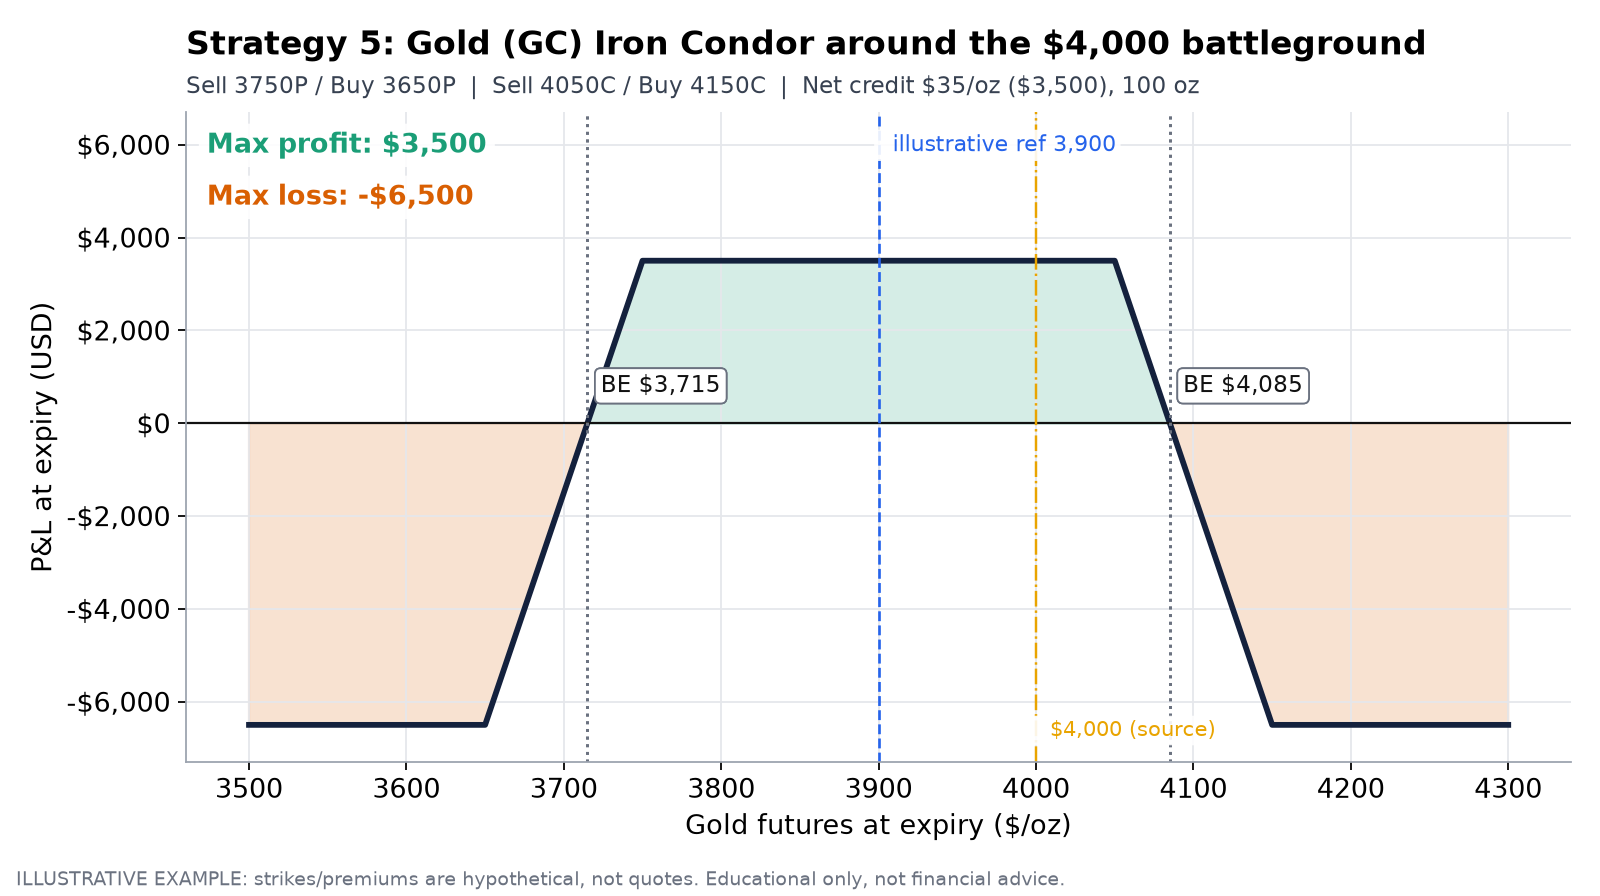
Strategy 5 payoff at expiry: gold iron condor with short strikes at 3,750 and 4,050 and wings at 3,650 and 4,150. Max profit is the $3,500 credit and max loss is $6,500. The $4,000 line is from the source; the other strikes and the credit are illustrative.
The numbers
Max profit: the $3,500 credit, if gold finishes between 3,750 and 4,050.
Max loss: (wing width 100 − credit 35) × 100 = $6,500, beyond either wing.
Breakevens: $3,715 and $4,085.
Reward-to-risk: about 0.54:1. This is a high-probability, low-payoff trade. You’re paid for being right most of the time, and you must size it so the occasional full loss doesn’t hurt.
Placing the strikes
The short call at 4,050 sits just above the round-number $4,000 line where gold just failed. That level is now overhead resistance in the source’s framing. The short put sits roughly one expected move below the reference. A simple way to think about the “expected move” without an equation:
# Rough expected move over the trade's life (pseudocode)
annual_vol = implied_vol_at_the_money           # e.g. read from the options chain
years      = days_to_expiry / 365
one_sd_move = price * annual_vol * sqrt(years)  # ~68% of outcomes inside +/- this
short_put_strike  = round_down(price - k * one_sd_move)
short_call_strike = round_up(price + k * one_sd_move)   # k chosen for target win-rate
Management
Close early. Many desks buy back condors at around 50% of max profit, because the remaining premium isn’t worth the gamma risk of the last two weeks.
Defend the tested side. If gold rallies toward 4,050, roll the untested put spread up to collect more credit, or close the call side.
Respect event risk. A Fed meeting or a Hormuz escalation can move gold through a wing in a single session.
What invalidates it
A regime break: a decisive escalation that drives a full safe-haven bid above $4,100, or a hawkish shock that sends gold sharply lower.
Implied volatility rising further after entry. Short premium suffers mark-to-market losses even if the price stays inside the range.
Strategy 6: Natural gas winter/spring calendar spread (long January / short April)
Theme: own the seasonal and structural tightness, and hedge out the outright price.
The thesis from the news
Several gas-relevant threads run through the source material:
Winter seasonality: November marks the start of heating demand.
European tightness: the EU has already spent more on Russian LNG in 2026 than in all of 2025, ahead of a January ban, and European gas rallied for a third straight day.
Structural power demand: the data-center buildout. The source notes natural gas topped the volume leaderboards and turbine-supplier backlogs remain large.
All of this argues for strength in winter contracts relative to post-winter contracts. The source describes institutions favouring “long winter contracts vs. short summer contracts.”
The structure (illustrative)
Long January natural gas futures
Short April natural gas futures
Illustrative entry: January trades $0.60/MMBtu over April
Contract size: 10,000 MMBtu, so each $0.01 of spread change = $100
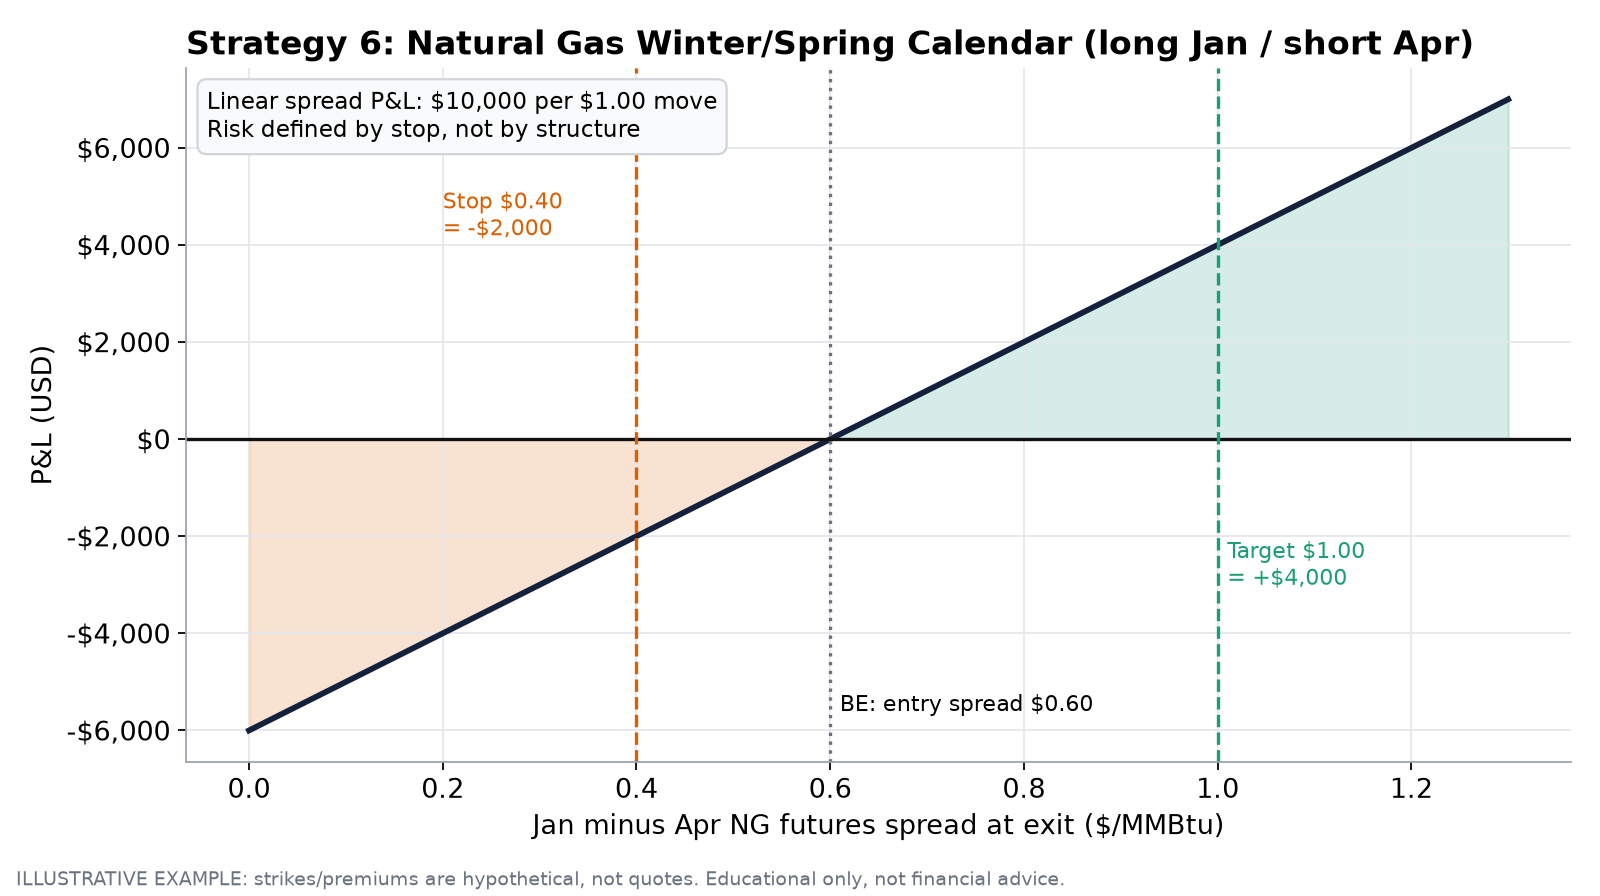
Strategy 6 payoff: long January / short April natural gas calendar spread. P&L is linear at $10,000 per $1.00 of spread change, with an illustrative entry of $0.60, stop of $0.40 and target of $1.00.
The numbers (illustrative)
P&L: (spread at exit − 0.60) × 10,000
Target: $1.00 spread = +$4,000
Stop: $0.40 spread = −$2,000
Reward-to-risk at target/stop: 2:1
Max loss: set by the stop, not by the structure. Gas spreads are famous for violent moves. The March/April spread earned the nickname “the widowmaker” for a reason, which is why this example uses January versus April and a hard stop.
Why a spread instead of outright long gas?
An outright position is exposed to everything: weather, production, storage, the dollar. The calendar spread neutralises much of the parallel price risk and isolates one question: will winter tightness show up more in winter contracts than in spring ones? Exchange spread margins are usually lower than outright margins too.
# Calendar spread monitor (pseudocode)
spread = price("NG", month="JAN") - price("NG", month="APR")
if weather_outlook == "colder_than_normal" and storage_draws > seasonal_avg:
    hold_or_add()
elif spread <= stop_level or weather_outlook == "mild_winter":
    exit()
What invalidates it
A mild winter. This is the classic spread killer.
Storage overflowing relative to seasonal norms.
An easing in Europe: a supply deal or a softer LNG ban.
A data-center demand narrative that cracks. The source itself notes that one investor wrote off billions in turbine orders over AI power over-ordering.
Strategy 7: Bitcoin futures long straddle
Theme: buy movement when you can’t confidently call direction.
The thesis from the news
The crypto section of the source reads like a market at a fork:
Bearish: BTC is below its short-term holder cost basis (about $75,700 versus about $71,300 spot), with liquidation cascades in perpetual swaps. A sweeping midterm result raises regulatory risk, and a corporate treasury sold its remaining bitcoin reserve to fund a data-center buildout.
Bullish: a strategist’s “undervalued” argument and a reported historical pattern of BTC falling below recent buyers’ cost basis 14 times since 2016 before recovering. There’s also institutional custody expansion by a major bank and a regulator pushing to bring perpetual futures onshore.
That’s a recipe for a big move in an unknown direction. The source explicitly mentions long straddles on BTC futures options as a way to “capture large directional moves from Congressional action without predicting direction.”
The structure (illustrative, quoted per 1 BTC)
Buy one 71,000 call
Buy one 71,000 put
Total premium: $10,100 per 1 BTC of notional
Scale by contract size: standard CME bitcoin futures cover 5 BTC and micro contracts cover 0.1 BTC
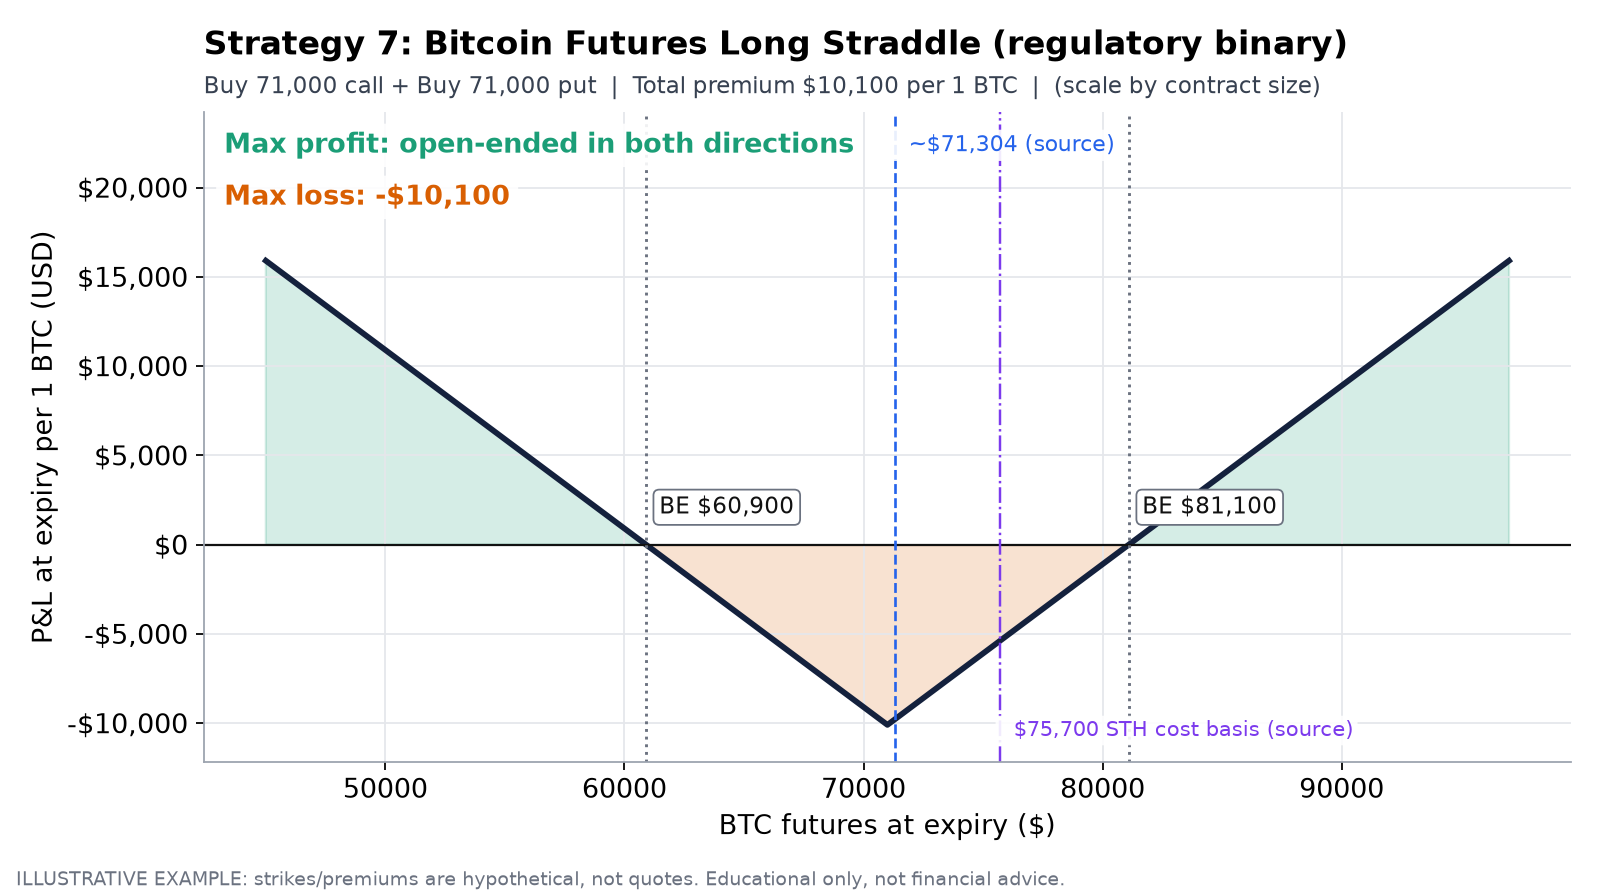
Strategy 7 payoff at expiry: BTC 71,000 long straddle. Max loss is the $10,100 premium per BTC and the breakevens are $60,900 and $81,100. The ~$71,304 spot and $75,700 cost-basis lines are from the source; strike and premium are illustrative.
The numbers (per 1 BTC)
Max loss: the full premium, $10,100, if BTC finishes exactly at 71,000.
Breakevens: $60,900 and $81,100. BTC needs to move about 14% either way by expiry.
Max profit: open-ended in both directions.
Note: the upper breakeven sits above the $75,700 cost-basis line. A “reclaim the cost basis” rally alone isn’t enough. It needs follow-through.
The volatility trap
Straddles are the purest long-volatility trade, and that’s also their weakness. In an “extreme fear” market, implied volatility is usually already high. You’re buying insurance after the house has started smoking. If the big move doesn’t come, both theta and a volatility crush work against you at once.
# Is the straddle worth buying? Compare implied vs expected realized movement (pseudocode)
implied_move  = straddle_premium / spot                    # market's priced move
realized_vol  = stdev(daily_log_returns, lookback) * sqrt(365)
expected_move = realized_vol * sqrt(days_to_expiry / 365)
if expected_move > implied_move * edge_buffer and catalyst_before_expiry:
    buy_straddle()
else:
    consider_cheaper_alternative()     # e.g. a strangle, or a put spread + call spread
What invalidates it
Volatility compression. The market calms, liquidations stop, and BTC drifts in a $66k to $76k range while premium decays.
No catalyst before expiry, such as the regulatory headlines failing to land.
Strategy 8: Ether futures bear put spread
Theme: a defined-risk expression of the ETF-outflow breakdown.
The thesis from the news
Ether’s story in the source is more one-sided than bitcoin’s:
It broke below $2,000.
Spot ETF outflows approached $700 million.
The midterm result is framed as relatively favouring bitcoin over altcoins, adding regulatory overhang to ETH.
The source suggests buying put spreads to express a short view while capping max loss. (There’s a long-term counterpoint in the source too: a mining firm pivoting toward Ethereum and AI infrastructure. That’s a reason to cap the trade, not to skip risk management.)
The structure (illustrative, per 1 ETH)
Buy one 1,900 put
Sell one 1,600 put
Net debit: $90 per ETH
Scale by contract size: CME standard ether futures cover 50 ETH and micro contracts cover 0.1 ETH
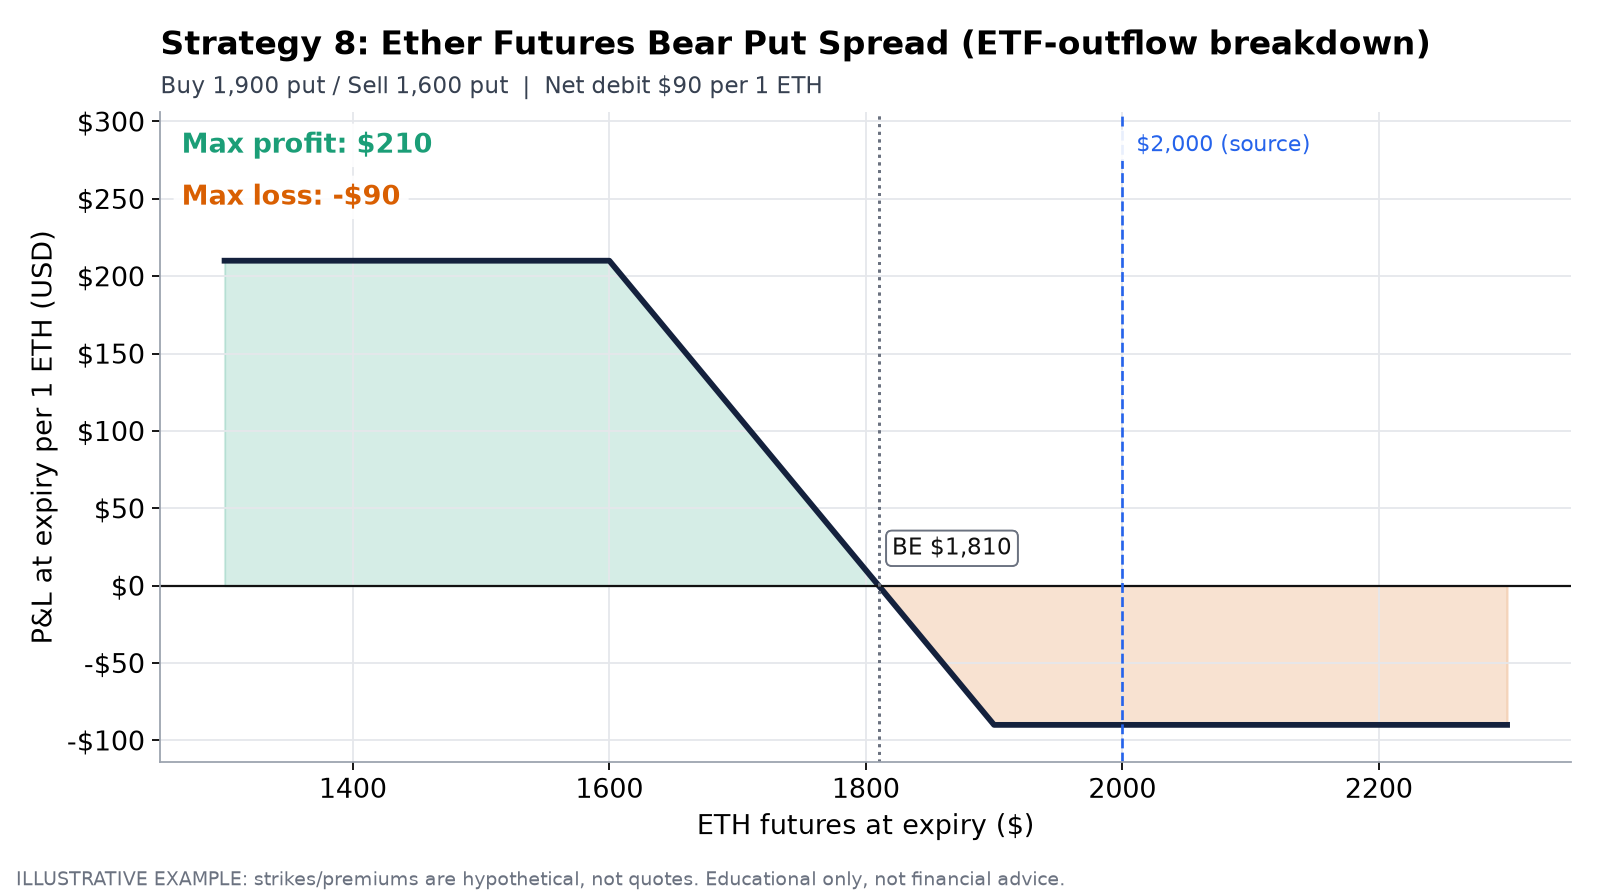
Strategy 8 payoff at expiry: ETH 1,900/1,600 bear put spread. Max loss is $90 per ETH, max profit is $210 per ETH and breakeven is $1,810. The $2,000 line is from the source; strikes and premium are illustrative.
The numbers (per 1 ETH)
Max loss: $90, at or above 1,900.
Max profit: 300 − 90 = $210, at or below 1,600.
Breakeven: $1,810.
Reward-to-risk: about 2.3:1.
Entry logic
Breakdowns below round numbers often get retested from below. The disciplined entry waits for a failed reclaim of $2,000, a bounce that stalls under the level, rather than selling into capitulation lows when put volatility is most expensive.
What invalidates it
A decisive reclaim of $2,000 on reversing ETF flows.
A broad crypto relief rally. ETH tends to rebound harder than BTC.
A positive regulatory surprise.
A note on running Strategies 7 and 8 together
The straddle is long volatility with no directional bias. The ETH put spread is short delta. Run together, they make a book that profits from a crypto breakdown in two ways, and from a crypto squeeze in one. That’s deliberate, but check the combined exposure. If ETH and BTC move together, which they usually do, the two positions offset in a rally and compound in a selloff.
Comparing the eight structures
Reward-to-risk is only half the picture. The other half is how often each trade wins. High-ratio trades, like the ZN put spread at 3:1, usually need a specific move to pay off. Low-ratio trades, like the gold condor at about 0.54:1, are designed to win more often but give back more when they lose.
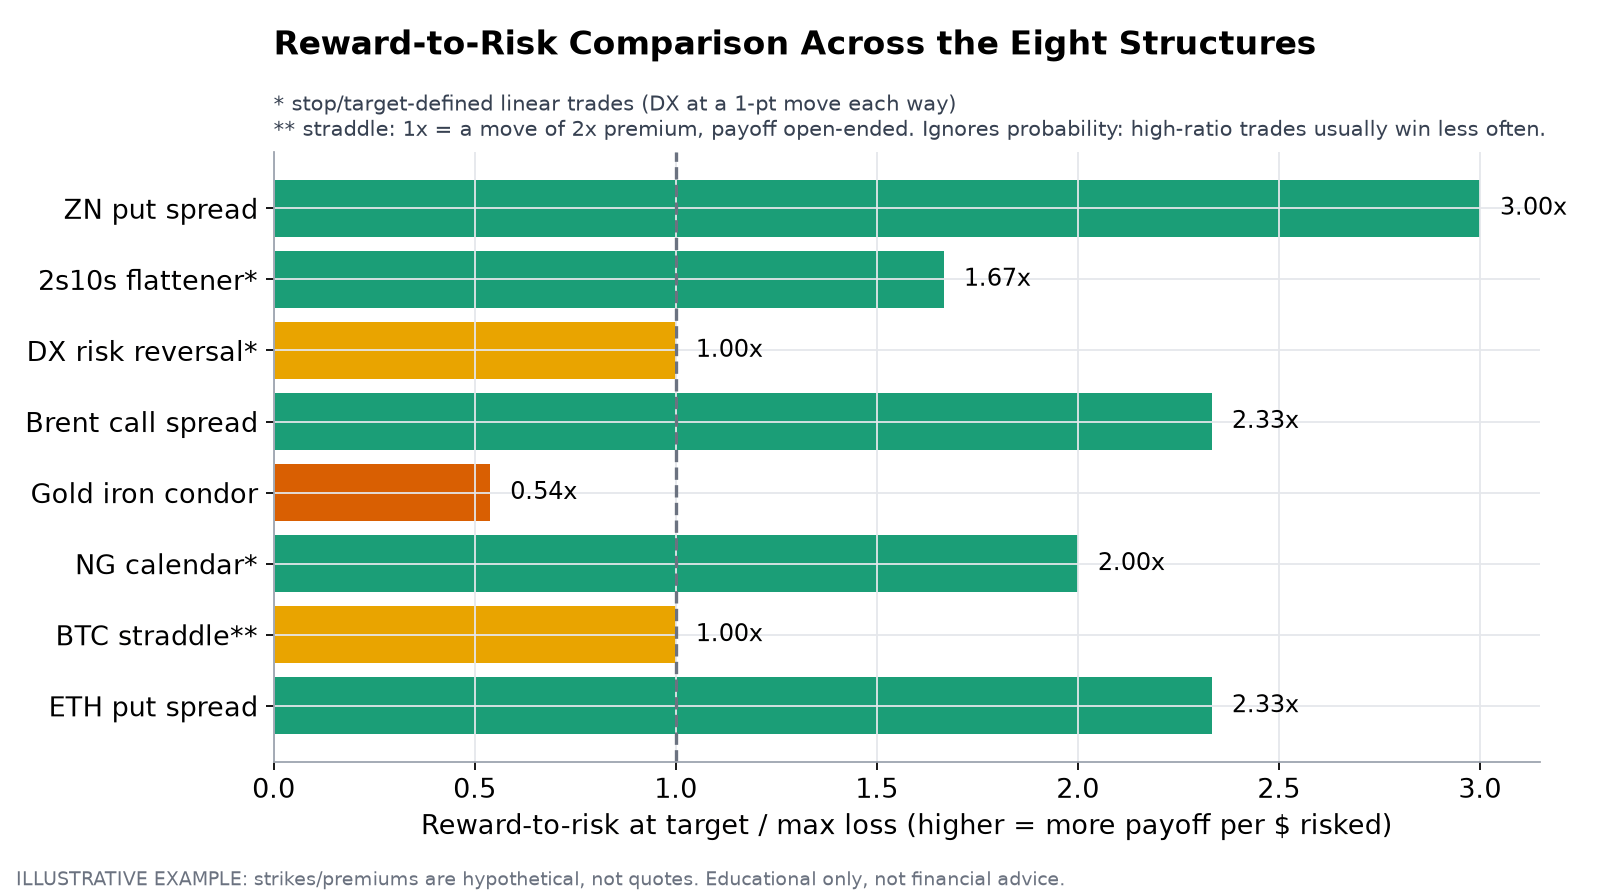
Reward-to-risk across all eight structures. Linear trades are measured at their target/stop; the straddle is shown at a move of twice its premium. Illustrative values.
A summary in plain language:
Defined-risk directional: ZN bear put spread, Brent bull call spread, ETH bear put spread. Max loss is known at entry.
Defined-risk volatility selling: the gold iron condor. Max loss is known, but the win/loss ratio is skewed toward frequent small wins.
Defined-cost volatility buying: the BTC straddle. Max loss is the premium, and the upside is open.
Stop-defined relative value: the 2s10s flattener and the NG calendar. Losses are limited only by discipline and liquidity.
Stop-defined synthetic directional: the DX risk reversal, which has open-ended risk below the short put.
Scenario map
How does the book behave if the world goes one way or the other? The heatmap below sketches each structure’s directional response to five plausible scenarios, scaled to its capital at risk.
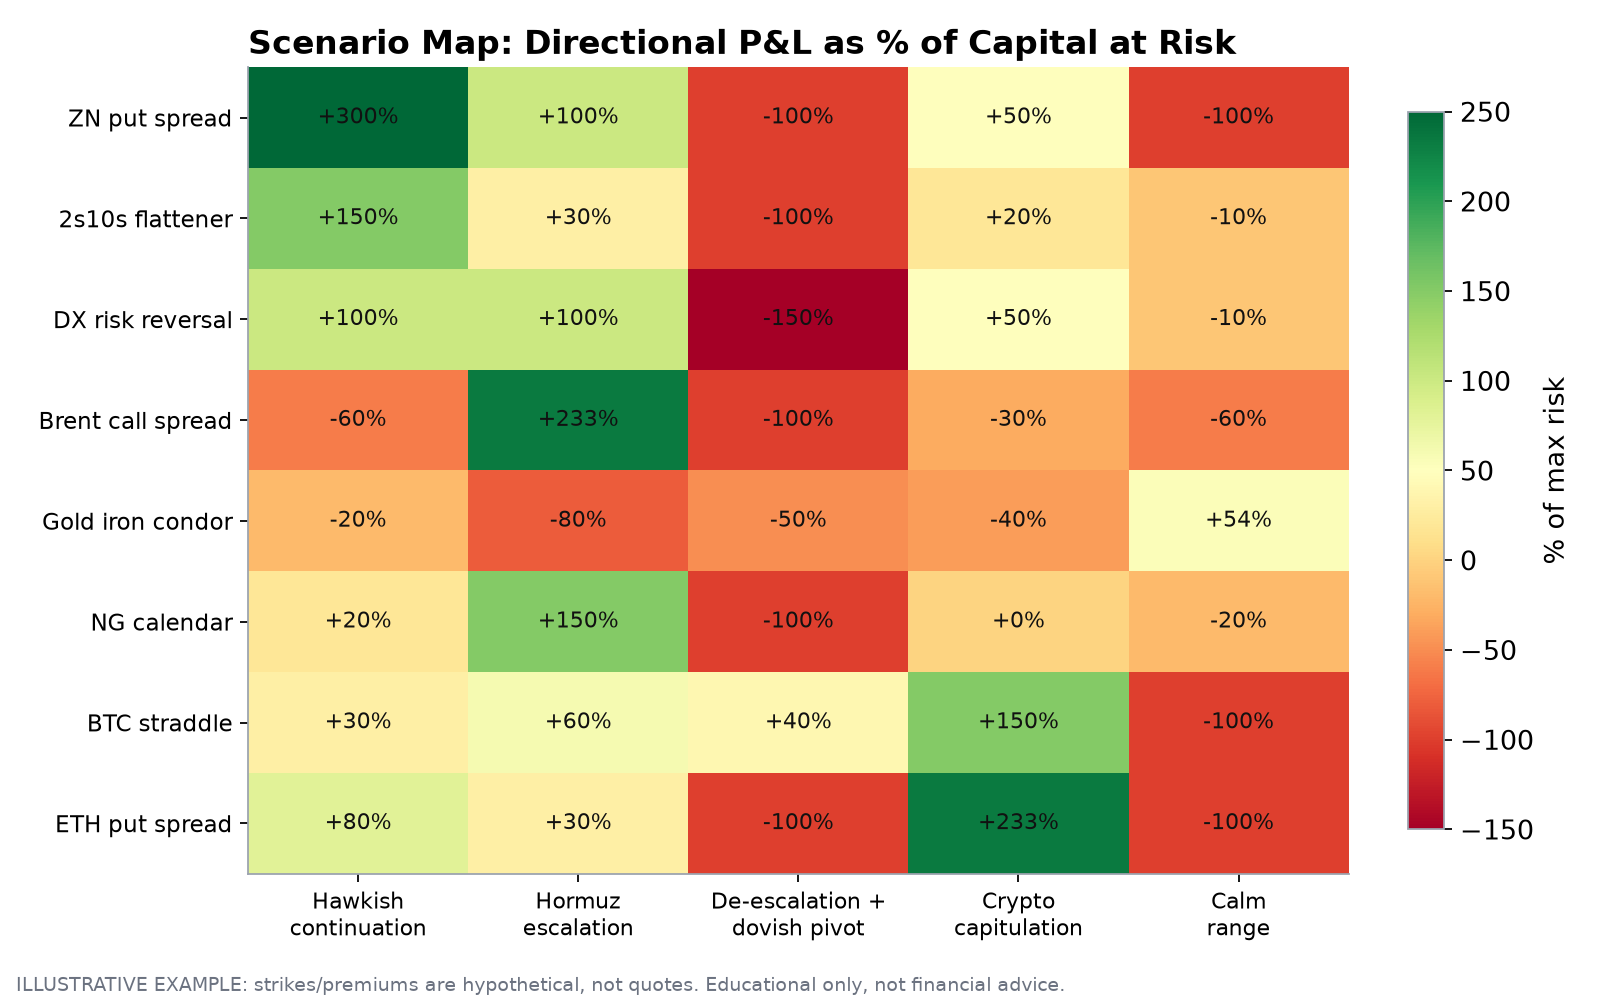
Scenario map: illustrative P&L as a percentage of capital at risk for each structure under five macro scenarios. Qualitative and illustrative, not a forecast.
Two lessons jump out:
“De-escalation plus dovish pivot” is the book’s nightmare. Most structures are built around the hawkish/geopolitical story, so a sudden reversal of both hurts nearly everything at once. That’s the correlation trap made visible.
The gold condor and the BTC straddle are the diversifiers. They’re the only structures that pay in the “calm range” and “crypto capitulation” scenarios respectively. That’s why a balanced book holds both “direction” trades and “volatility” trades.
The Greeks, without the calculus
Each structure carries a different bundle of sensitivities. Here’s a quick sketch comparing a long straddle (pure volatility) with a call spread (defined-risk direction):
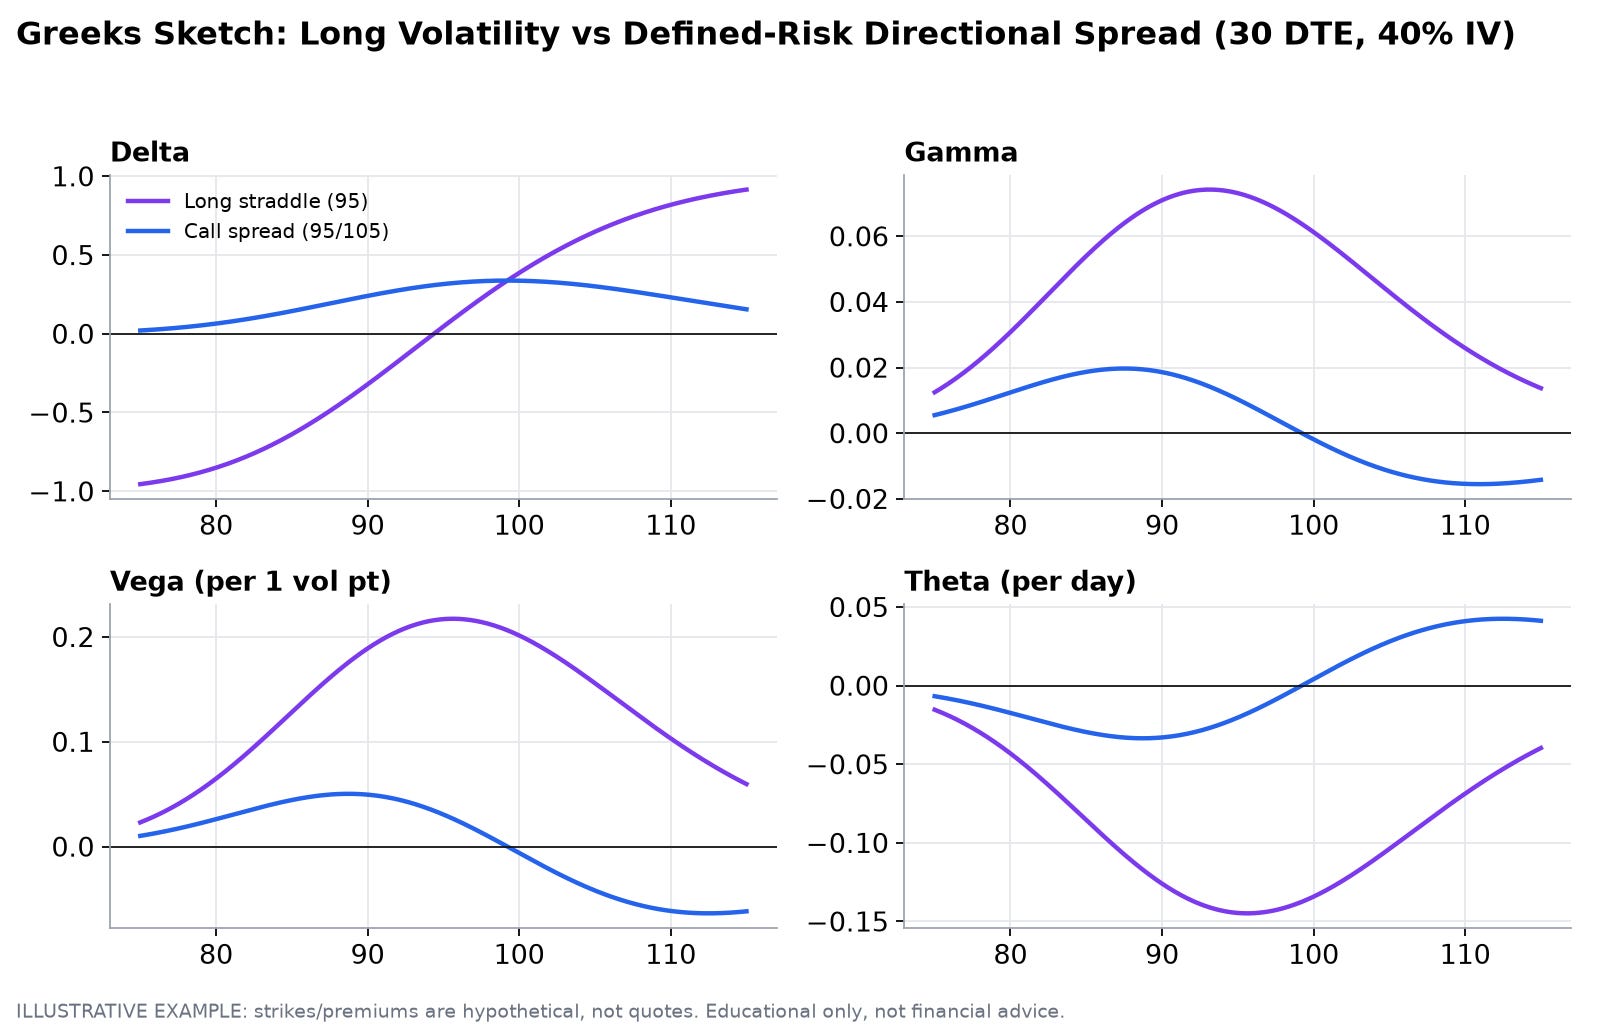
Delta, gamma, vega and theta for a long 95 straddle versus a 95/105 call spread, 30 days to expiry at 40% implied volatility. Illustrative.
What each panel shows:
Delta (direction). The straddle’s delta swings from −1 to +1 and is near zero at the strike. The call spread’s delta is a hump that peaks between the strikes.
Gamma (how fast delta changes). The straddle carries large positive gamma at the strike, so it gets longer as the market rallies and shorter as it falls. That’s exactly what you want in a breakout.
Vega (sensitivity to implied volatility). The straddle is heavily long vega. The call spread is almost vega-neutral, which is why spreads survive volatility crushes better.
Theta (time decay). The straddle bleeds the fastest. The price of convexity is paid daily.
Here’s how desks typically estimate these numerically without closed-form formulas: just “bump and reprice.”
# Finite-difference Greeks (pseudocode) - works for any structure
function greeks(structure, F, vol, days):
    h_price, h_vol, h_day = 0.01 * F, 0.01, 1
    v0      = value(structure, F, vol, days)
    v_up    = value(structure, F + h_price, vol, days)
    v_dn    = value(structure, F - h_price, vol, days)
    delta   = (v_up - v_dn) / (2 * h_price)
    gamma   = (v_up - 2 * v0 + v_dn) / h_price^2
    vega    = value(structure, F, vol + h_vol, days) - v0      # per 1 vol point
    theta   = value(structure, F, vol, days - h_day) - v0      # per day
    return delta, gamma, vega, theta
Time decay is not linear
Option buyers pay rent, and that rent goes up near the end. An at-the-money option loses value slowly 90 days out and very quickly in the last three weeks.
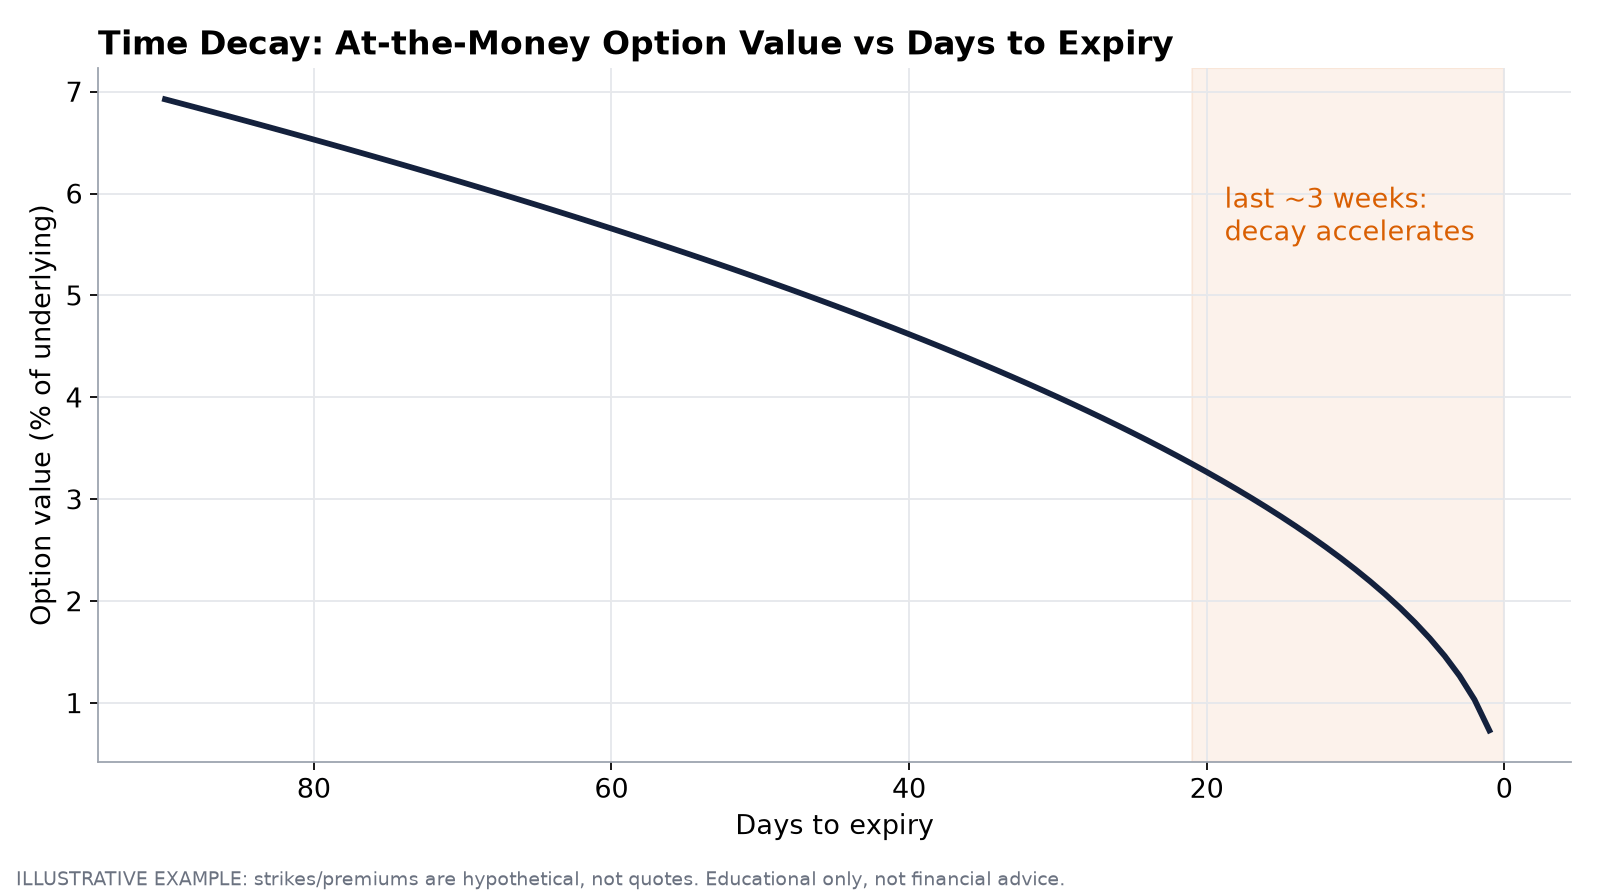
Value of an at-the-money option versus days to expiry. Decay accelerates in the final ~3 weeks. Illustrative, with 35% volatility.
Practical consequences:
For debit spreads and straddles, buy enough time for the thesis to play out, then exit or roll before the final-weeks decay curve kicks in.
For credit structures like the condor, the final weeks are when you earn the most decay, and they’re also when gamma risk is highest. That’s why “close at 50%” is a common desk habit.
The correlation trap: one theme, many tickets
The biggest risk in a news-driven book isn’t any single trade. It’s owning the same bet several times without realising it.
Short Treasuries, long dollar and short gold are all expressions of “the Fed is hawkish.” On a calm day they look like three diversified positions. On the day the Fed surprises dovishly, they behave like one big position. The source material repeatedly warns against stacking highly correlated exposures and suggests diversifying with trades driven by different factors, like energy supply risk or crypto-specific volatility.
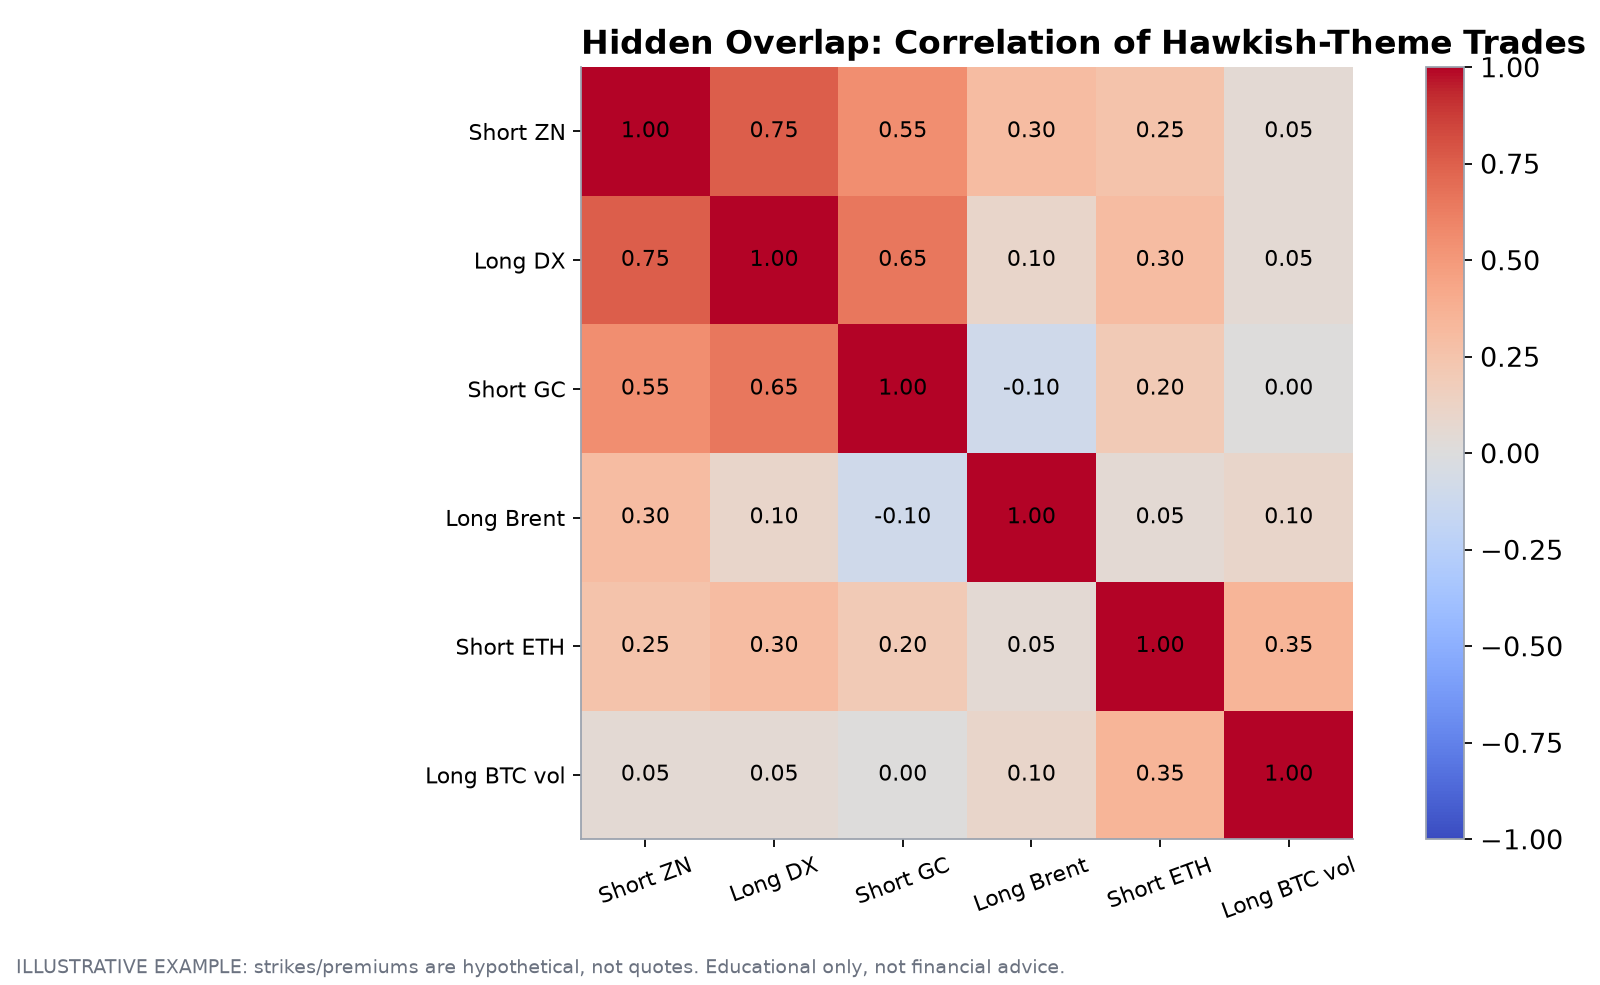
Illustrative P&L correlation between hawkish-theme trades. Rates, dollar and gold positions cluster together, while energy and crypto-volatility trades add genuine diversification. Values are illustrative, not measured.
A simple, equation-free way to check for hidden overlap before adding a new trade:
# Correlation-aware position check (pseudocode)
for new_trade in candidate_trades:
    overlap = []
    for existing in book:
        rho = rolling_correlation(daily_pnl(new_trade), daily_pnl(existing), lookback)
        if rho > high_correlation_threshold:
            overlap.append(existing)
    if overlap:
        new_trade.size = new_trade.size * reduction_factor   # or skip it entirely
        log("New trade overlaps with", overlap)
    book.add(new_trade)
Size for the regime, not the conviction
The source material repeatedly stresses one more principle: when the volatility regime rises, position sizes should shrink. That’s true even when conviction is high. The math behind this is intuitive. If daily swings double, the same contract count carries roughly double the dollar risk. Size the book so its dollar risk, not its contract count, stays stable.
# Volatility-scaled sizing (pseudocode)
risk_budget_per_trade = account_equity * risk_fraction
dollar_risk_per_unit  = max_loss_per_unit                 # for defined-risk structures
# for linear trades, use: stop_distance * multiplier
units = floor(risk_budget_per_trade / dollar_risk_per_unit)
if volatility_regime == "elevated":
    units = floor(units * regime_scaler)                  # scale down in stress
Putting it together: a sample allocation framework
Here’s one way to combine the eight structures into a single, balanced risk budget. This is an educational illustration, not a recommended portfolio.
Core hawkish view (about 35% of risk budget): - ZN bear put spread - 2s10s flattener, sized smaller because its risk is stop-defined - DX risk reversal, sized smallest because the short put is open-ended
Geopolitical energy view (about 25%): - Brent bull call spread - NG winter/spring calendar
Volatility-premium harvest (about 15%): - Gold iron condor
Crypto two-way risk (about 25%): - BTC long straddle - ETH bear put spread
Pre-trade checklist for each structure:
☐ Is the thesis tied to a specific news driver, not just a feeling?
☐ Is the max loss known, or is a hard stop in place for linear and short-option trades?
☐ Have I checked implied volatility before buying or selling premium?
☐ Is the expiry after the key catalyst (FOMC, data, regulatory headlines)?
☐ Does the trade overlap with something I already hold?
☐ Is size scaled to the volatility regime?
☐ Do I know exactly what would prove me wrong and what I’ll do then?
What would make this whole playbook wrong?
Honest analysis means naming the scenario that breaks the thesis. For this book, it’s a combined de-escalation and dovish surprise. That could be a soft inflation print or Fed speakers walking back hike odds, arriving at the same time as credible calm in the Gulf. Bonds would rally, the dollar would fall, crude’s risk premium would drain, and gold might squeeze higher through the condor’s call wing.
In that world, the defined-risk structures do their job. The ZN put spread, Brent call spread and ETH put spread lose only their premium. The stop-defined trades, the flattener, NG calendar and DX risk reversal, depend on execution discipline. The straddle might even help if the reversal is violent.
That’s the core argument for using structures over outright futures in a market like this: you choose your worst case in advance.
Key takeaways
The November 12 news flow is hawkish but conflicted. It combines 86% December hike odds, a 10-year near 5% and a one-year-high dollar with $94 Brent, Hormuz tanker strikes, gold failing at $4,000 and crypto in extreme fear.
Use structures to isolate the part of the view you trust:
put spreads for direction with a capped loss
curve and calendar spreads for relative value
condors to harvest expensive volatility
straddles to buy movement without picking a direction
Every trade needs a pre-defined invalidation point. Every one in this article has one.
Watch for correlation. Short bonds, long dollar and short gold are largely one bet.
Size to the volatility regime, not to conviction.
Sources and methodology
The market levels and headlines referenced here (CPI timing, December hike probability, 10-year yield, Dollar Index level and support/target levels, Brent print, EIA inventory build, Hormuz tanker reports, gold’s $4,000 break and decline, bitcoin’s cost-basis level and spot, ether’s $2,000 break and ETF outflows, European LNG and gas developments) come from a set of market-analysis reports dated November 12, 2026. They are reported here as stated in that material and haven’t been independently verified against live market data. All strikes, premiums, spread levels, DV01 sizing, volatility inputs, scenario values and correlation values in the charts are illustrative assumptions chosen for teaching purposes.
Disclaimer
This article is provided for educational and informational purposes only and does not constitute financial, investment, legal or tax advice, or an offer or solicitation to buy or sell any financial instrument. Trading futures and options on futures involves substantial risk of loss and isn’t suitable for every investor. You can lose more than your initial investment. Hypothetical and illustrative examples have inherent limitations and don’t reflect actual trading, slippage, commissions or market impact. Past performance, whether actual or hypothetical, does not indicate future results. Always do your own research and consult a qualified, licensed professional before making any trading decision.
If you found this useful, you can subscribe for free to get future market breakdowns.

Publication logo.