


Educational analysis only. This is not financial advice, a recommendation or an offer to trade anything. Every price, probability and payoff below is either sourced to a named outlet, computed from public Yahoo Finance data, or labelled illustrative. Futures and options can lose more than you put in.
Monday, November 16, 2026: one variable, five markets
On most days the five markets in this article have little to say to one another. Euro currency futures, 10-year Treasury note futures, gold, WTI crude and bitcoin each have their own buyers, their own news flow and their own personality. This week they all reached for the same lever.
That lever is the Federal Reserve’s hiking path. October core inflation printed 0.3% for a third straight upside surprise, producer prices posted their biggest annual jump in four years, and the CME FedWatch tool now puts the odds of a quarter-point hike at the December 9 meeting at roughly 92% to 95%, according to Reuters, CNBC and Trading Economics. The Fed lifted rates in September and held in October, leaving the target range at 3.75% to 4.00%. Traders are pricing up to three consecutive hikes through March, which would lift the effective rate toward 4.6%, MUFG notes.
The market’s answer was blunt. The 10-year Treasury yield closed Monday near 5.12% after touching 5.17% on Friday, with the 2-year near 4.83% and the 30-year near 5.47%. The dollar index printed about 103.5, its highest since April 2025. The euro slipped under 1.1000 for the first time in 19 months. Spot gold touched $3,830.74, its lowest since October 2, 2025 and 31.5% below the January record of $5,594.82, per Reuters. WTI crude settled at $85.72, down $2.84, after the International Energy Agency flipped its fourth-quarter view from deficit to surplus. Bitcoin dropped to $62,100 on Sunday after roughly $2 billion of mostly long liquidations, its sixth straight weekly loss, CoinDesk reports. The S&P 500 fell 1.9% to 7,416.59, its third straight decline, with Nvidia down 4.1% a day before its earnings (AP).
I came to these five markets through five Python trading bots and seven PDF reports that a trader generated at 4:01 PM Eastern today. One bot trades micro euro FX (M6E), one trades micro bitcoin (MBT), one trades micro WTI crude (MCL), one trades micro gold (MGC), and one trades 10-year note futures (ZN). The PDFs hold a long macro news-flow analysis, a portfolio term sheet with backtest results, an options-chain study, a risk-protocol reference and some summaries.
This piece is not a review of those bots, and it is certainly not a promotion of their numbers. Trading rules stay private, so I describe the bots only in concept: what each one is trying to do, and which direction it leans. As you will see in the data-quality section near the end, the backtest figures in the PDFs are not safe to quote, and I do not present them as results. The “short-term profit potential” dollar ranges printed in each bot’s header are unverified estimates, and I do not treat them as expectations of anything.
What I can do is something more useful. I can take the five markets the bots point at, analyze them with the same three lenses any professional would use (quant, fundamental and technical), and ask a pointed question: given what these markets are doing today, which of the bots’ stories are riding the tape and which are fighting it?
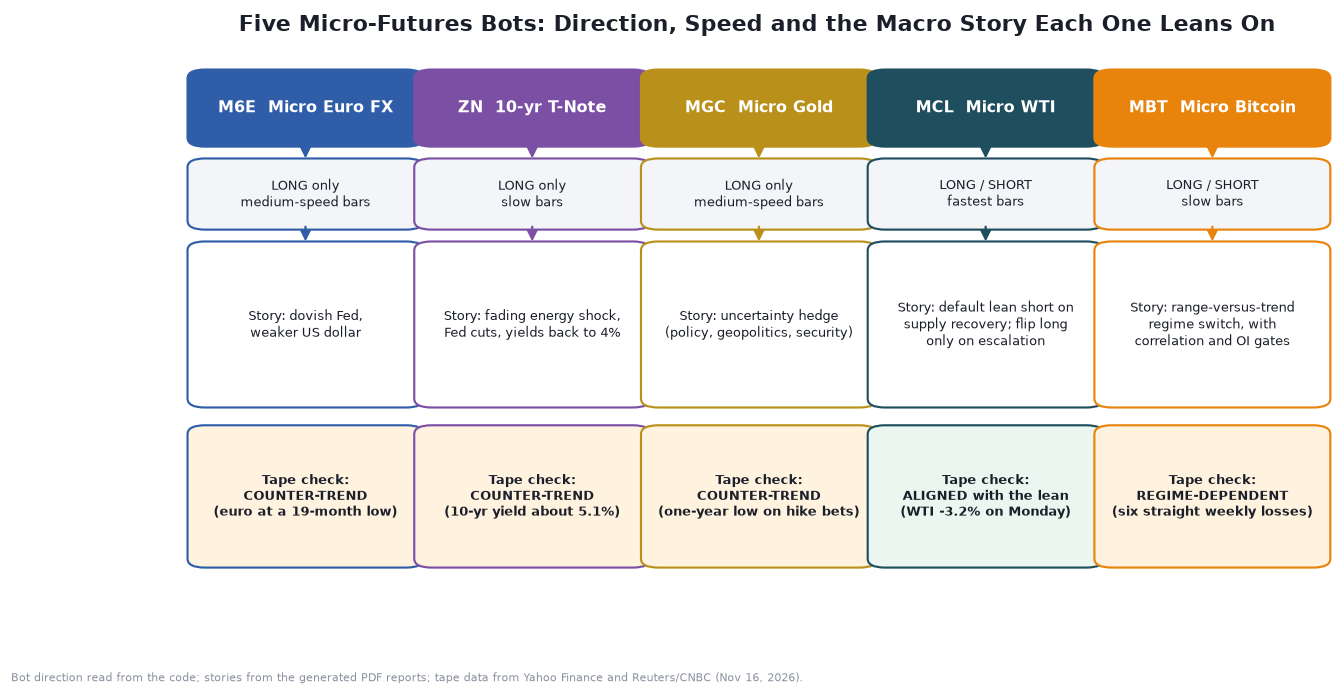
The five bots, read from the code
I read each script end to end and sorted them by direction and concept. Here is what I found, with no thresholds, weights or size limits, because those are the secret sauce.
M6E Dovish USD Long (micro euro FX). This is a long-only bot. Its idea is that a dovish Federal Reserve weakens the dollar and lifts the euro. It runs on medium-speed bars and scores a handful of trend, momentum, breakout and volume signals into one composite. It only goes long when the composite is high and price sits above its slower moving average, so it needs a rising market to act.
ZN Dovish Cut Rally Long (10-year note). Also long-only, on slow bars. The story is that an energy shock fades, the Fed turns toward cuts, and 10-year yields drift back toward 4%. The machinery is the same composite-score skeleton with volatility-based stops, scaled down in volatile regimes. Like M6E, it wants a rising price before it buys.
MGC Uncertainty Hedge Long (micro gold). Long-only on medium-speed bars. The thesis is that policy uncertainty, geopolitical risk and security failures push money into gold. It combines a trend-and-momentum score with a macro “uncertainty bias” gate that has to agree before it enters.
MCL Oil Regime Long/Short (micro WTI crude). The only bot of the five with an explicit default stance. It leans short, treating the Hormuz reopening and supply recovery as a fade of the earlier energy shock, and flips long only when a separate score shows confirmed escalation momentum. It runs on the fastest bars in the group and it is two-way by construction.
MBT Bitcoin Range Regime (micro bitcoin). Two-way as well, on slow bars. It first decides whether the market is trending or ranging, then scores long and short setups differently in each state. It stands down when bitcoin trades too closely with the Nasdaq or when open interest is still draining. The PDF text describes the idea as fading ETF-outflow basis compression while price holds above a structural invalidation line below the recent range.
So the direction scorecard is simple. Three are long-only (euro, 10-year note, gold). Two are two-way (crude with a short lean, bitcoin with a regime switch).
All five share one skeleton, drawn here as generic pseudocode rather than the real parameters:
on each completed signal bar:
    features  = [trend, momentum, breakout, volume, regime]
    score     = weighted_sum(features)                 # a number from 0 to 100
    if flat and score_is_high and trend_agrees:
        if gates_pass(data_fresh, spread_ok, vol_ok, session_ok, loss_limits_ok):
            stop   = entry -/+ k * ATR                 # volatility-scaled risk
            target = entry +/- reward_ratio * stop_distance
            size   = floor( risk_budget / (stop_distance * point_value) )
            enter(size, stop, target)
on each execution bar while in a trade:
    tighten trailing stop one way only
    exit on stop, target, signal reversal or time limit
In plain English: measure the market several ways, blend the readings into a single score, check a list of safety gates, size the position so a stop-out costs a small fixed fraction of capital, and then manage the exit mechanically. That is a perfectly standard design. It is also, importantly, a design that only works as well as the thesis feeding it.
Where the theses come from, and why that matters this week
Each bot’s headline story was lifted from a long “news-flow” analysis in the first PDF, which reads a feed of headlines and maps them to futures trades. That analysis is revealing in a way the author may not have intended. It is a series of passes over the same feed, and the passes do not agree with each other.
One pass reads the news as dovish: an energy shock fading, a strategist talking about “a path back to 4% yields,” and “why the Fed could cut aggressively.” That framing matches the long-euro, long-Treasury and long-gold ideas. A later pass applies the same underlying rulebook to a different slice of the feed and concludes the opposite. It notes that 10-year yields hit 5.15%, a Fed official backs slow hikes, and the euro looks bearish toward 1.10. Its conclusion, in the document’s own reasoning, is that hawkish policy is bearish for bonds and bullish for the dollar, which means long dollar, short euro and bearish Treasury futures.
I do not know which pass the bot-generation step used. I do know which one the tape agrees with.
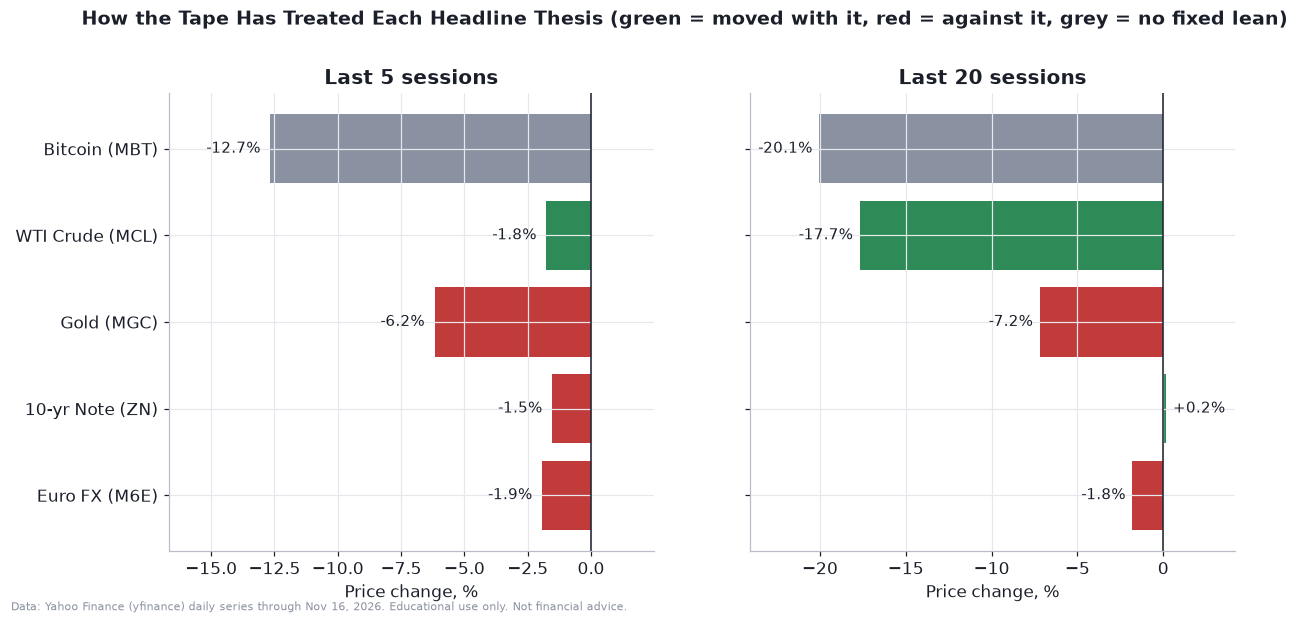
Over the last five sessions the euro is down 1.9%, the 10-year note future is down 1.5%, and gold is down 6.2%: all three long-only theses are underwater. Crude is down 1.8% over five sessions and 17.7% over 20, which is the direction MCL’s default lean wants. Bitcoin is down 12.7% over five sessions and 20.1% over 20, which is neutral by design for a regime bot, though it is the kind of tape a short-capable bot would have to read correctly.
Zoom out to the year and the same message appears.
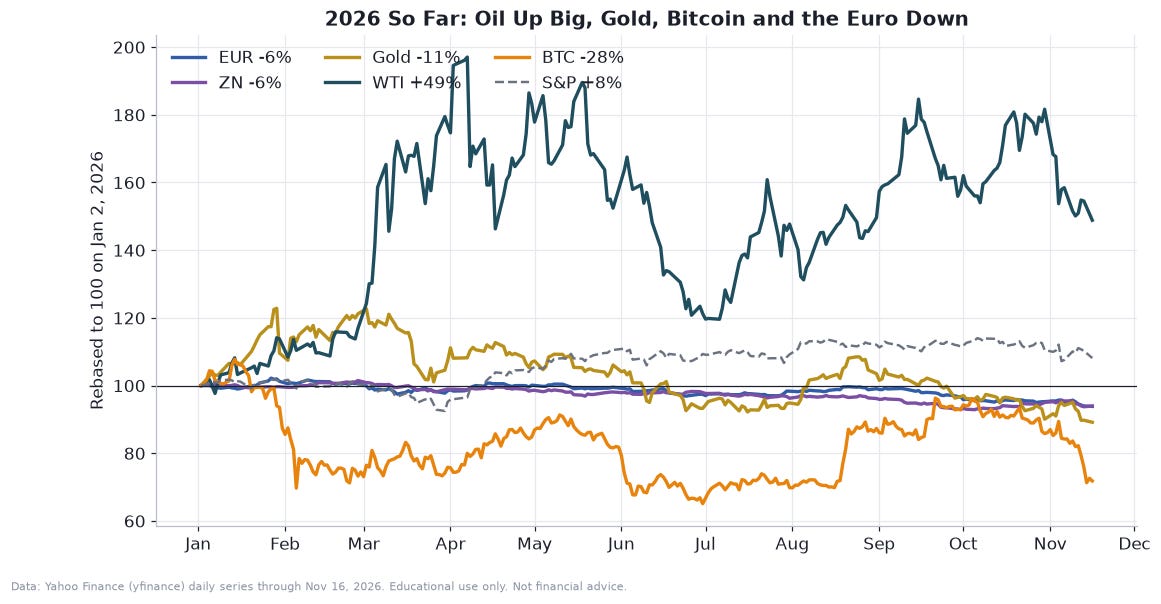
WTI crude is up about 49% since January 2 even after its recent slide, a legacy of the war premium. Bitcoin is down about 27%. Gold is down about 11% on futures closes, and the euro is down about 6%. The 10-year note future is down about 6% too, which is the same thing as yields rising. The S&P 500 is still up about 8% for the year, but it has now lost three sessions in a row.
There is one more oddity worth flagging before we start the math. The contract codes hard-coded in the scripts are M6EM6, MBTM6, MCLN6, MGCQ6 and ZNU6. Using the CME month-code convention printed in the PDF itself (M is June, N is July, Q is August, U is September), all five codes point at contracts that expired months ago. Today’s active contracts are December for euro, gold, the 10-year note and WTI, and November for bitcoin (CME’s November bitcoin contract expires November 27). The PDF’s own ZN section even quotes ZNZ6, a December contract, with a printed volume of 32 and open interest of zero, in a contract that trades millions of lots. Either the codes are stale labels or the bots would be subscribing to dead contracts. I flag it and move on, because the analysis below uses the live front months.
The fundamental regime in five paragraphs
Before any math, here is the macro backdrop for each market, with sources. I will return to each one in its own section.
The Fed and the dollar. The Fed, now chaired by Kevin Warsh, hiked in September, held in October and is expected to hike again on December 9. Kansas City Fed President Jeff Schmid said over the weekend that inflation is “moving in the wrong direction.” Governor Christopher Waller has floated a half-point move if monthly core inflation runs at 0.3% or higher, and October core came in at exactly 0.3%. Dallas Fed President Lorie Logan said the committee needs at least two more increases. Treasury Secretary Bessent, by contrast, cautioned against too much tightening. The dollar index hit 103.5, a 19-month high, and MUFG describes the move as “an abrupt hawkish repricing” with additional support from weak growth in China (sources: Reuters, FXStreet, MUFG Research, Standard Chartered).
Europe. All 71 economists in a Reuters poll expect the European Central Bank to raise its deposit rate from 2.50% to 2.75% on December 17, probably its last hike of the cycle. Euro-area inflation hit a three-year high of 4% in October with core at 2.2%. The problem for the euro is relative: the market treats a prolonged tightening cycle as more credible in the United States than in Europe, short-dated rate differentials are the widest of the year, September industrial production rose only 0.2% against a 0.6% forecast, and French fiscal tension keeps a political discount on the currency (ING, Reuters, FXStreet).
Oil. The US-Israeli war with Iran is in its ninth month, and tanker incidents continue. But the IEA’s November report says supply rose 2.3 million barrels per day in October to 105.4 million on Gulf exports, and it now sees fourth-quarter supply exceeding demand by 1.7 million barrels per day. Dated Brent fell 32% from a $136 peak in early October to about $93. Observed global stocks are still down 462 million barrels since the war began and on-land stocks sit at their lowest since at least 2016, so the market is not loose, just less tight than it was. WTI’s December contract settled at $85.72 and Brent’s January contract at $92.44 on Monday (Newsquawk, Reuters, IEA).
Gold. The bond market is overpowering the haven bid. The 10-year yield rose 29.5 basis points last week, the dollar rallied, and Deutsche Bank notes gold’s weekly loss of 4.6% was its biggest since June. Reuters says gold is on track for its worst calendar year since 2015, even though physically backed gold ETFs took in 211 metric tons in the third quarter. Reuters also links part of the weakness to the roughly $1.9 trillion drop in Nvidia’s market value since early October.
Bitcoin. Spot bitcoin ETFs have shed about $1.91 billion over seven straight sessions, per Farside Investors. Perpetual-futures funding is negative on most coins, which means shorts are paying longs, and options skew is positive, which means puts cost more than calls. CNBC adds three drags: bitcoin broke below its 200-day moving average near $73,000, a $6.3 billion Binance hack hit confidence, and the anticipated Anthropic IPO is pulling speculative capital toward AI equities.
The picture on the screen is easier to take in than the paragraphs.
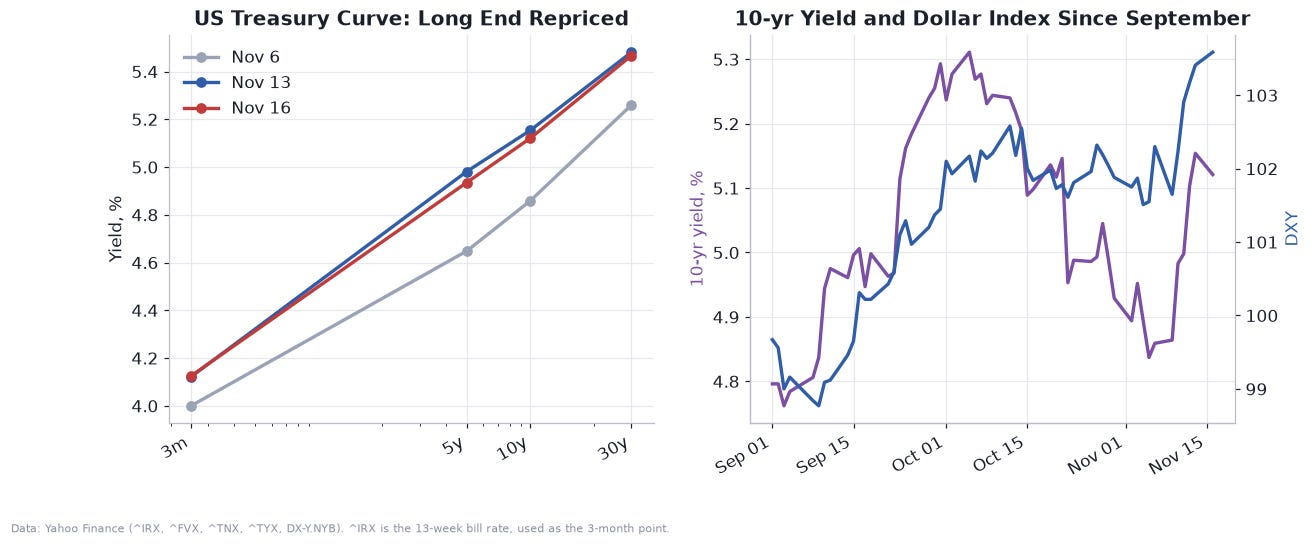
The left panel shows the Treasury curve on November 6, November 13 and November 16. In one week the 5-year yield rose about 33 basis points (from 4.65% to 4.98%), the 10-year about 29 basis points (4.86% to 5.15%) and the 30-year about 22 basis points (5.26% to 5.48%), while the 3-month bill barely moved, so the 10-year-to-3-month spread widened from 86 to 103 basis points. That is the signature of a market repricing the policy path rather than fearing a recession. On the right, the 10-year yield and the dollar index climb together from September, one cause producing two effects.
The quant toolkit, in plain English
Every chart in this piece rests on a handful of formulas. I will state each one once and say what it means.
The simplest model of a price is geometric Brownian motion, in which the log of the price takes a random walk with drift:
In words, tomorrow’s price is today’s price times a random number, where the typical size of the random number is set by volatility sigma. The term minus one-half sigma squared is a bookkeeping correction that keeps the average price consistent with the drift. This model is wrong in the details, as we will see, but it is the language everyone speaks.
Volatility itself comes from observed returns. Annualized realized volatility is the standard deviation of daily log returns scaled by the square root of the number of trading days per year:
Here N is 252 for futures and 365 for bitcoin, which trades every day. I used it to build the volatility-regime charts below, and “volatility regime” simply means where today’s reading sits relative to its own history.
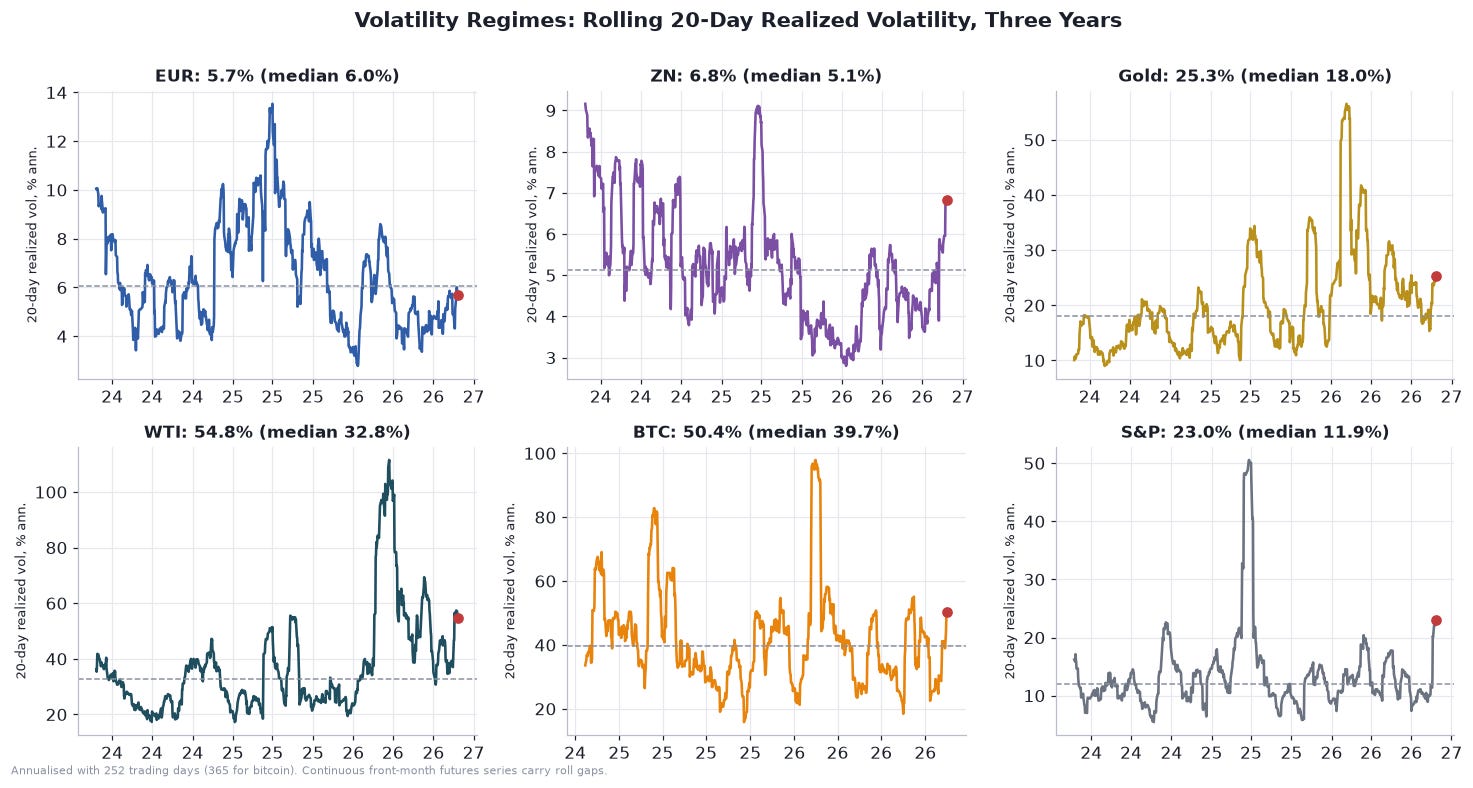
Five of the six sit in the top fifth of their own three-year range. The S&P 500’s 20-day realized volatility is 23.0% annualized against a median near 12%, at the 97th percentile. Crude’s is 54.8% (86th percentile), 10-year note futures are at 6.8% (85th), bitcoin is at 50.4% (83rd) and gold is at 25.3% (81st). Only the euro, at 5.7%, is near the middle of its range (44th percentile).
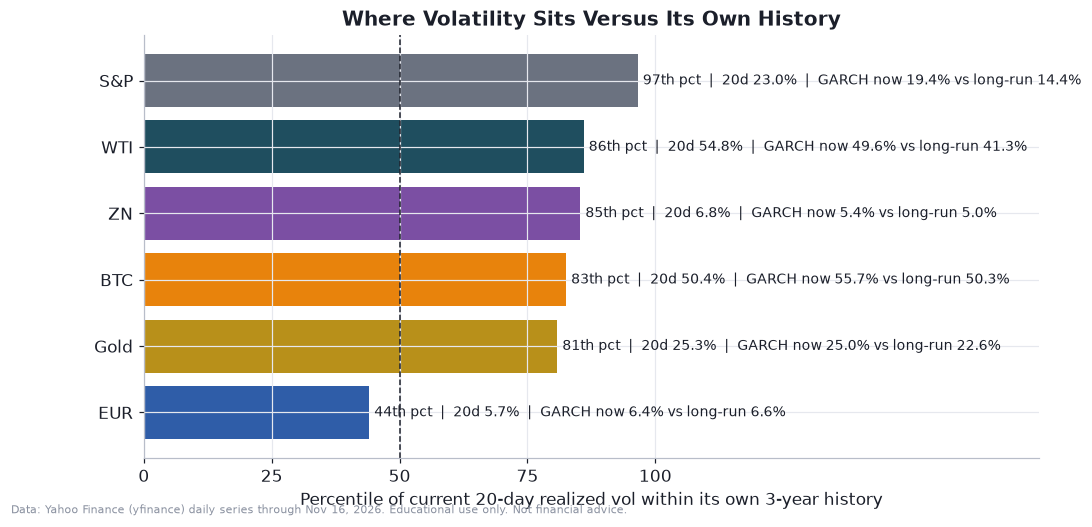
Realized volatility is backward-looking, so for forecasting I fit a model in which volatility clusters, meaning calm follows calm and storms follow storms. The standard workhorse is GARCH(1,1) with Student-t shocks:
Today’s variance equals a long-run baseline (omega), plus a reaction to yesterday’s surprise (alpha), plus a memory of yesterday’s variance (beta). The Student-t distribution adds fat tails, with the degrees-of-freedom parameter nu controlling how fat. I fitted this separately to each market’s last 756 daily returns. It says current annualized volatility is 6.4% for the euro, 5.4% for 10-year notes, 25.0% for gold, 49.6% for crude, 55.7% for bitcoin and 19.4% for the S&P 500. Every market except the euro is running above its fitted long-run level, and the S&P 500 is furthest above (19.4% against 14.4%). The fitted persistence (alpha plus beta) runs from 0.92 for the S&P 500 to 0.99 for 10-year notes, so volatility shocks fade slowly.
Why a Student-t and not a bell curve? Because real returns have fat tails.
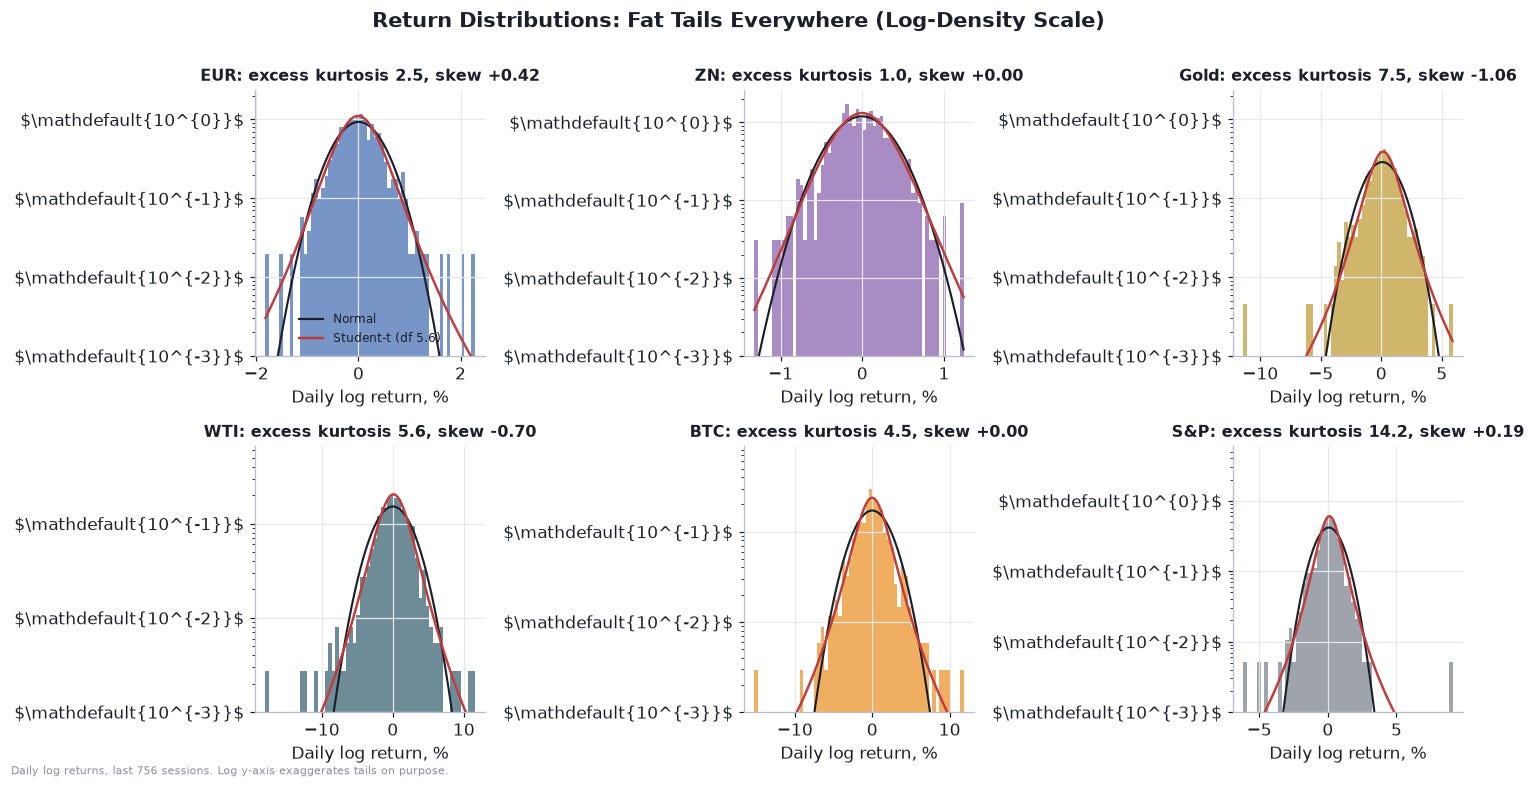
Excess kurtosis, which is zero for a normal distribution, is 14.2 for the S&P 500, 7.5 for gold, 5.6 for crude, 4.5 for bitcoin, 2.5 for the euro and 1.0 for 10-year notes. Gold has a negative skew of about minus 1.06 over the three-year sample, and crude’s skew is minus 0.70. The practical result is that a normal model understates tail risk where it matters. At the 99% one-day level, crude’s empirical loss is 8.0% against 6.1% under the normal, gold’s is 3.6% against 3.1%, and the S&P 500’s is 2.7% against 2.2%.
Fitted vol then gives us the one number traders quote most: the expected move, the one-standard-deviation range over a horizon:
Over 21 trading days (30 days for bitcoin), the model’s one-sigma terminal ranges from today’s reference prices are about plus or minus 200 pips for the euro (2%), 1.63 points for the 10-year note, $263 per ounce for gold (6.8%), $12.20 per barrel for crude (14.2%), about $9,800 for bitcoin (15.2%) and 373 points for the S&P 500 (5.0%). Those are the widths of the cones you will see in each market section.
Volatility also tells you what a single micro contract is worth in daily risk, which is the sizing problem any bot has to solve. A generic version of the sizing rule is:
Read it as: the number of contracts N is the capital C times the fraction you are willing to lose on one trade (rho), divided by the stop distance (k times the average true range, ATR) times the dollar value per point M, rounded down and capped. This is the textbook volatility-scaled sizing formula, and I show it generically. It is not any bot’s parameter set.
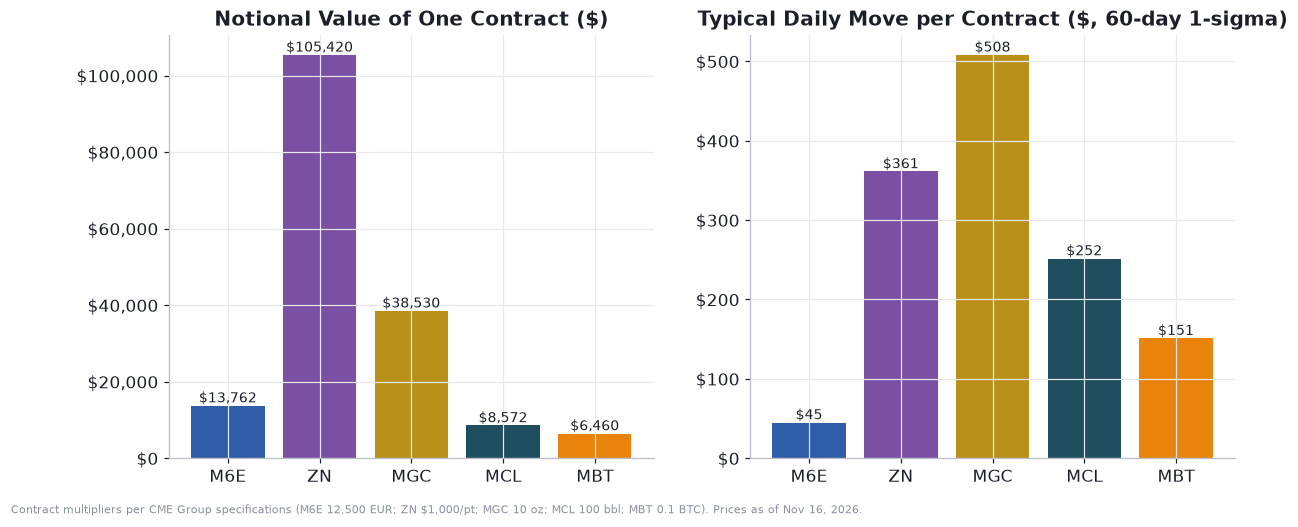
One contract is not one unit of risk. A micro gold contract has a notional of about $38,500 and a typical one-sigma daily move of about $508, based on the last 60 sessions. A micro euro contract has a notional of $13,763 and a daily move of about $45. A 10-year note contract has $105,420 of notional and moves about $361 a day. A micro WTI contract moves about $252 a day on $8,572 of notional, and a micro bitcoin contract moves about $151 on $6,460 of notional. Gold carries more than ten times the daily dollar risk of the euro per contract, which matters the moment anyone sizes them as “one contract each.”
Finally, there is the question of what all five markets have in common. The simplest way to answer it is a factor regression of each market’s daily return on two drivers, the daily change in the 10-year yield and the S&P 500 return:
The beta on yields says how many percent the market moves per basis point of yield, holding stocks fixed, and the R-squared says how much of the daily variance those two factors explain.
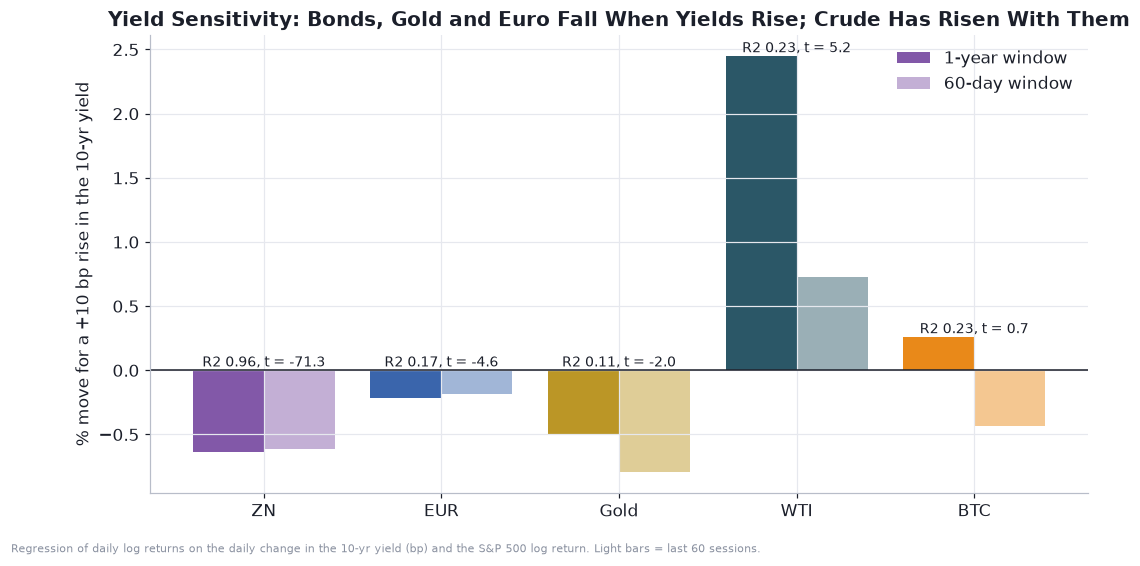
Over the last year, a 10 basis point rise in the 10-year yield has come with a 0.63% fall in the 10-year note future (R-squared 0.96, which is mostly duration arithmetic), a 0.50% fall in gold (t-statistic of minus 2.0), a 0.21% fall in the euro (t of minus 4.6) and, perhaps surprisingly, a 2.4% rise in WTI crude (t of 5.2). Bitcoin has no reliable yield sensitivity (t of 0.7). The oil result is a fingerprint of the war: for most of the past year, oil spikes pushed inflation fears up and yields along with them. Over the last 60 sessions that link has weakened (a 0.73% rise, t of 1.1), because this week’s yield jump came from inflation data and the Fed rather than from oil. The correlation regime is shifting under the market’s feet, which is itself a risk to anyone running a single-factor story.
For the five-market question, the takeaway is that rates drive the euro, bonds and gold in the same direction right now, while crude and bitcoin follow other forces. That framing organizes the rest of the article.
How to read the probability cones
Each market section has a chart with two halves. The left is a fan: the shaded bands show the middle 50%, 90% and 98% of 20,000 simulated price paths on each day of the next month, from a starting price I state in the title. The right is a histogram of where the paths end up on December 16. I simulated the paths from the fitted GARCH model above with zero drift, which is a deliberately neutral assumption. It says nothing about direction. It asks only: if the next month looks statistically like the last three years, with today’s elevated volatility, where could price go?
Two probability questions come up again and again. The first is “where will it finish?” For a driftless lognormal model the chance of finishing below a strike K is:
Read it as: take the distance to the level measured in standard deviations of the move (that is d2), and look up the corresponding tail area of the normal curve N. The second question is “will it touch the level on the way?”, which matters for stops. By the reflection principle, the chance that the path touches a barrier B at any time before T is about double the chance of finishing beyond it:
That factor of two is the most under-appreciated fact in retail trading. If there is a 10% chance of finishing beyond a level, there is roughly a 20% chance a stop placed there gets hit along the way. The cone charts report both numbers from the simulation: “touch” and “finish beyond.” In every market below, the touch probability runs between 1.5 and 2 times the finish probability.
Euro FX (M6E): a good story on the wrong side of the rate gap
What the bot wants. M6E is long-only. Its thesis is that dovish Fed expectations weaken the dollar, so it only buys when its trend-and-momentum composite is strong and price is above its slower average. That is a bet on a euro uptrend. Today the euro has no uptrend to join.
Fundamentals. The euro futures price stands at 1.1010 (the December contract; spot is about 1.0999 on Yahoo Finance’s overnight quote). That is the first time in 19 months that the euro has traded under 1.1000, and the break came with the dollar index at its highest since April 2025. The drivers are in the rate gap. The Fed is expected to lift its target range from 3.75%-4.00% to 4.00%-4.25% on December 9, with traders pricing up to three consecutive hikes through March (MUFG). The ECB is expected to raise its deposit rate from 2.50% to 2.75% on December 17, probably the last move of its cycle (Reuters poll), and short-dated rate differentials are the widest of the year. The bullish case needs something to narrow that gap: a Fed that stops hiking sooner than priced, an ECB that sounds more hawkish than expected, or a geopolitical breakthrough that cools energy prices and eases the dollar’s safe-haven premium. None of those has appeared yet.
There is a mechanical force too. A euro futures contract is priced by covered interest parity:
When US rates sit above euro rates, the futures price is above spot, and a long holder pays that premium as carry. With the Fed funds midpoint near 3.875% and the ECB deposit rate at 2.50%, parity implies about 12 pips of premium over a month. The December future at 1.1010 against spot near 1.0999 shows roughly 10 pips of premium, in line with the formula. So a long euro future is a position with a small negative carry, and it earns that back only if the spot rate rises faster than the rate gap erodes it.
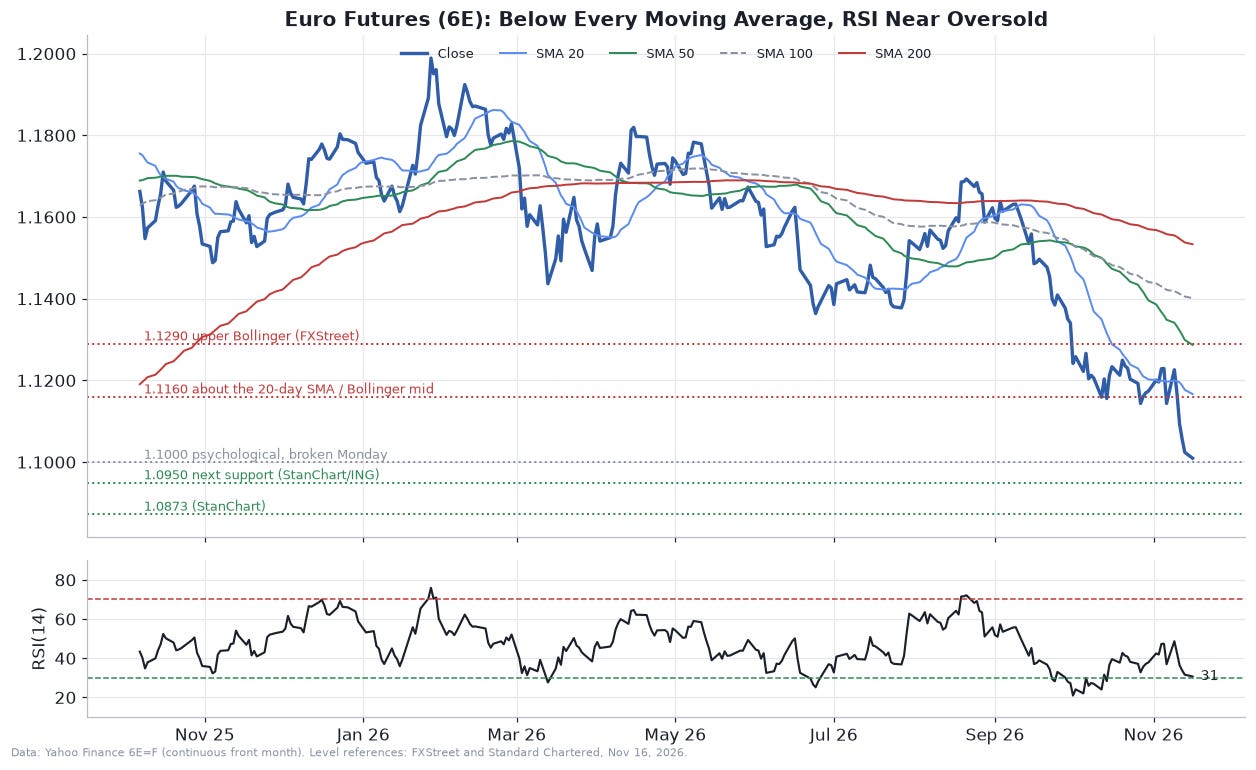
Technicals. The euro closed Monday below its 20-day (about 1.1167), 50-day (1.1287), 100-day (1.1401) and 200-day (1.1533) averages, with RSI at 31, a 52-week low at the current price and a 52-week high of 1.1989 from January 27. The first support levels commentators cite are 1.0950 and 1.0873 (Standard Chartered, FXStreet); the bounce levels are the 20-day average area near 1.1160 and the upper Bollinger band near 1.1290 (FXStreet).
Quant view. The fitted model puts euro volatility at 6.4% annualized, which is middling in its own history (44th percentile of 20-day realized volatility). Over 21 trading days that gives a one-sigma range of about 200 pips. From 1.1010 with zero drift, the simulated 5-95% terminal range is 1.069 to 1.134 and the middle half is 1.088 to 1.114.
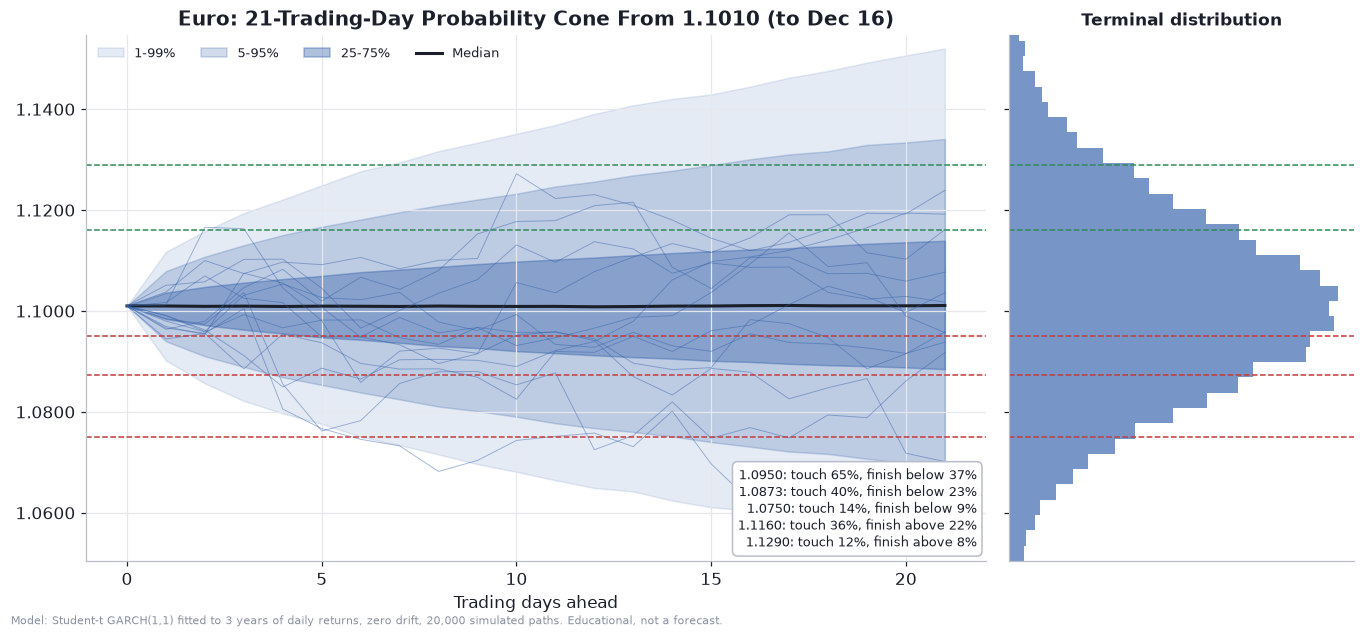
The probabilities are worth reading together. A touch of 1.0950, only 60 pips below the market, has a 65% chance of occurring within the month, though only a 37% chance of the euro finishing below it. A touch of 1.0873 is 40% likely and finishing below is 23% likely. The 1.0750 area is 14% and 9%. On the upside, 1.1160 gets touched 36% of the time and finished above 22% of the time, and 1.1290 is 12% and 8%. In other words, even a neutral model says a bounce of 1.4% to the 20-day average (36% touch) is nearly as likely as a further drop of 1.2% to 1.0873 (40% touch). The market is oversold (RSI 31) but not yet reversing.
Here is the sizing arithmetic that matters. The regression says a 10 basis point rise in the 10-year yield goes with a 0.21% fall in the euro, and rates explain only 17% of the euro’s daily variance. If the bot’s dovish thesis came true and the 10-year yield fell 30 basis points, that effect alone is worth about 0.6%, roughly $83 per micro contract. The one-sigma monthly move is 2%, about $275 per contract. The thesis would be directionally right and still be small next to ordinary noise. The euro rewards trend and carry more than it rewards a clean macro call.
