


Written November 10, 2026. Backtest figures come from my bot pipeline’s reports generated at 3:08 to 3:49 p.m. ET today. Paper-trading figures come from my local bot console, read at about 5:30 p.m. ET. Every result in this article is simulated, either a backtest or paper trading on a live data feed. None of it is live-money P&L. Educational content only, not investment advice.
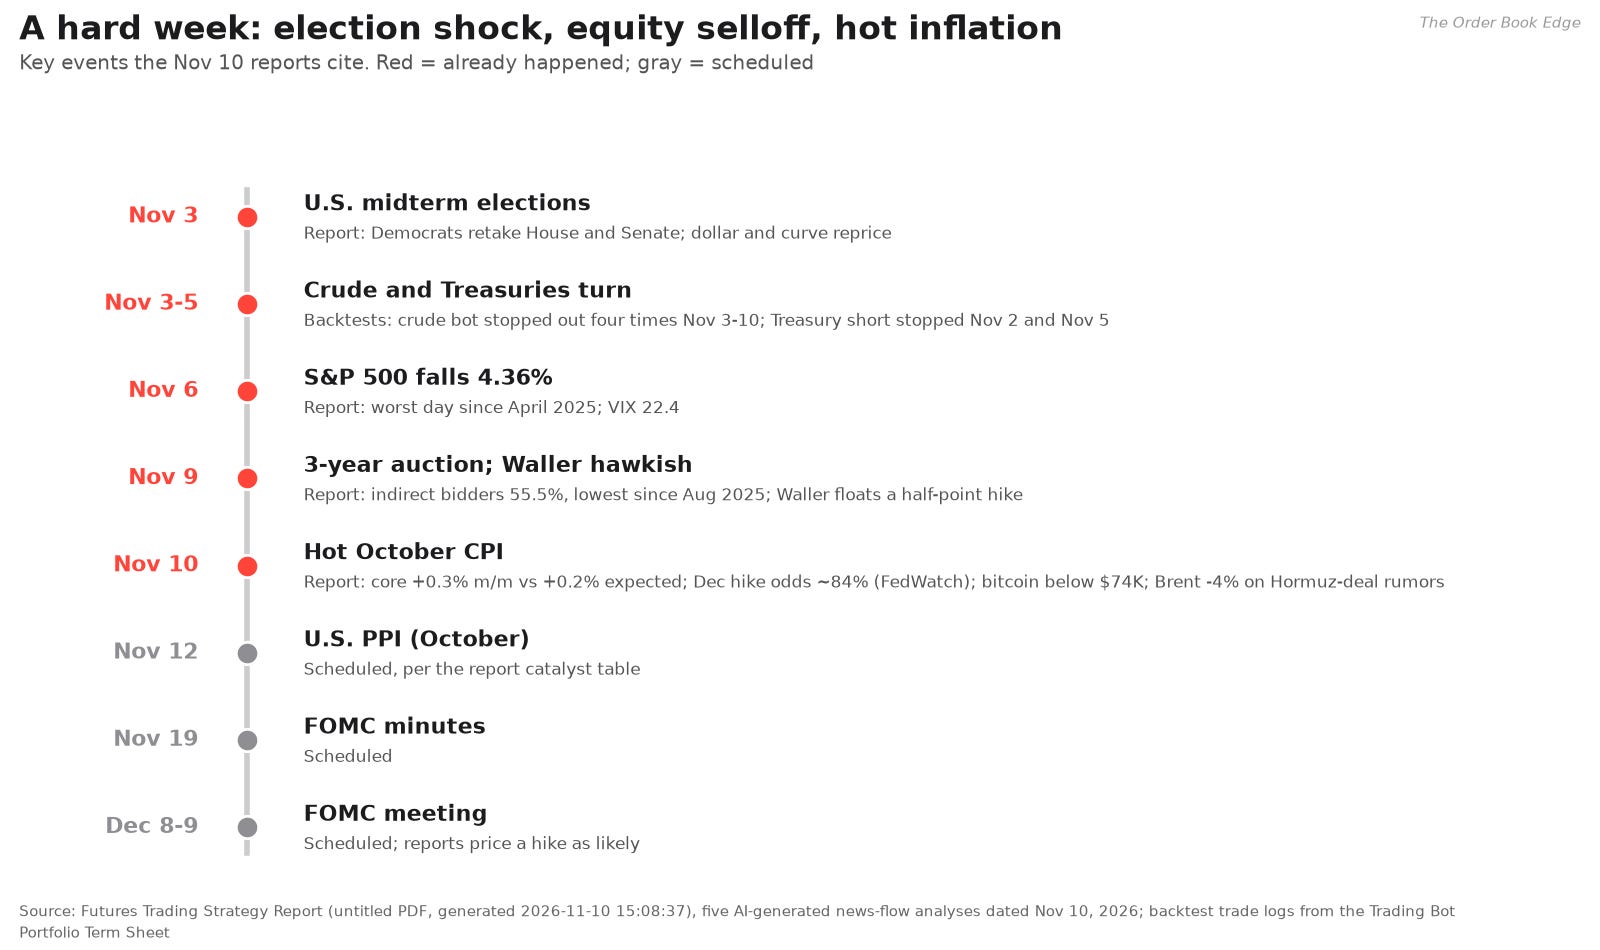
Tuesday, November 10, 2026 was the kind of day a trading bot is built for, and the kind that breaks the ones that are not. October consumer prices came in hot. According to the research reports my pipeline generated this afternoon, core CPI rose 0.3% for the month against a 0.2% consensus. Shelter inflation stayed sticky, and CME FedWatch odds of a December rate hike climbed to about 84%. Fed Governor Waller had already floated a half-point move if core inflation stayed at that pace. The same reports describe bitcoin breaking below $74,000, Brent falling 4% on rumors of a Hormuz deal between Tehran and Washington, and a dollar strong enough to squeeze gold and every commodity priced in it.
Today did not come out of nowhere. A week earlier, the U.S. midterm elections had reshuffled Congress. On Friday, November 6, the S&P 500 fell 4.36%, its worst day since April 2025 according to one of the reports. On Monday, the three-year Treasury auction drew its weakest foreign demand since August 2025. Then came today’s inflation number.
I run a small fleet of systematic futures bots. Some are research bots that the pipeline backtests every day on a year or more of four-hour bars. Others run on my console against a live market-data feed in simulation mode. They place paper trades on real prices, with stops, targets and circuit breakers, but no orders reach an exchange. This article is a report card on both groups through this rough stretch. It covers who led, who got hurt, what the numbers say about each bot’s edge, and above all the specific risk mechanics that kept a bad week from becoming a blown account.
A short version up front: no bot is a hero here. The top three backtest bots, a gold strategy, a natural gas strategy and a 10-year Treasury strategy, earned most of their money earlier in the year. Each of the three has lost money over its last 20 trades. What they did well this week is subtler, and in my view more important. They lost small, stood aside when their conditions were not met, and in one case caught today’s bond selloff for a winning trade that closed at midday. The bot that failed, an S&P 500 strategy, failed the way that matters most: its edge disappeared when the market regime changed, and it kept trading anyway.
That is the story told with real numbers. I don’t reveal the bots’ actual rules, because they are proprietary. I describe each strategy only at the level of its idea, such as “trend-following with a volatility filter,” and I never give exact entries, thresholds or parameters. The math is general and textbook, and I write all of it out.
Executive summary
The tape was hostile across asset classes. Today’s reports describe a hot CPI print, a market pricing a December hike, a rising dollar, falling oil and gold, a sliding stock market and a crypto selloff. My bots’ own price data confirms the direction. Over each bot’s last 20 trades, gold’s entry price fell from about $5,577 to $4,090, natural gas from $3.72 to $2.88, and the S&P micro future from about 7,806 to 7,470.
The backtest leaderboard has four winners and one regime casualty. Combined simulated P&L is $50,232.51 over 312 trades. Gold leads with $25,352.50 (Sharpe 2.12), followed by natural gas at $20,091.07 (Sharpe 0.51) and the 10-year Treasury at $14,844.31 (Sharpe 1.87). WTI crude made $4,328.43. The S&P 500 bot lost $14,383.79, with a 27.7% win rate and a “regime collapse” diagnosis.
November so far was the stress test. Month to date, the top three backtest bots combined made $346. Gold took no trades, natural gas made $1,550 and Treasuries lost $1,204. The bottom two lost $9,627 together: crude lost $4,888 and the S&P bot lost $4,739.
Paper trading on the live feed is barely positive. Nine Treasury bots on my console closed 131 simulated round trips between September 18 and November 9. Net P&L is +$1,531 (as logged), with a 40.5% win rate and a profit factor of 1.19. The best single bot, a yield-curve steepener variant, made $1,695 on 31 trades with a profit factor of 1.79. The week of November 2 cost the fleet $2,094.
The edge lives in the exits. On the paper fleet, time-based exits, targets and trailing stops earned $6,688. Stops, thesis-invalidation exits and signal reversals cost $5,156. Losses were many and small; gains were fewer and larger.
Risk controls did the heavy lifting. Stops capped single-trade losses. Circuit breakers sidelined a bot for four days after one large loss on November 5. Staleness checks blocked trading on frozen prices, and stale-data warnings ran into the hundreds or thousands in every bot’s log. Sizing by stop distance kept position sizes small.
Several things are not solved. The AI planner’s forecasts were far too uniform. The five news analyses in one of today’s reports contradict one another on basic levels like VIX, the dollar index and gold. The options-chain step returned zero usable strikes. A drift test on paper-trade P&L reads 0.23, close to the level where I would call the distribution “shifted.”
Where the numbers come from
Every number in this article comes from one of eight sources, and each chart names its source. Here is how much weight each deserves.
1. Trading Bot Portfolio Term Sheet (30 pages, generated 3:29 p.m. ET). This is the backtest of record. It covers five strategies, each tested on Interactive Brokers historical four-hour bars. The header says one year of data, but the test windows actually vary by bot. Treasuries run from March 31, 2026, gold from April 7, 2025, crude from October 28, 2024, and natural gas from February 21, 2024. It reports P&L, win rate, Sharpe, Sortino, Calmar, drawdowns, Kelly fractions, monthly return tables and each bot’s last 20 trades. The document itself says its results are simulated and hypothetical, and that they do not reflect actual slippage, commissions or market impact.
2. Trading Analysis report (16 pages, 3:30 p.m. ET). This report covers costs, margin, projected metrics and data connectivity. It confirms that none of the five strategies has a live trade yet. Every one still shows “no live trades recorded yet,” waiting on a broker data connection.
3. Trading Bot Portfolio Summary (3 pages, 3:49 p.m. ET). The planner’s capital plan: $132,000 across the five bots, 17 contracts, an average projected Sharpe of 1.70 and an average projected win rate of 51.6%. Treat those as targets, not results.
4. Integration Signals and Options Chain Analysis (5 and 9 pages, 3:29 p.m. ET). These describe how options overlays could complement each profitable bot. In today’s run, both found zero actionable signals, because the options download returned no live Greeks for these contracts. I come back to this below.
5. Futures Trading Strategy Report (26 pages, 3:08 p.m. ET). A bundle of five AI-generated analyses of the day’s news flow across rates, commodities, FX, equity indices and crypto. This is my main source for the market narrative, and also the weakest source of hard levels, for reasons I show with a chart.
6. Profitable Bots: Trading Rules (25 pages). The rulebook behind the strategies. It is proprietary, so I use it only to describe ideas in general terms.
7. My bot console (read-only, about 5:30 p.m. ET). The fleet view showed 17 bot processes running, every one connected to the market-data gateway and every one flat. Their logs, which I pulled through the console’s read-only log endpoint, contain every simulated entry and exit since mid-September. Every exit carries the tag mode=SIMULATED.
8. My own calculations. Bootstraps, drift tests, Kelly growth curves and the like. Charts built on these say so, and the ones that use made-up numbers are stamped ILLUSTRATIVE.
One more caution before the numbers. A backtest is a hypothesis, not a track record. Paper trading on a live feed is a better test, because the bot cannot see the future and has to cope with real data gaps, but it still assumes perfect fills. Neither is the same as money at risk. I treat backtests as a ranking of ideas, paper trading as a check on whether those ideas survive contact with a real market, and neither as proof.
Part 1: The tape the bots had to trade
Rates and the Fed: the reason everything moved
Every other move in this article traces back to the interest-rate market. The Futures Trading Strategy Report describes a market that a year ago was pricing rate cuts and is now pricing a hike. Its key points:
Inflation surprised to the upside. October core CPI rose 0.3% for the month against a 0.2% consensus, and shelter inflation also ran at 0.3%.
Fed speakers turned hawkish. Governor Waller signaled that a 50-basis-point hike in December is possible if core inflation runs at 0.3% or more. Dallas Fed President Lorie Logan argued for two more hikes in 2027.
Futures moved to match. One analysis puts the CME FedWatch probability of a 25-basis-point December hike at about 84%. It says Fed funds futures for December imply about 5.375%, and the first cut of 2027 has been pushed back to June from March.
The yield curve stayed inverted. The analyses put the 2-year/10-year spread between −10 and −50 basis points, depending on which one you read, and describe the 10-year yield as near or above 5% after the print.
Demand for Treasuries looked soft. At Monday’s three-year auction, indirect bidders, a proxy for foreign demand, took 55.5%, the lowest share since August 2025. Direct bidders took 35%, the highest since 2018.
For a futures trader this is the hard part. A hike priced at 84% leaves little room for relief and plenty of room for a further hawkish surprise. Rate volatility feeds into every other asset through the dollar, through discount rates on stocks, and through the carrying cost of commodities and bitcoin.
Equities: a 4% day and a short-gamma market
According to the reports, the S&P 500 fell 4.36% on November 6, its worst day since April 2025. Equity index futures sold off again after the CPI print. The reports put the VIX at about 22 to 25 and say dealers are short gamma, which means their hedging tends to amplify moves rather than damp them. Over its last 20 trades, my S&P micro-futures bot entered at prices that fell from 7,806.50 on August 27 to 7,469.75 on November 5. That is a 4.3% slide in its own data, and choppy enough to stop out short and long trades alike.
Energy: oil reverses, natural gas splits by region
Crude oil did not trend in one direction. My WTI crude bot’s own data shows the micro WTI contract rising from the high $60s in June to about $97 on November 2, then dropping fast. Its last three entries were at $95.75, $92.10 and $88.53, and each one was stopped out. The reports explain the drop: Brent fell 4% on rumors of a Hormuz deal, and one analysis puts Brent about 20% below its October high. They also describe weak European diesel margins, a 3.2-million-barrel build in U.S. distillate stocks, and refiners hedging by shorting crude.
Natural gas splits by region. One analysis says U.S. Henry Hub prices are up 8% in November on electricity demand from AI data centers. In Europe, prices are under pressure from mild weather forecasts, a liquefied natural gas glut and storage at 95% of capacity. My natural gas bot’s data tells a rougher story for the U.S. contract it trades. Its last 20 entries fell from $3.72 in July to $2.88 on October 30. The October slide cost it $18,727 in the backtest, its worst month on record.
Metals and the dollar
The reports agree on direction here even where they disagree on levels. A stronger dollar and higher real yields are weighing on gold. One analysis puts the 10-year TIPS yield at +2.3%, and another reports $2.1 billion of gold ETF outflows in November. My gold bot’s entry prices tell the same story: about $5,577 in early March, $4,090 on October 28. Silver is lagging gold, with the gold/silver ratio at about 85, and one analysis cites a China manufacturing PMI of 49.2 as a sign of weak industrial demand.
Crypto
The reports describe a CPI-driven crypto selloff. Bitcoin is below $74,000, the CME December bitcoin future is near $73,500, futures open interest is falling as positions are liquidated, and traders are buying downside puts. One analysis notes that bitcoin and oil are now falling together on Fed-hike fears and warns against holding both long. None of the bots in this article trades crypto, but crypto’s selloff signals the same risk-off mood.
Correlation: why one shock hits everything
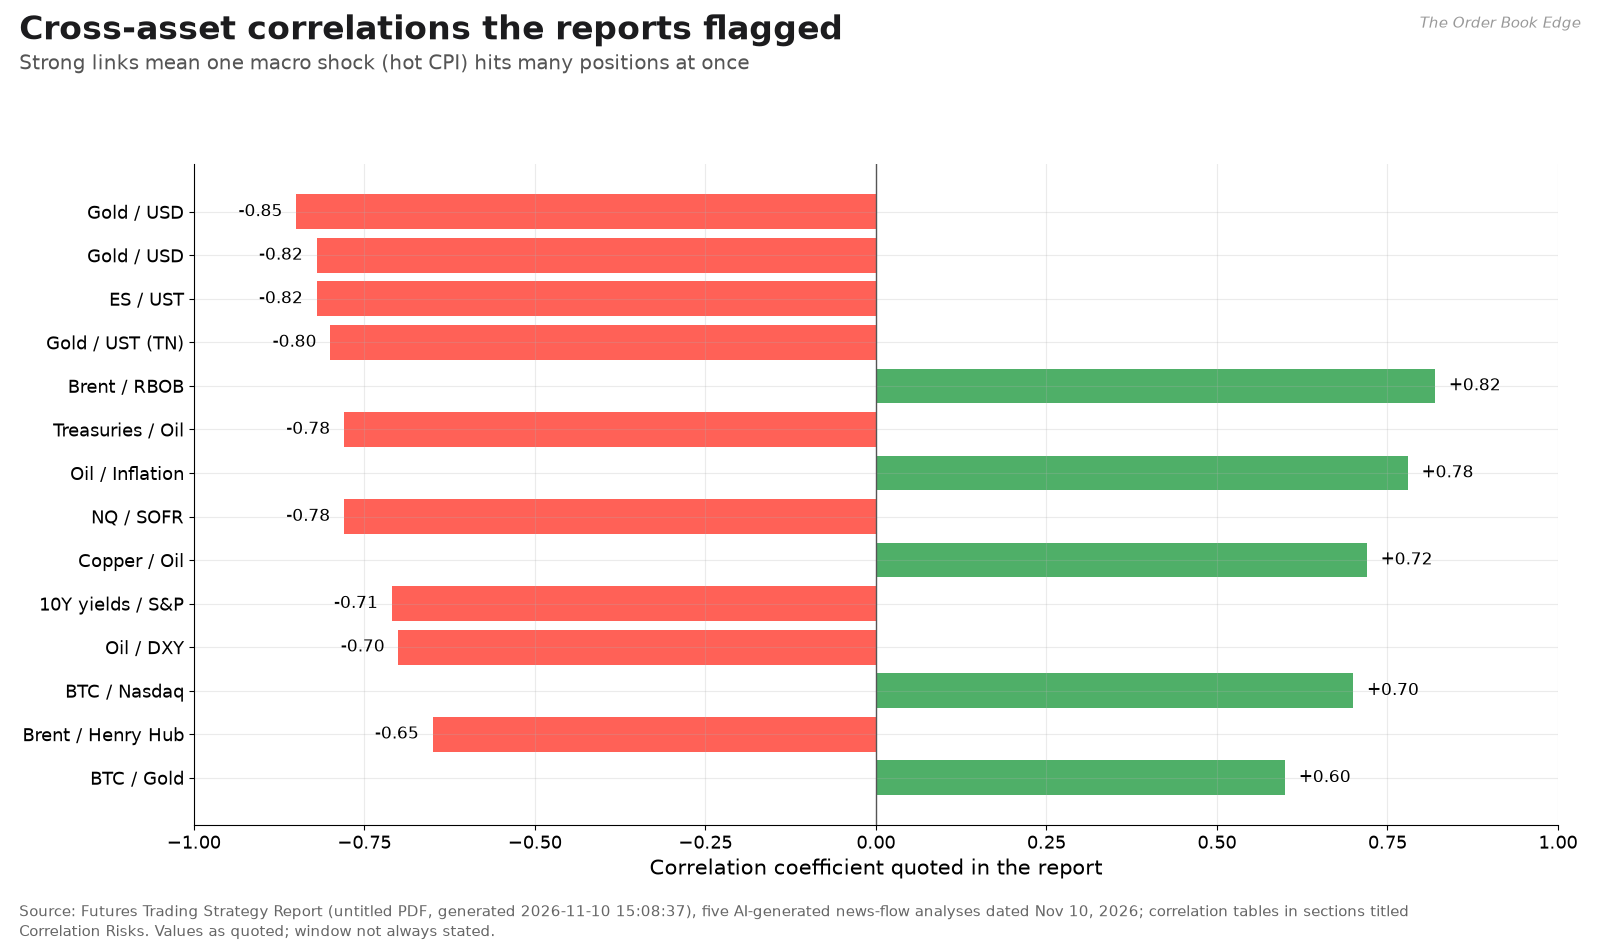
The reports’ correlation tables matter more than any single price level. When gold moves at −0.82 to −0.85 against the dollar, the S&P at −0.82 against Treasuries, and oil at −0.78 against Treasuries, one macro shock reaches every position through the same channel. A fleet that looks diversified by asset class, with gold, gas, bonds, crude and stocks, can behave like one big bet on the Fed.
The variance of a portfolio of bots makes this concrete:

Here wᵢ is the capital weight on bot i, σᵢ is the volatility of that bot’s returns, and ρᵢⱼ is the correlation between bots i and j. When the ρᵢⱼ rise toward ±1 in a shock, the cross terms take over and diversification disappears just when you need it. That is why portfolio rules cap risk per sector and in total, and why a correlation check sits inside the risk gate before any new position. I describe that in Part 6.
A warning about the research itself
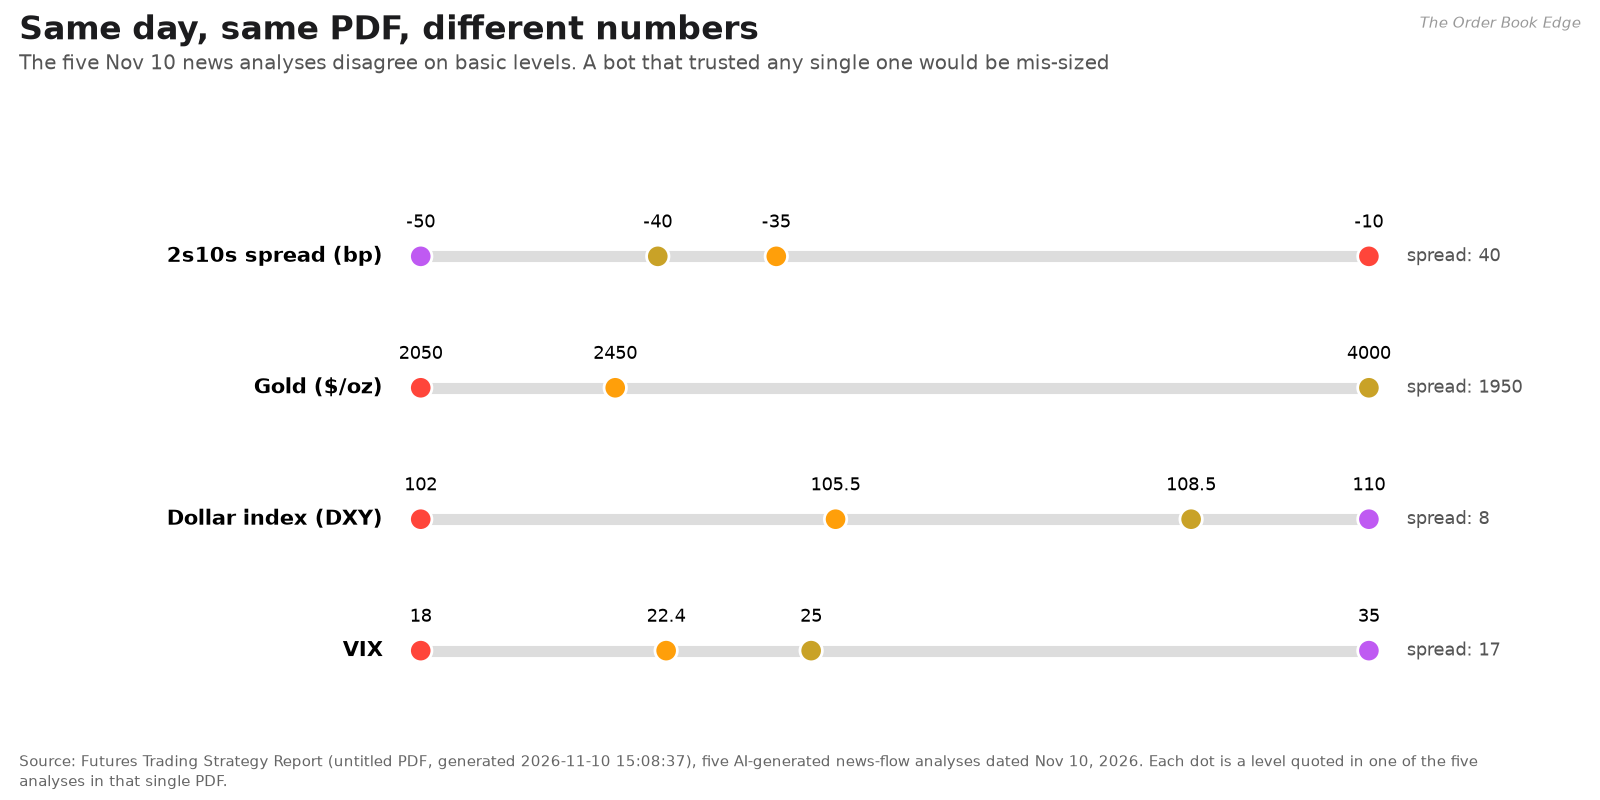
This was the most instructive finding of the day, and it has nothing to do with any bot. The Futures Trading Strategy Report bundles five separate AI-written analyses of the same day’s news. They do not agree on basic facts:
VIX: 18, about 22, 22.4, above 25, and above 35.
Dollar index (DXY): below 102, 105.50, 108.50, and above 110.
Gold: about $2,050, $2,450, and $4,000.
Natural gas: $3.80 for the December contract in one analysis. My natural gas bot’s own data shows entries near $2.88 to $3.00.
S&P 500: one analysis cites December put spreads at 4,800/4,600. My S&P bot’s data shows the micro contract trading near 7,470 to 7,800.
Only some of these levels match the bots’ own market data. The $4,000 gold figure fits the gold bot’s recent entries, for example. Several others are clearly not today’s market. For a human reader, that is a reason to check sources. For an automated pipeline, the lesson is stricter: narrative inputs can set direction and context, but they must never set price levels, position sizes or stop distances. Those have to come from the bot’s own data feed. My bots size from their own bars, which is a big part of why the errors in these reports did not turn into errors in positions.
The narrative still has value, because the themes agree even where the numbers don’t. Inflation is persistent, the Fed is leaning toward a hike, the dollar is firm, risk appetite is falling, and correlations are high. That is a hostile backdrop for long-only commodity strategies and for anything that bets on a Fed pivot, and the scoreboard below reflects it.
Part 2: The leaderboard
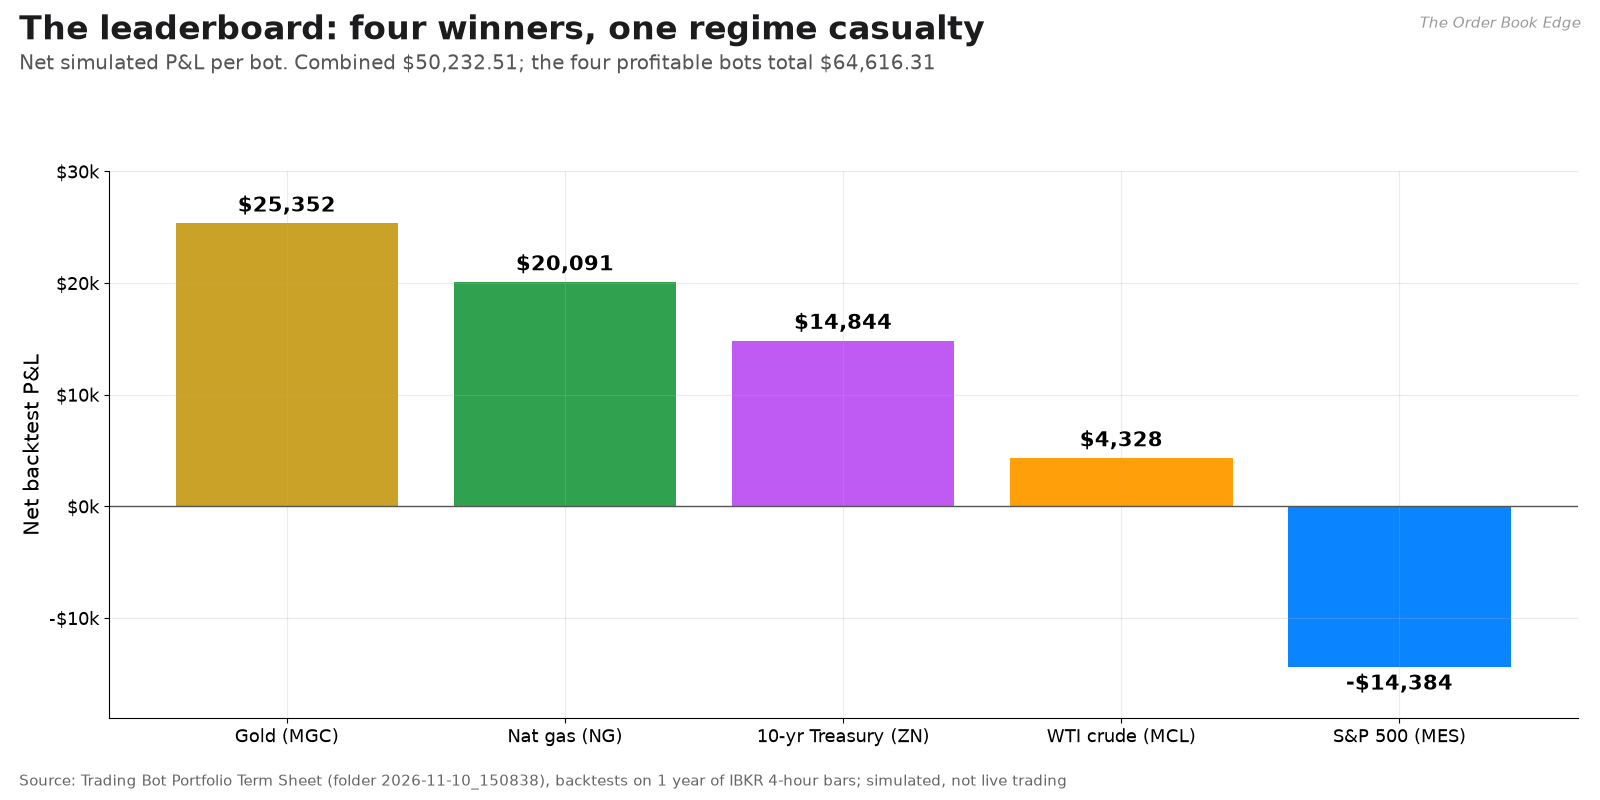
The term sheet ranks five strategies. All of them trade micro or small futures contracts with modest capital allocations, from $20,000 to $35,000 each. Four were profitable in their backtests and one was not:
Micro Gold USD Weakness Hedge (MGC, long only): +$25,352.50 on 67 trades.
Micro Natural Gas Winter Demand Momentum (NG, long only): +$20,091.07 on 110 trades.
Micro 10-Year Treasury Yield Curve Steepener (ZN, long and short): +$14,844.31 on 45 trades.
Micro WTI Crude Oil Backwardation Breakout (MCL, long only): +$4,328.43 on 25 trades.
Micro E-Mini S&P 500 Fed Pivot Momentum (MES, long and short): −$14,383.79 on 65 trades.
The four profitable bots total $64,616.31, and adding the S&P bot’s loss brings the combined figure to $50,232.51. Those headline numbers hide very different risk profiles, so the rest of this section looks at the measures that separate a durable edge from a lucky run.
Risk-adjusted return: Sharpe, Sortino and Calmar
The Sharpe ratio measures return per unit of total volatility:
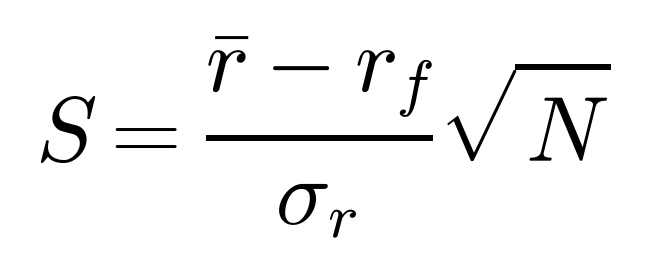
Here r̄ is the average return per period, r_f is the risk-free return per period, σ_r is the standard deviation of returns, and N is the number of periods per year. The factor √N turns a per-period figure into an annual one.
The Sortino ratio replaces total volatility with downside deviation, so upside swings are not counted as risk:

Here τ is a target return, usually zero or the risk-free rate, and rₜ is the return in period t.
The Calmar ratio compares annual return with the worst peak-to-trough loss:
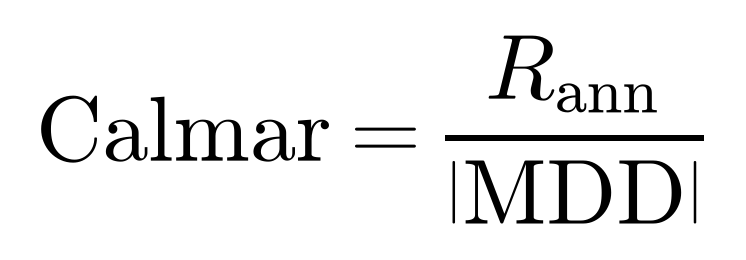
R_ann is the annualized return and MDD is the maximum drawdown, defined next.
Drawdown: the number that ends careers
Define equity Eₜ as starting capital plus cumulative P&L. The drawdown at time t is the percentage drop from the running peak, and the maximum drawdown is the worst of those:

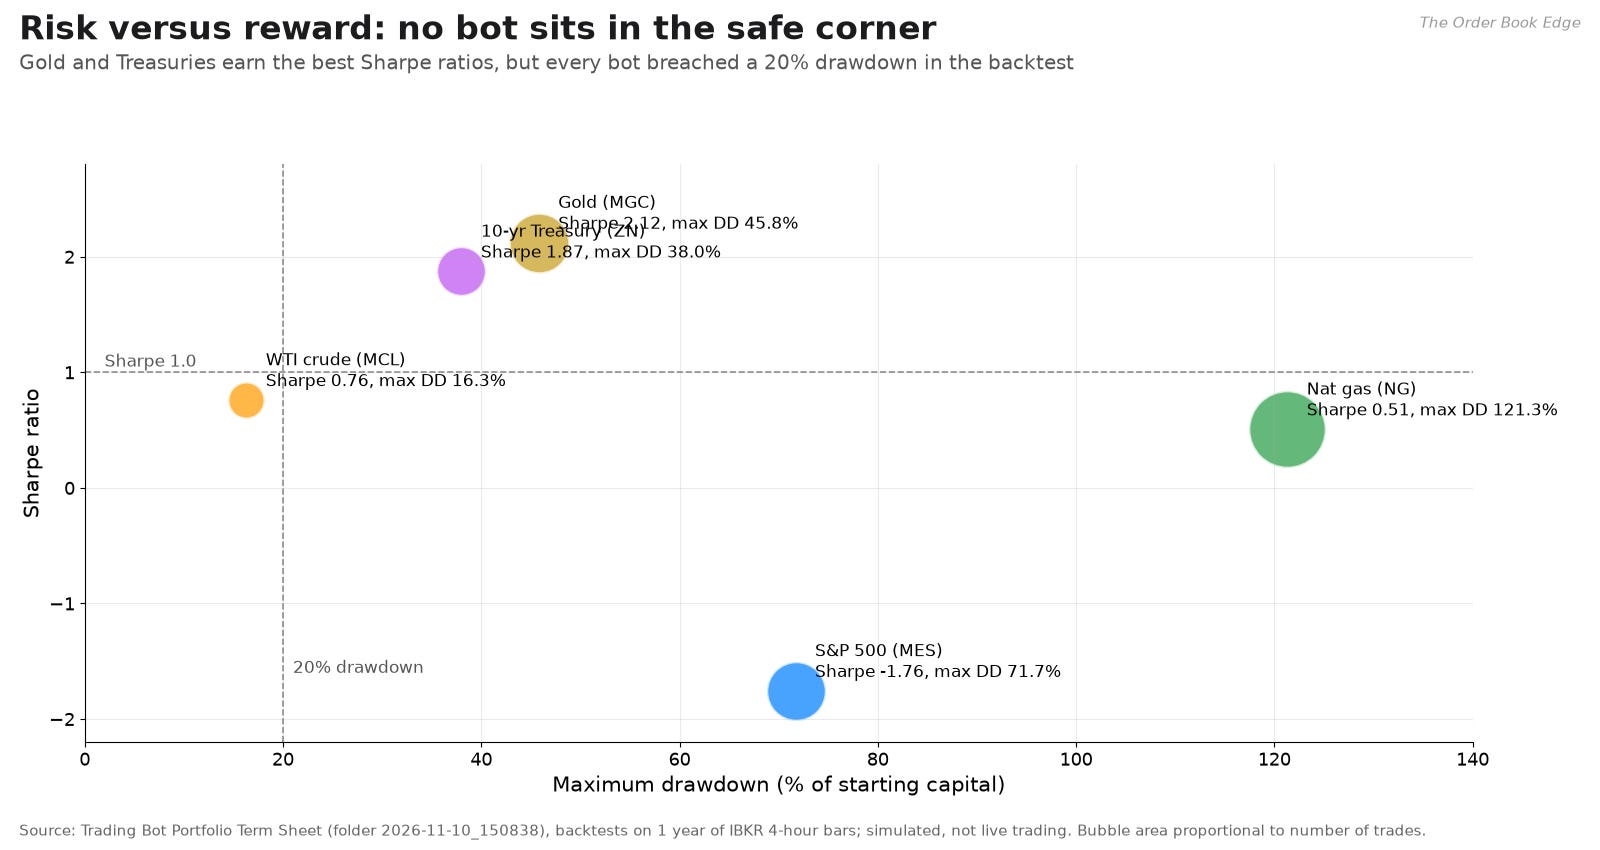
Plotting Sharpe against drawdown is the quickest way to see the trade-offs:
Gold has the best Sharpe ratio, 2.12, with a Sortino of 7.39 and a Calmar of 2.77. But its maximum drawdown was $9,161.86, or 45.8% of its $20,000 starting capital.
Treasuries are close behind, with a Sharpe of 1.87, a Sortino of 7.62 and a maximum drawdown of $8,362.17, or 38.0% of $22,000.
Natural gas made the second-most money, but its Sharpe is only 0.51. Its drawdown was $42,458.93, or 121.3% of its $35,000 starting capital. In real money that means the account would have needed new capital, or it would have been closed out.
Crude has the smallest drawdown, 16.3%, but also the smallest return, 7.1% annualized, and a Sharpe of 0.76.
The S&P bot has a negative Sharpe of −1.76 and a 71.7% drawdown.
The rulebook targets a Sharpe above 1 and a maximum drawdown below 20%. No bot meets both. The term sheet’s own compliance notes flag a drawdown breach for all five strategies. The leaders are better than the rest, not safe.
Win rate, payoff and profit factor
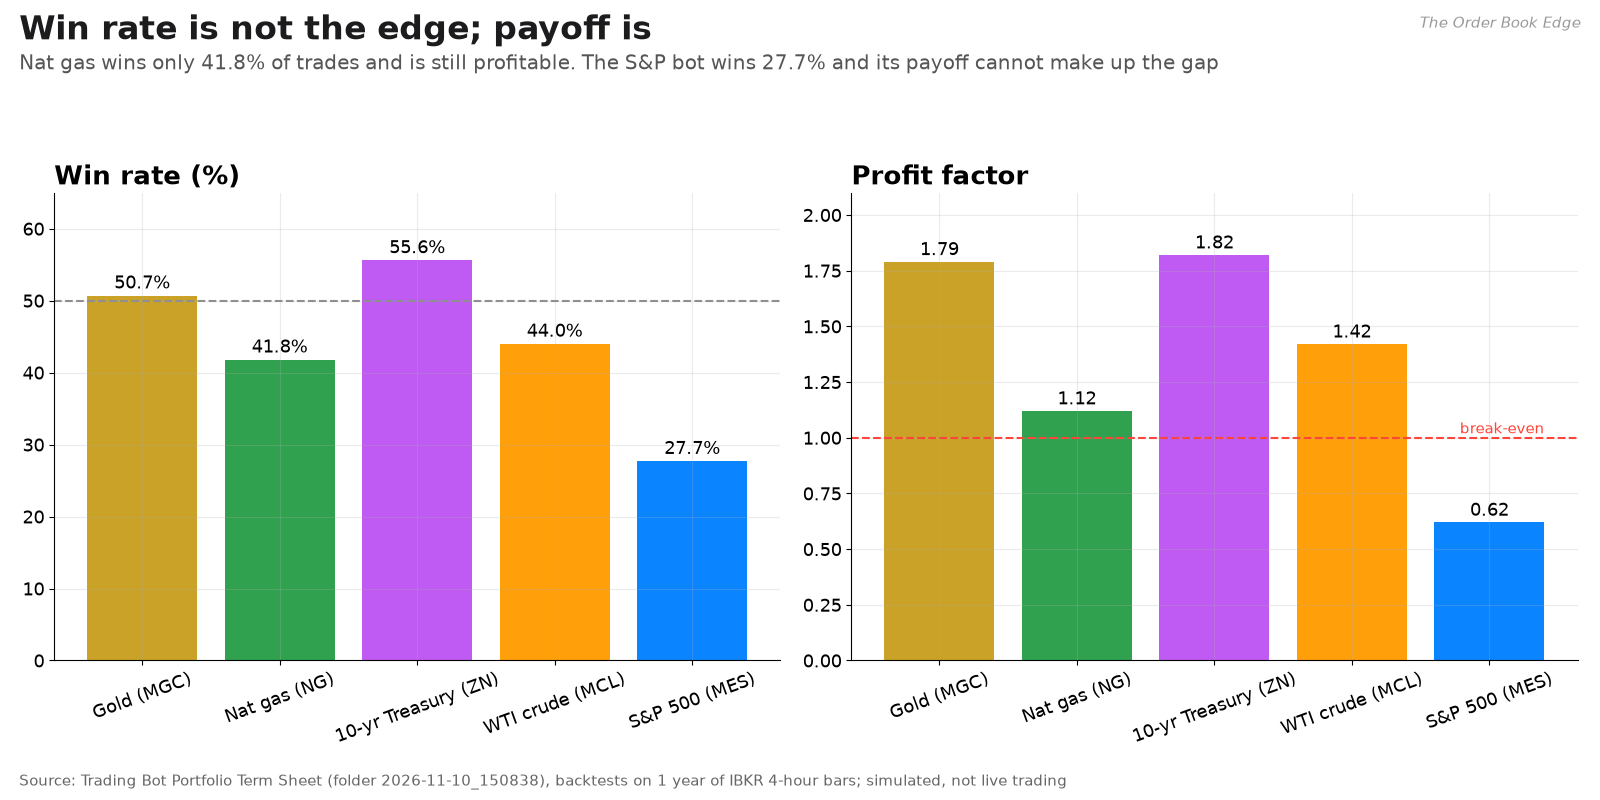
The profit factor is gross profit divided by gross loss:
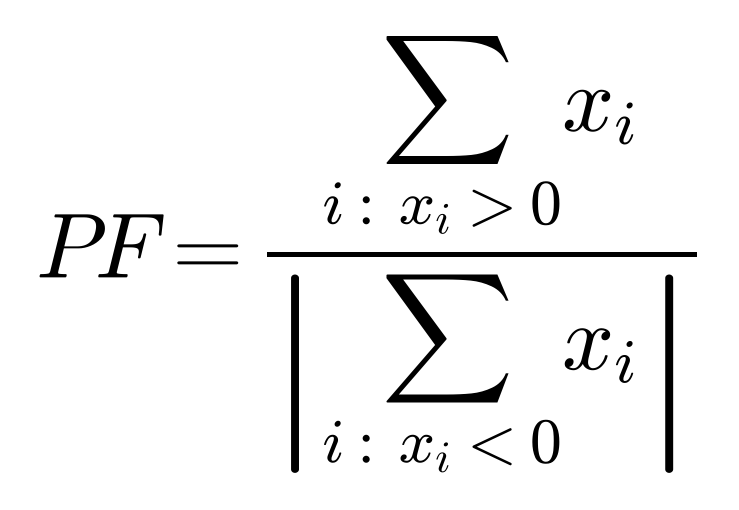
Here xᵢ is the P&L of trade i. A profit factor above 1 means the strategy made money. Treasuries score 1.82 and gold 1.79, crude 1.42, natural gas 1.12, and the S&P bot 0.62.
Win rate on its own says little. Natural gas wins only 41.8% of its trades and is still profitable, because its average win, $4,078.34, is about 1.56 times its average loss of $2,617.38. The S&P bot’s payoff ratio is a respectable 1.62, with an average win of $1,303.36 against an average loss of $805.20. But it wins only 27.7% of the time, and that is not enough.
Expectancy per trade combines the two:

Here p is the win rate, W̄ is the average win, and L̄ is the average loss as a positive number. With payoff ratio b = W̄/L̄, setting expectancy to zero gives the break-even win rate:
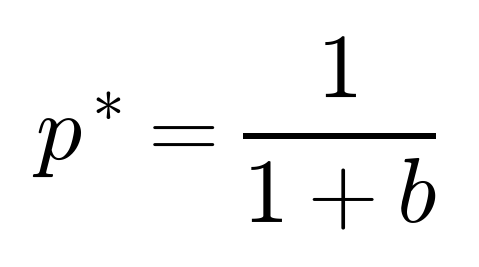
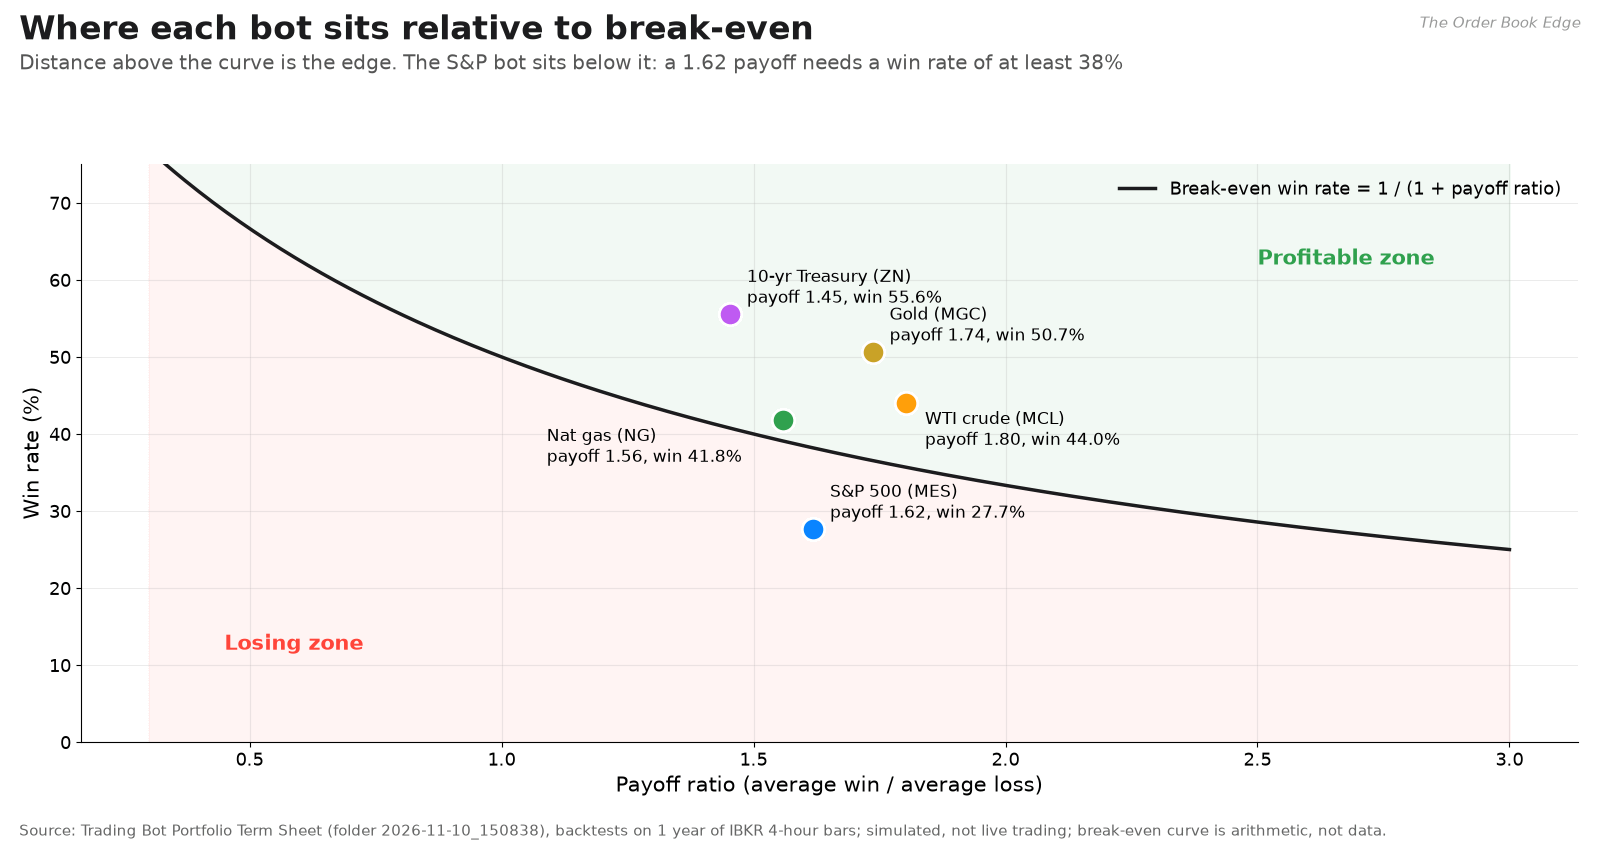
Each bot’s distance above that curve is its edge. For the S&P bot, a payoff of 1.62 needs a win rate of at least 38.2%, and it managed 27.7%. Gold, at a 1.74 payoff, needs 36.5% and achieves 50.7%. Treasuries need 40.8% at a 1.45 payoff and achieve 55.6%. Natural gas and crude sit much closer to the line, which is why their Sharpe ratios are low.
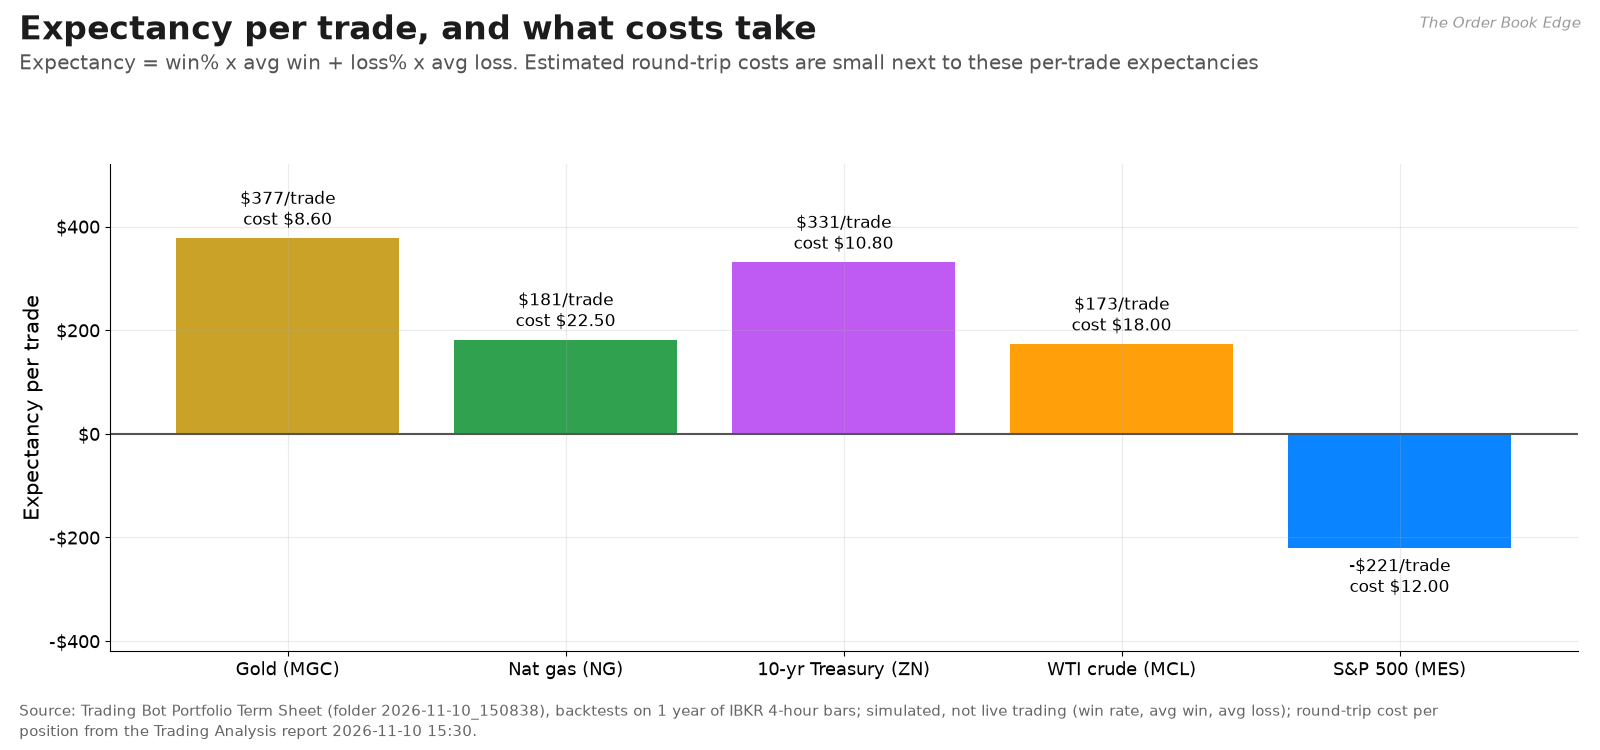
In dollars, expectancy per trade works out to about $377 for gold, $331 for Treasuries, $181 for natural gas, $173 for crude and −$221 for the S&P bot. These match the average P&L per trade implied by each bot’s totals, which is a useful consistency check on the reports. The Trading Analysis report estimates round-trip exchange and commission costs of $3.60 to $4.50 per contract, or $8.60 to $22.50 for each bot’s planned position. Those costs are small next to the expectancies. Slippage in a fast market like today’s could be larger, and the backtest does not include it.
The planner’s forecasts versus reality
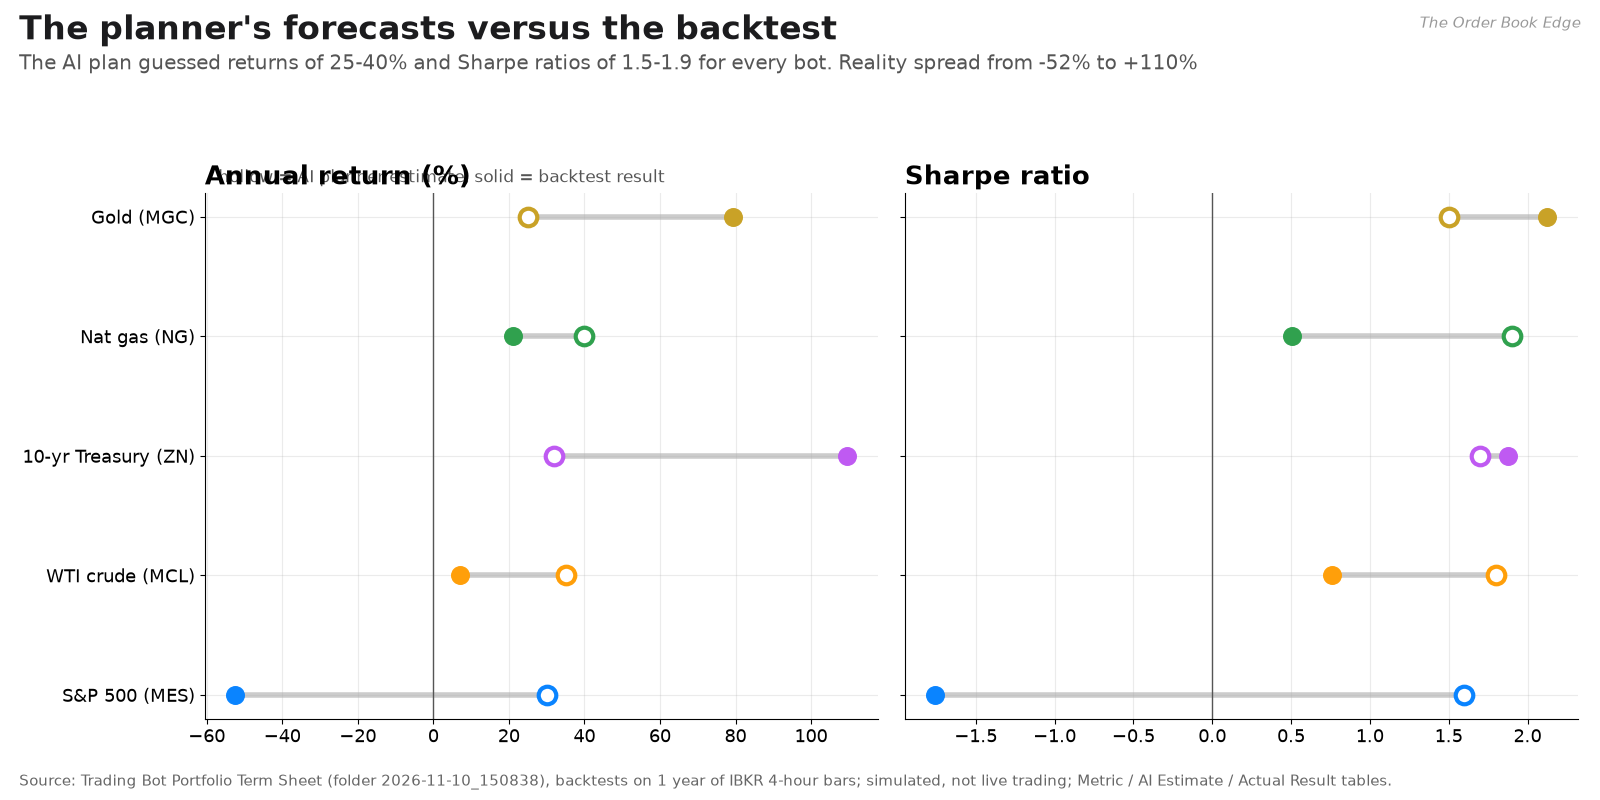
The pipeline’s AI planner writes a forecast for each strategy before the backtest runs. The forecasts are suspiciously uniform: annual returns of 25% to 40%, Sharpe ratios of 1.50 to 1.90, and win rates of 48% to 55% for every bot. The backtest results range from −52.4% to +109.5% a year, with Sharpe ratios from −1.76 to 2.12. The planner called the S&P bot a 30% annual return with a 1.60 Sharpe. The backtest delivered −52.4% and −1.76. It also expected maximum drawdowns of 10% to 18%, and the actual figures ran from 16.3% to 121.3%.
The lesson is the same as with the news reports. A language model can generate plausible hypotheses, but only data can rank them. My pipeline treats the planner’s numbers as a starting prior and lets the backtest overrule them, which is the right order.
Part 3: The top bots, one by one
For each bot I describe the strategy only conceptually, report its backtest statistics, and show how it dealt with the past few weeks. The exact rules stay private.
#1 by P&L: the gold bot
Idea. A long-only gold strategy that buys when the dollar is weakening and safe-haven demand is rising, and requires confirmation from the shape of the gold futures curve. In plain terms, it is a macro-conditioned trend strategy. It wants a falling dollar, rising fear and a supportive futures curve all at the same time.
Backtest. These figures cover 67 trades from April 2025 to November 2026, from a $20,000 start:
Overall: P&L of $25,352.50, a 79.4% annualized return, 34 winners and 33 losers (50.7%), and a profit factor of 1.79.
Trade sizes: an average win of $1,690.13 against an average loss of $973.09. The largest win was $3,485.14 and the largest loss $2,209.07.
Streaks: at most 5 wins in a row and 6 losses in a row.
Risk: VaR at 95% was 7.7%, and the full Kelly fraction was 22.4%.
Monthly results: only 5 of 15 months were profitable. The best was January 2026 at +$17,350, a gain of 86.7%.
That last point says a lot. This bot makes its money in a few large bursts and bleeds slowly the rest of the time. 2026 shows the pattern: +$17,350 in January, losses in six of the next seven months, +$6,712 in August, then losses again in September and October.
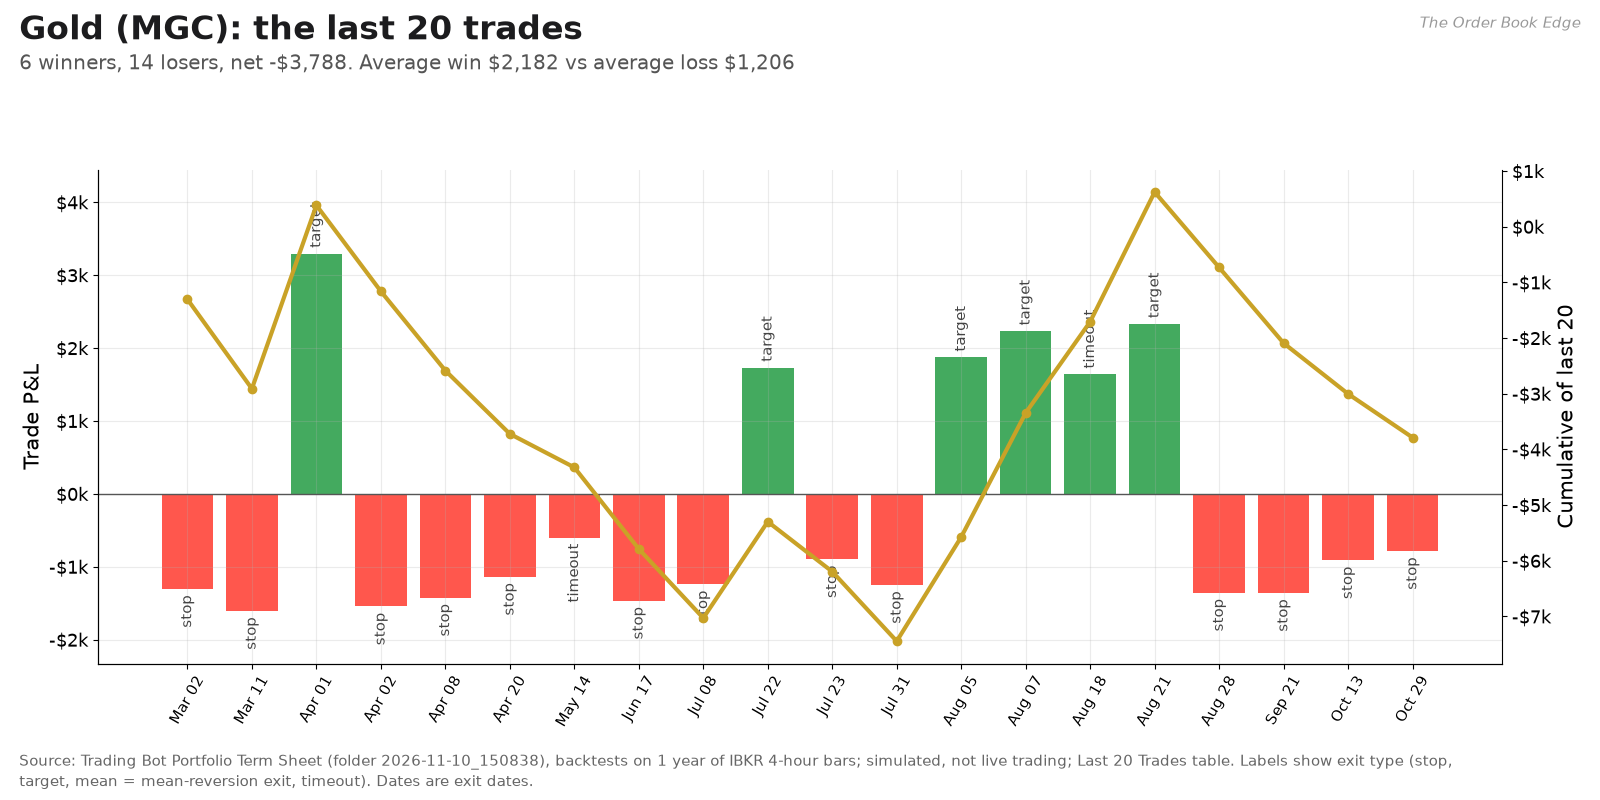
This week. The gold bot made no trades in November. That is the main point. Its conditions require a weaker dollar and a supportive futures curve, and this month offered neither. The dollar firmed, real yields rose, and gold fell from above $5,500 in March to about $4,090 at its last entry on October 28. That entry was stopped out within eight hours for a $784 loss. Since then the bot has stayed out. The term sheet labels the current gold regime “normal volatility, bearish trend.” A long-only strategy whose conditions say “not now” is working as designed when it stays flat.
The weakness is plain in the last-20 chart: 6 winners and 14 losers, for a net loss of $3,788. The bot’s edge depends on rare large wins, such as the $3,294 target hit on April 1 or the run of four winners in early August. Between those, it pays for many small losses. Anyone sizing a strategy like this has to fund the dry spells.
#2 by P&L: the natural gas bot
Idea. A long-only natural gas momentum strategy built around winter demand. It looks for seasonal demand pressure and tightness in the near-month calendar spreads, and confirms with weather patterns. Conceptually it is seasonal momentum with a fundamental filter.
Backtest. These figures cover 110 trades from February 2024 to November 2026, from a $35,000 start:
Overall: P&L of $20,091.07, a 21.1% annualized return, a 41.8% win rate and a profit factor of 1.12.
Risk-adjusted: a Sharpe of 0.51 and a Sortino of 1.95.
Trade sizes: an average win of $4,078.34 against an average loss of $2,617.38. The largest win was $13,200 and the largest loss $7,023.21.
Drawdown and Kelly: a maximum drawdown of $42,458.93, or 121.3%, and a full Kelly fraction of 4.5%.
By year: +$9,745 in 2024, +$31,171 in 2025 and −$20,825 so far in 2026.
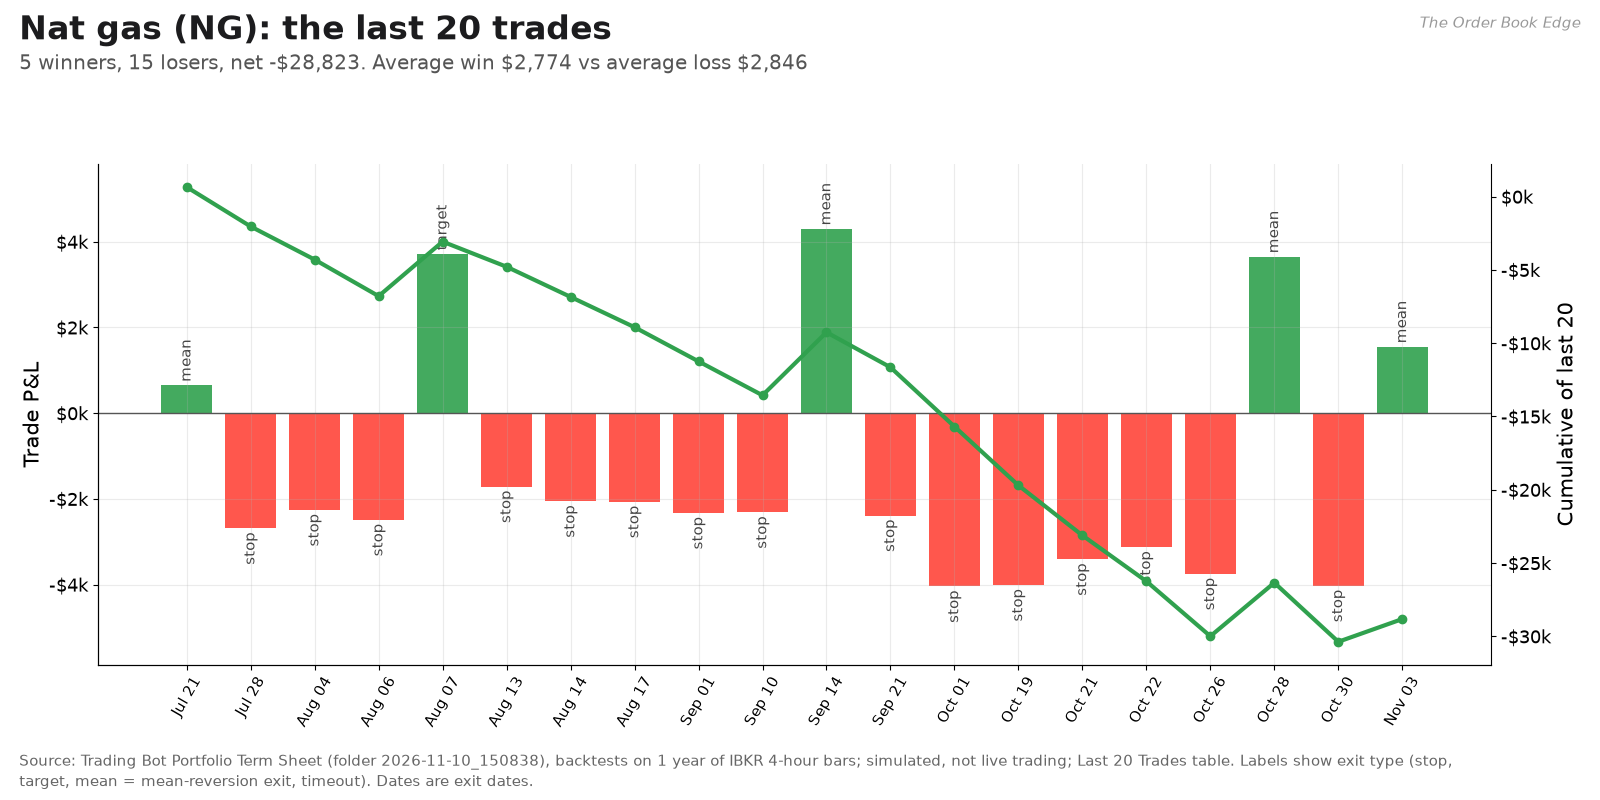
This week. The natural gas bot is the leaderboard’s cautionary tale. Most of its gains came in 2025, and its 2026 has been bad. March made $13,023, but July, August, September and especially October lost money. October alone cost $18,727, a 53.5% monthly loss on starting capital. The cause is clear in the trade list. From late September to the end of October, six of the bot’s seven trades hit their stops while the price slid from $3.37 to $2.88. Its only winner in that stretch, on October 28, was a mean-reversion exit.
November is a small bright spot. The bot’s only trade this month closed on November 3 for +$1,550 on a mean-reversion exit. The term sheet now labels the regime “elevated volatility, bullish 20-bar trend,” and natural gas is the only one of the five markets with short-term volatility above its long-term norm. The Kelly fraction of 4.5% is the honest verdict on this edge. The strategy has an edge, but it is thin, and the term sheet’s sizing note recommends a minimal allocation.
#3 by P&L: the Treasury bot
Idea. A two-way strategy in 10-year Treasury futures that trades the yield curve and the market’s expectations for Fed policy. It reads signals from the slope of the curve and from positioning in short-term rate futures. Unlike the commodity bots, it can go short, and that matters in a week when bonds sold off.
Backtest. These figures cover 45 trades over a short window, March 31 to November 11, 2026, from a $22,000 start:
Overall: P&L of $14,844.31, a 109.5% annualized return, 25 winners and 20 losers (55.6%), and a profit factor of 1.82.
Risk-adjusted: a Sharpe of 1.87, a Sortino of 7.62 and a Calmar of 1.78.
Trade sizes: an average win of $1,320.40 against an average loss of $908.29. The largest loss was $1,356.03.
Drawdown and Kelly: a maximum drawdown of 38.0% and a full Kelly fraction of 25.0%.
Monthly results: five of seven months were profitable, with May through August all positive and June the best at +$8,888.
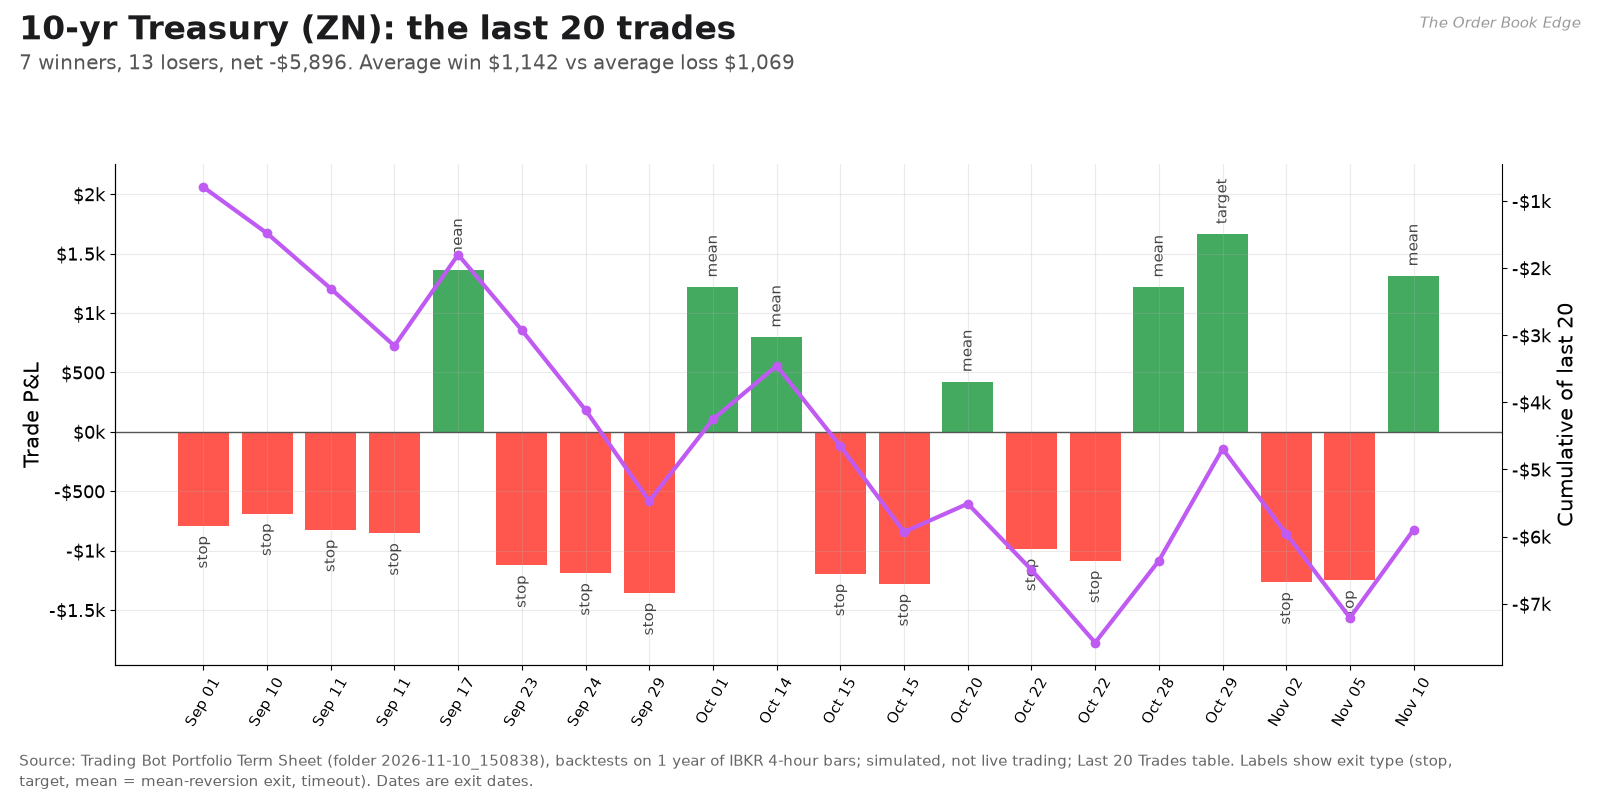
This week. The Treasury bot’s recent record is mixed, and it’s worth being precise about it:
September was bad. Seven of its eight long trades that month were stopped out as bond prices fell, and the month cost $5,471.
October brought a switch. The bot went short and posted a small gain of $778 for the month.
November 2 and 5: two short trades were stopped out as bonds bounced ahead of the data.
November 10: a short opened on November 5 at 107.30 closed at midday at 106.86, after the hot CPI print pushed bond prices down. It made $1,312.50 on a mean-reversion exit.
That last trade is the clearest example in this article of a bot handling the day’s conditions. The bot held a position aligned with the macro thesis (higher yields, a hawkish Fed). It survived two small stop-outs on the way, and it took profit into the move rather than giving it back.
The honest footnote: the last 20 trades net −$5,896, with 7 winners and 13 losers. The full-sample statistics are strong, but the sample is only 45 trades over seven months. A 55.6% win rate on 45 trades has a standard error of about 7.4 percentage points:
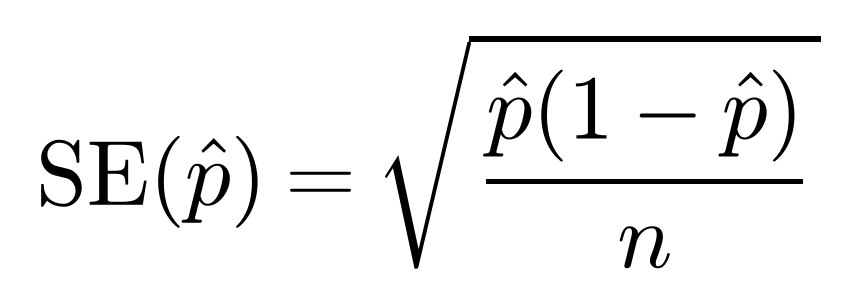
Here p̂ is the measured win rate and n is the number of trades. A rough 95% interval for the true win rate is p̂ ± 1.96·SE, or about 41% to 70%. The bottom of that range is right at the 40.8% break-even rate for this bot’s payoff ratio. In other words, the data cannot yet rule out that this edge is zero.
#4 by P&L: the crude oil bot
Idea. A long-only crude strategy that looks for breakouts when the futures curve is in backwardation, meaning near-month contracts trade above later ones, a sign of tight near-term supply. Refined-product spreads confirm the signal. It is a carry-aware breakout strategy.
Backtest. These figures cover 25 trades from October 2024 to November 2026, from a $30,000 start:
Overall: P&L of $4,328.43, a 7.1% annualized return, 11 winners and 14 losers (44.0%), and a profit factor of 1.42.
Risk-adjusted: a Sharpe of 0.76.
Trade sizes: an average win of $1,340.44 against an average loss of $744.03.
Drawdown and Kelly: a maximum drawdown of 16.3%, the best on the board, and a full Kelly fraction of 12.9%.
Monthly results: seven of ten months were profitable.
The crude bot has the best last-20 record of any bot: +$4,123, with 9 winners against 11 losers. It caught the summer and early-autumn rally from below $70 to above $90 with targets and mean-reversion exits.
This week. It got hit hard. After entering long at $97.47 on November 2, it was stopped out four times in a row, from November 3 to today. Those four stops cost $4,887.85 and produced its worst month, −16.3%. The losses were contained by design: each was between $999 and $1,463. But a long-only breakout strategy cannot profit from a sharp reversal driven by news, in this case the Hormuz-deal rumors and weaker refining margins. The relevant control here is the circuit breaker, a limit on losses per day and per week, and I come back to it in Part 6.
The casualty: the S&P 500 bot
Idea. A two-way equity-index strategy that trades on expectations of a Fed pivot, using rate-futures positioning and yield-curve signals, with momentum confirmation on intraday bars.
Backtest. These figures cover 65 trades from a $25,000 start:
Overall: a loss of $14,383.79, a −52.4% annualized return, 18 winners and 47 losers (27.7%), and a profit factor of 0.62.
Risk-adjusted: a Sharpe of −1.76.
Drawdown and Kelly: a maximum drawdown of 71.7%, a losing streak of up to 10 trades, and a Kelly fraction of −17%.
The term sheet’s diagnosis is “REGIME_COLLAPSE.” The strategy was profitable early on, from March to May 2026, and then stopped working when conditions changed. June cost $7,354 and November so far $4,739.
The reason is in its name. The strategy’s thesis is a Fed pivot toward easing, and 2026 delivered the opposite: a Fed moving toward a hike. When the macro premise fails, a momentum confirmation layer on top cannot rescue it. The term sheet recommends adding a regime filter, a circuit breaker after a run of consecutive losses, and position sizes that shrink as drawdown grows. It flags the strategy as under review before any live deployment. That is the right call, and probably the most valuable output of the whole pipeline today.
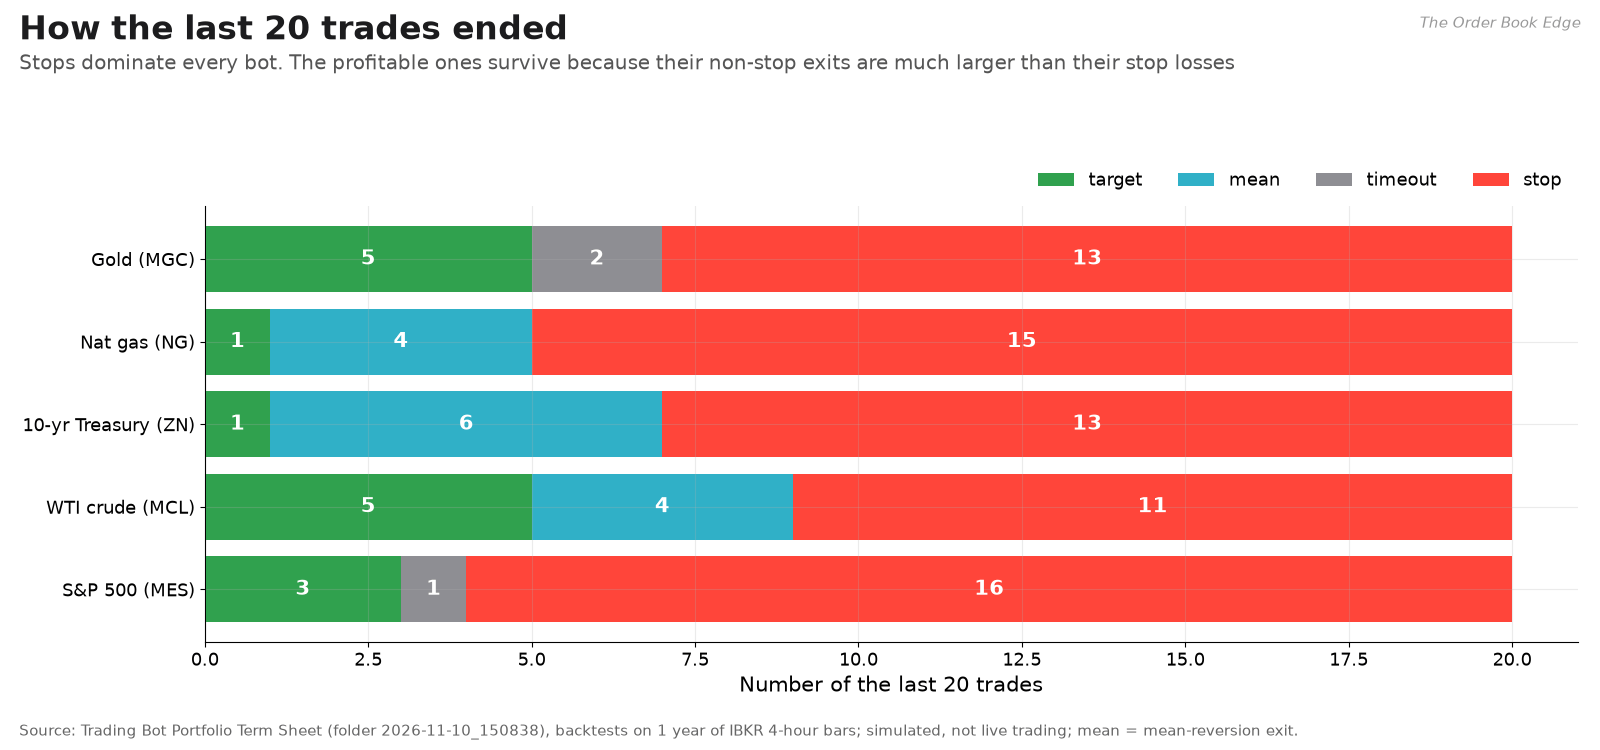
Across all five bots, stops account for most of the last 20 exits. That is normal for strategies with a payoff ratio above 1. The strategies that are working survive because their non-stop exits (targets, mean-reversion exits, timeouts) are much larger than their stopped losses. When that gap closes, as it has for natural gas over its last 20 trades, the edge disappears.
Part 4: 2026 month by month
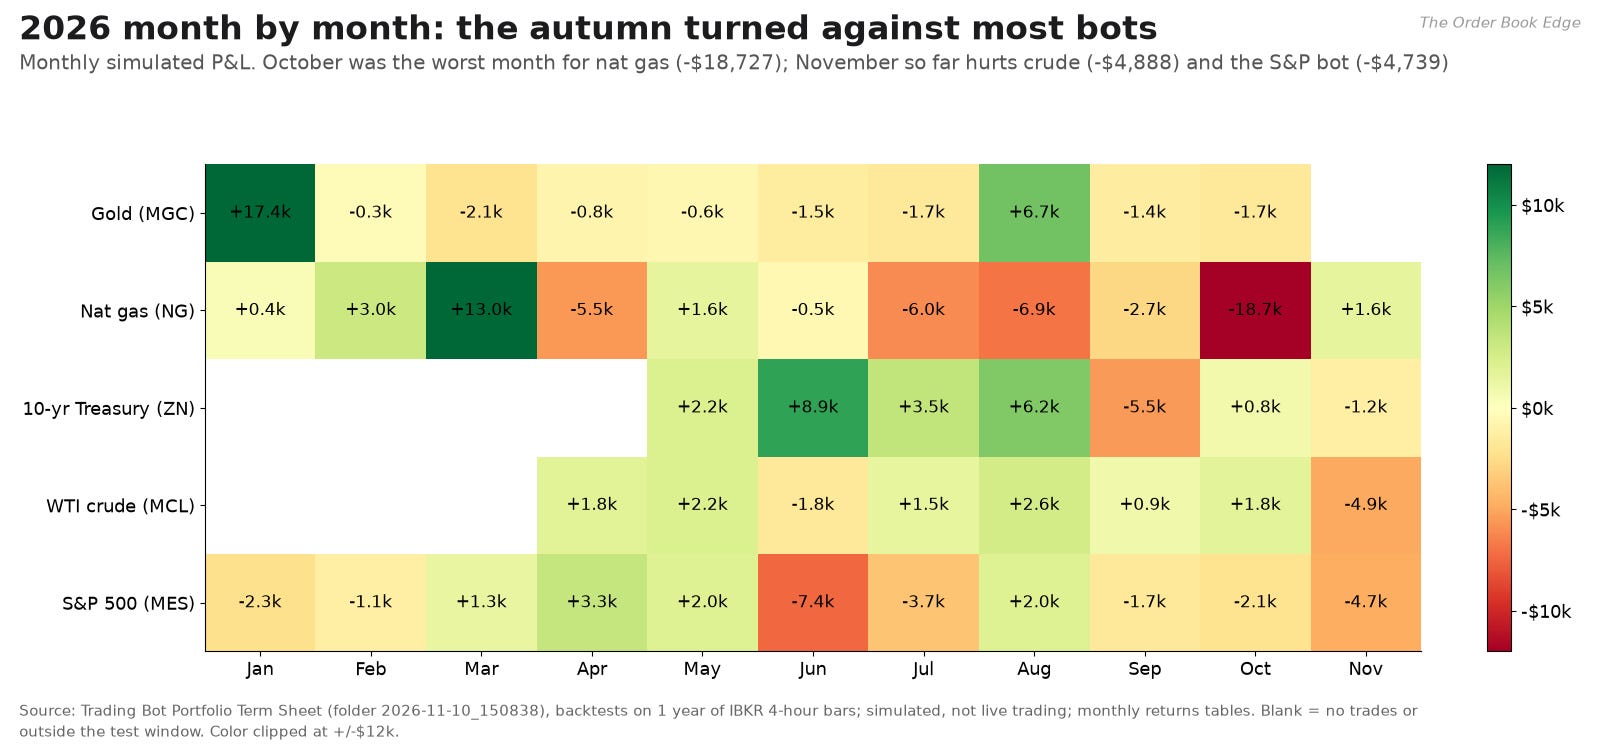
The monthly heatmap shows how the year unfolded. Spring was good for nearly everyone: gold’s January, natural gas’s March, Treasuries from May through August, and crude from April to October apart from June. Autumn was not. September was negative for gold, natural gas, Treasuries and the S&P bot. October was natural gas’s worst month. November so far has hurt crude and the S&P bot.
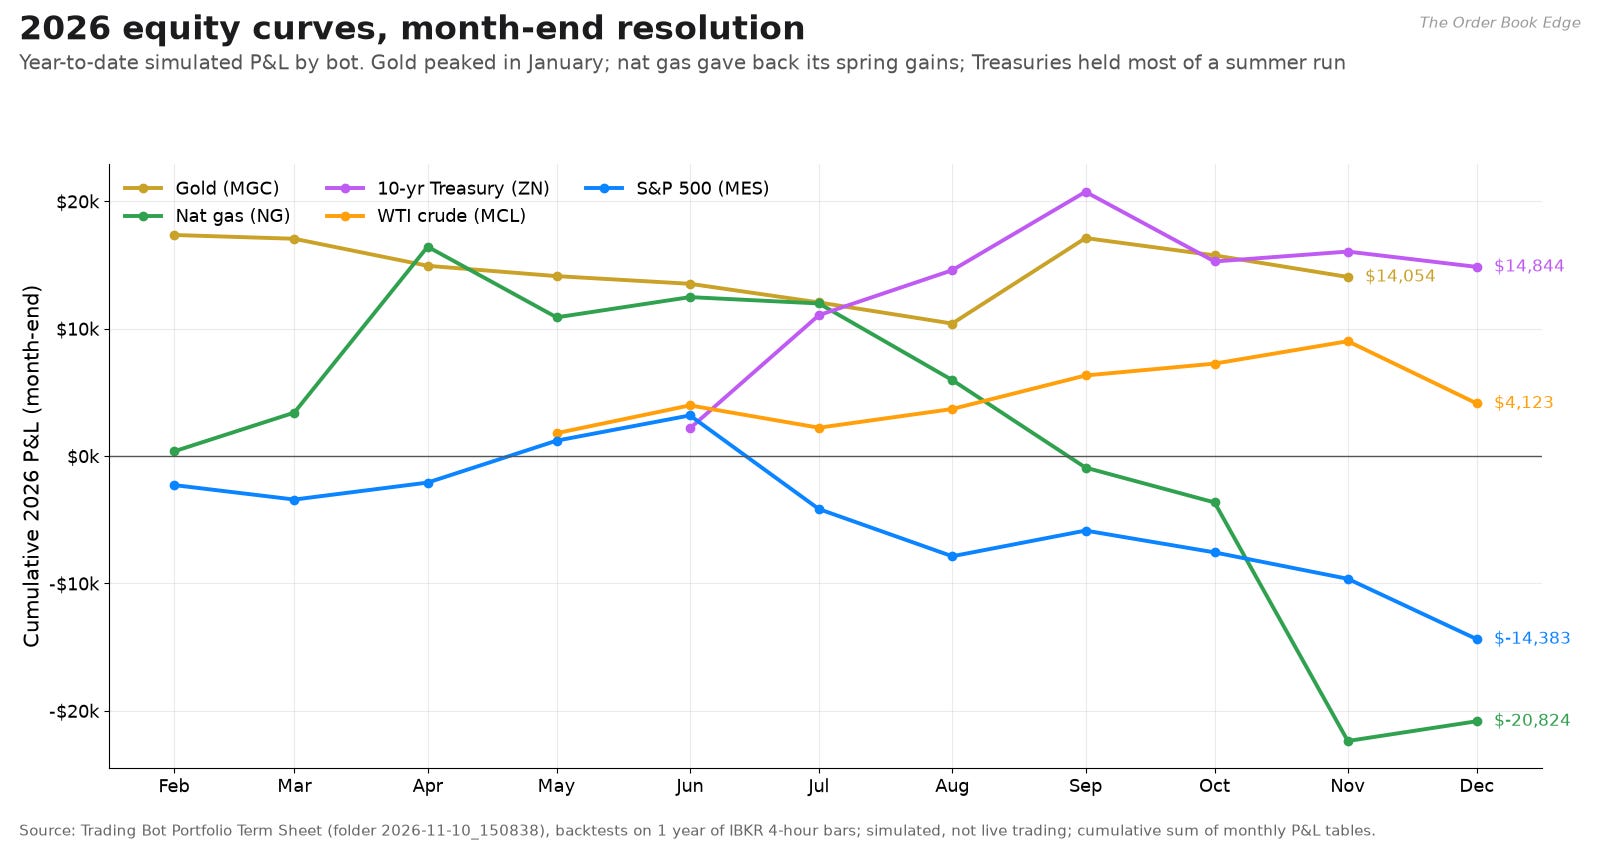
The cumulative 2026 curves show the same thing as equity. Gold is still up about $14,055 for the year, but almost all of that came in January. Natural gas is down $20,825 for 2026, which wipes out more than half of its 2024-25 gains. Treasuries are up $14,844 and have held most of their summer run. Crude is up $4,123 year to date. The S&P bot is down $14,384.
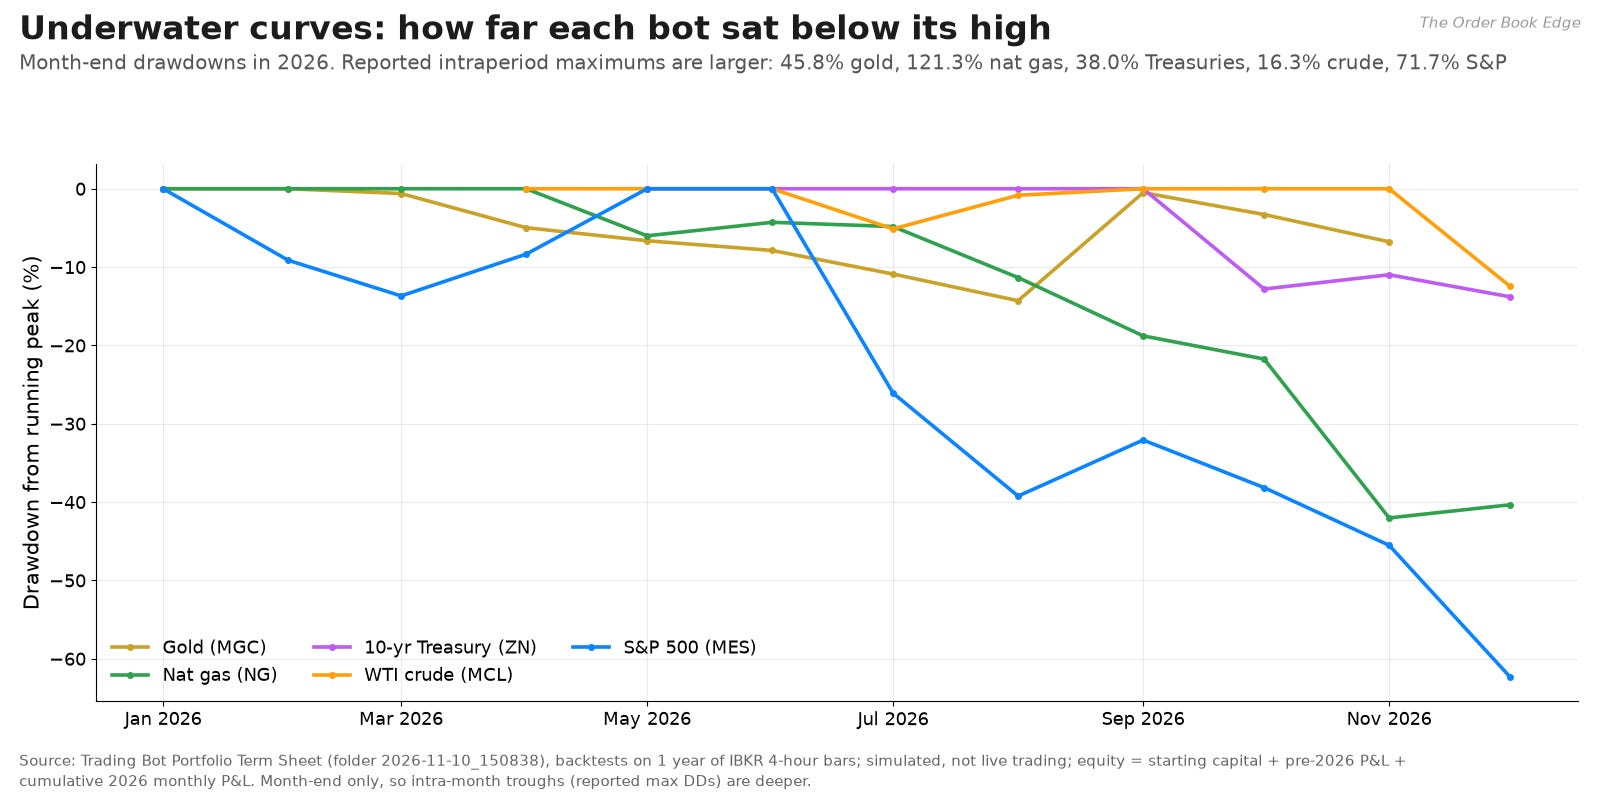
These underwater curves use month-end equity only. That understates the true intramonth troughs, which the term sheet reports as maximum drawdowns from 16.3% to 121.3%. Even at month-end resolution the pattern is clear. Every bot except crude spent most of the autumn below its high-water mark.
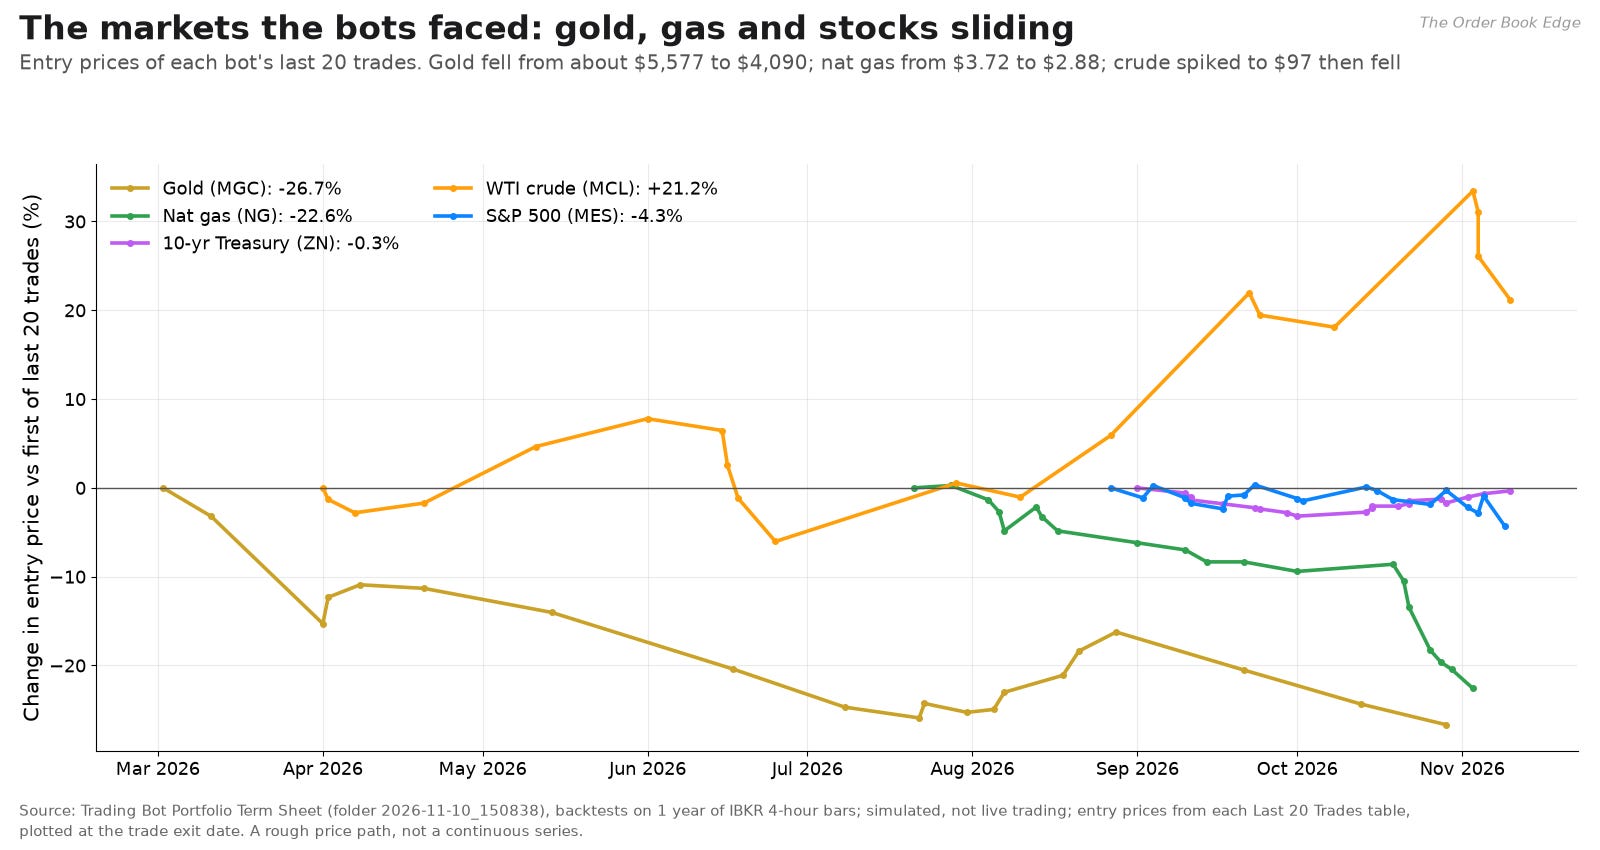
This chart answers the obvious question: what market were these bots trading? I plotted the entry prices of each bot’s last 20 trades. It is a rough price path, not a continuous series, but it is drawn from the bots’ own data rather than from any news report. Gold is down about 27% from its first entry in March, natural gas about 23% from July, and the S&P micro future about 4%. Crude rose about 21% before giving back part of the gain this month. Treasuries swung, down into late September and back up through early November.
November: the stress test
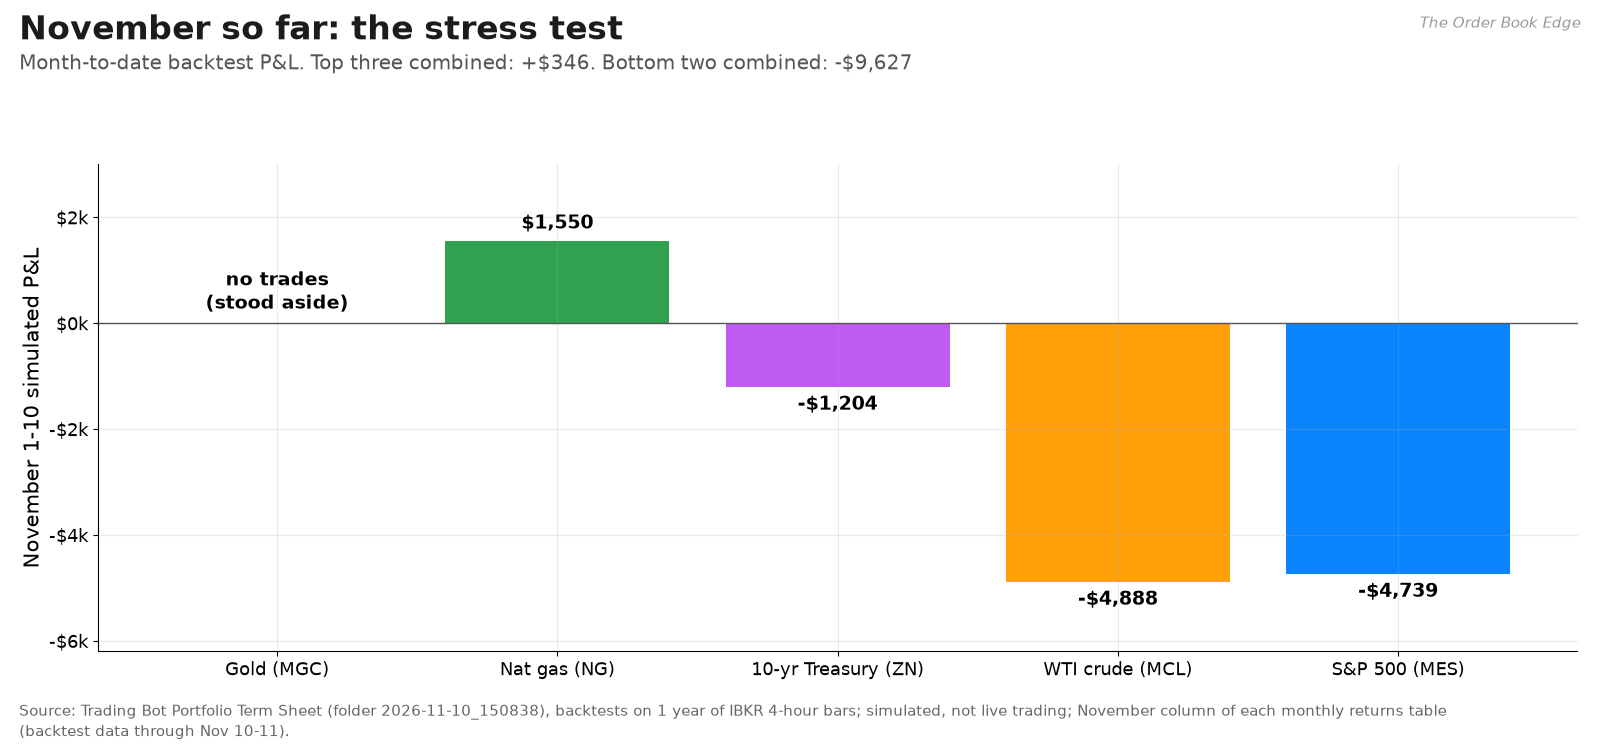
November is only ten days old, but it is the best test of how these strategies behave when the backdrop turns against them all at once:
Gold: no trades, $0. Its conditions were not met, so it stood aside.
Natural gas: one trade, +$1,550. A mean-reversion exit on November 3.
Treasuries: three trades, −$1,204. Two stops, then today’s +$1,312.50 winner.
Crude: four trades, −$4,888. Four consecutive stops into the oil reversal.
S&P 500: four trades, −$4,739. Four stops in a whipsaw market.
The top three bots combined made $346 in a month when their markets were falling and correlations were rising. The bottom two lost $9,627. The ranking did not come from forecasting skill. It came from structure. One bot’s conditions kept it out of the market. One bot took a quick profit. One bot could trade both directions and was positioned for higher yields. The two that suffered both relied on a continuation, of the oil rally or of a Fed pivot, that the week refused to deliver.
Part 5: From backtest to live feed, the paper-trading record
Backtests run on historical bars. My console runs bots against a live market-data gateway in simulation mode, so they make decisions in real time on real prices, with real data outages, but without sending orders. This is where an idea meets real market conditions. Everything in this section comes from the bots’ own logs, read through the console’s read-only log endpoint. Every exit carries the tag mode=SIMULATED.
When I read the console at about 5:30 p.m. ET:
17 bot processes were running.
11 trade 10-year Treasury futures, under four strategy families: a yield-curve steepener (six variants), a Treasury trend strategy (two), and yield-spike shorts (three).
6 are bar-based bots on the Russell 2000 (five) and the British pound (one).
All 17 were connected to the gateway, and all were flat.
The Treasury paper fleet
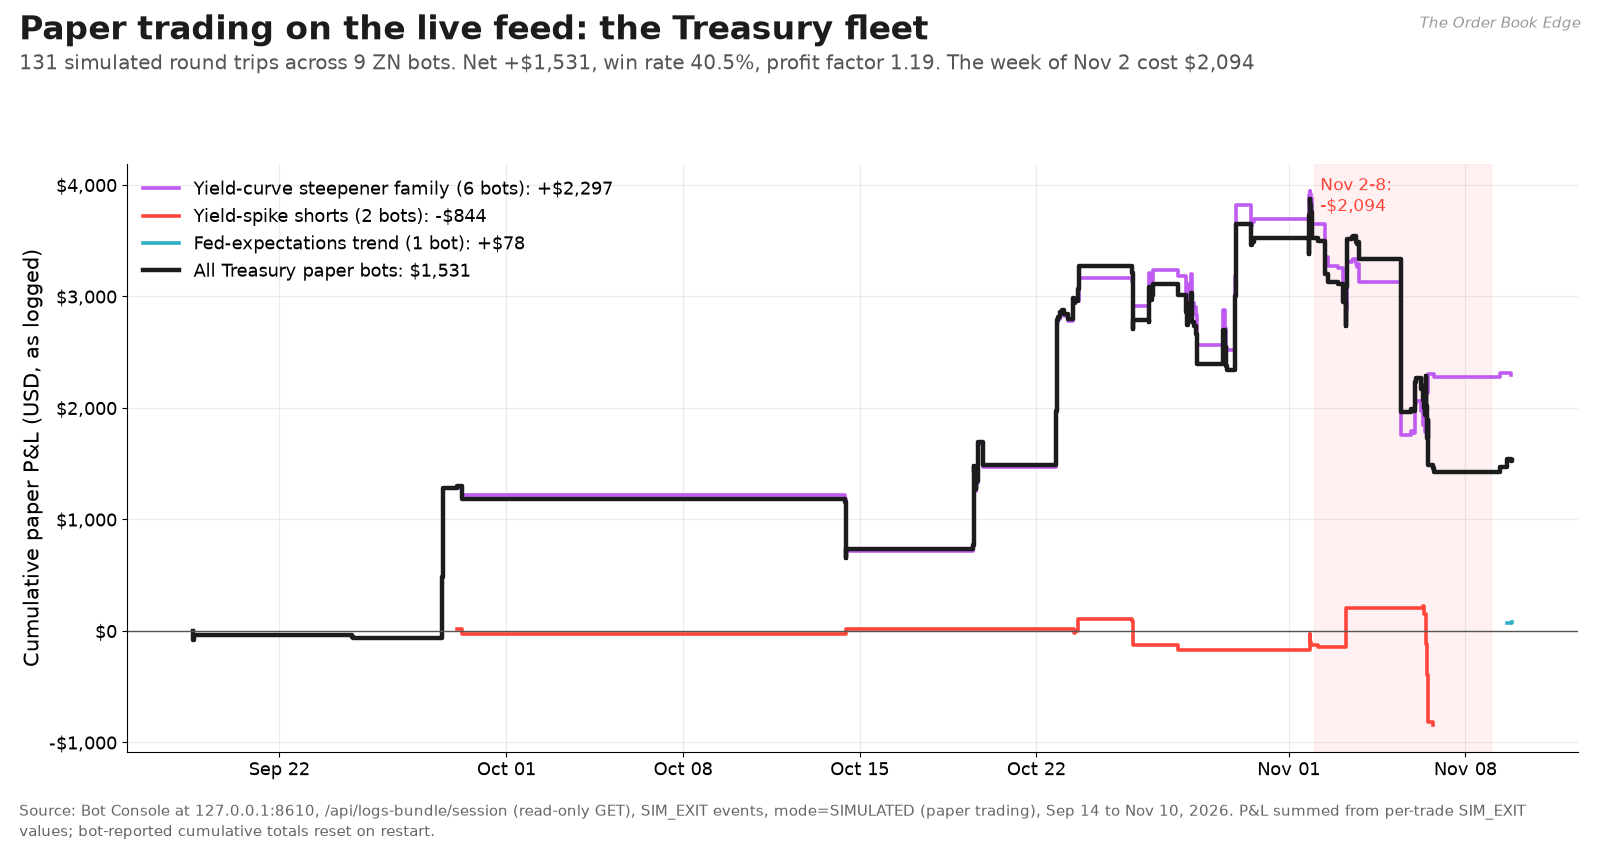
From September 18 through November 9, nine of the Treasury processes closed 131 simulated round trips:
Net P&L: +$1,531.25, as logged by the bots.
Win rate: 40.5% (12 trades closed flat).
Average trade: an average win of $177.62 against an average loss of $119.44, for a profit factor of 1.19.
Range: the best trade made $812.50 and the worst lost $1,375.00.
Drawdown: the deepest fall of the cumulative curve was $2,445.31.
The P&L is in the dollar units the bots log, with each tick of the 10-year contract worth $15.625.
The curve shows the same story as the backtests:
Through early November: a steady climb to a peak of +$3,875 on November 1.
The week of November 2 to 8: a sharp drop. The fleet lost $2,093.75 over 38 trades.
November 9 and 10: a small recovery of +$101.56 on four trades.
Split at October 26 to compare early and late periods:
Before October 26: 47 trades, a 51.1% win rate, a profit factor of 2.51 and +$2,789.
From October 26: 84 trades, a 34.5% win rate, a profit factor of 0.79 and −$1,258.
Something changed in late October, and the bots have not adapted to it yet.
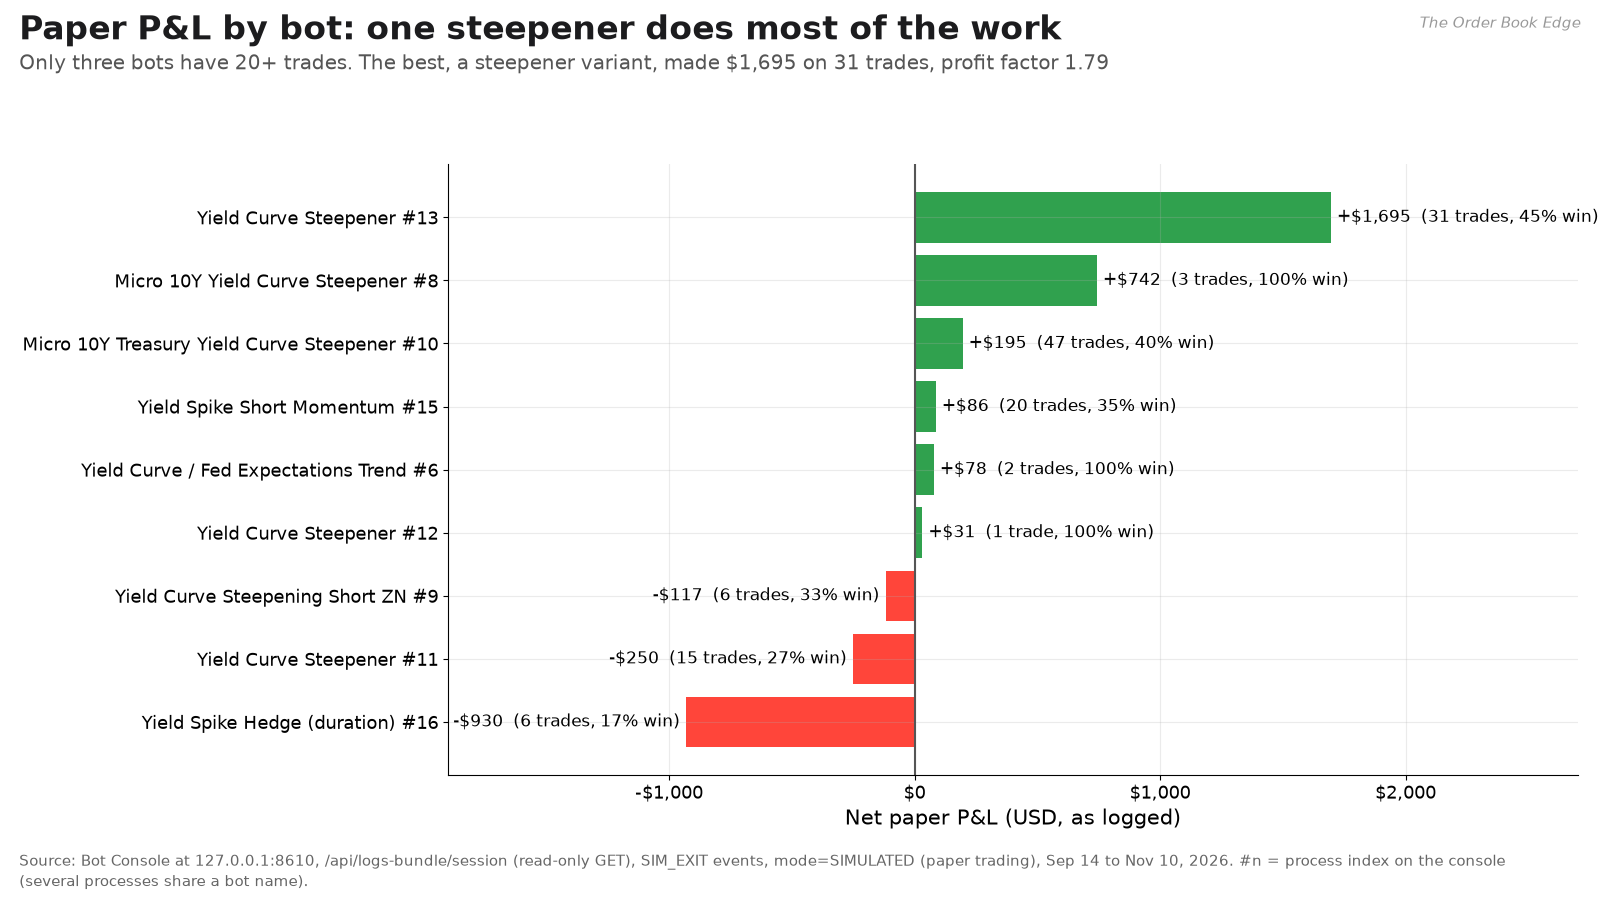
By bot, the results are concentrated:
Yield-curve steepener #13 made $1,695.31 on 31 trades. It won 45.2% of the time, with an average win of $273.44 against an average loss of $133.30 and a profit factor of 1.79. Its worst drawdown was only $835.94. This is the top paper performer, and it is the same concept as the #3 backtest bot.
Steepener #8 made $742.19 on just three trades, all trailing-stop exits.
The largest variant, steepener #10, made only $195.31 on 47 trades.
The weakest, a duration-pressure yield-spike hedge, lost $929.69 on six trades. Three of those losses came on November 6, the day of the 4.36% equity drop, and together cost $703.13.
Only three bots have 20 or more trades. That is far too few to separate skill from luck, and the next equation shows why.
Is the paper edge real? A t-test
The simplest significance check asks whether the average trade is distinguishable from zero:
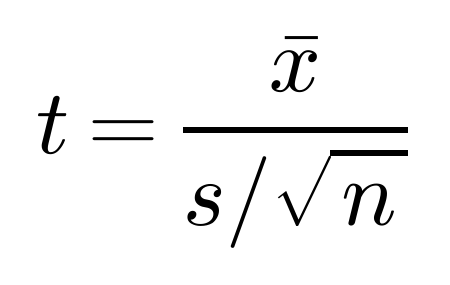
Here x̄ is the average P&L per trade, s is its standard deviation, and n is the number of trades. For the paper fleet, x̄ = $11.69, s = $236.03, and n = 131, which gives t ≈ 0.57. A value of about 2 is needed for conventional significance. The fleet’s +$1,531 is well within what chance alone could produce. The top steepener does better, with a per-trade Sharpe of about 0.20 on 31 trades and t ≈ 1.1, but that is still short of proof. This is the main reason none of these bots trades real money yet.
Where the money is made and lost
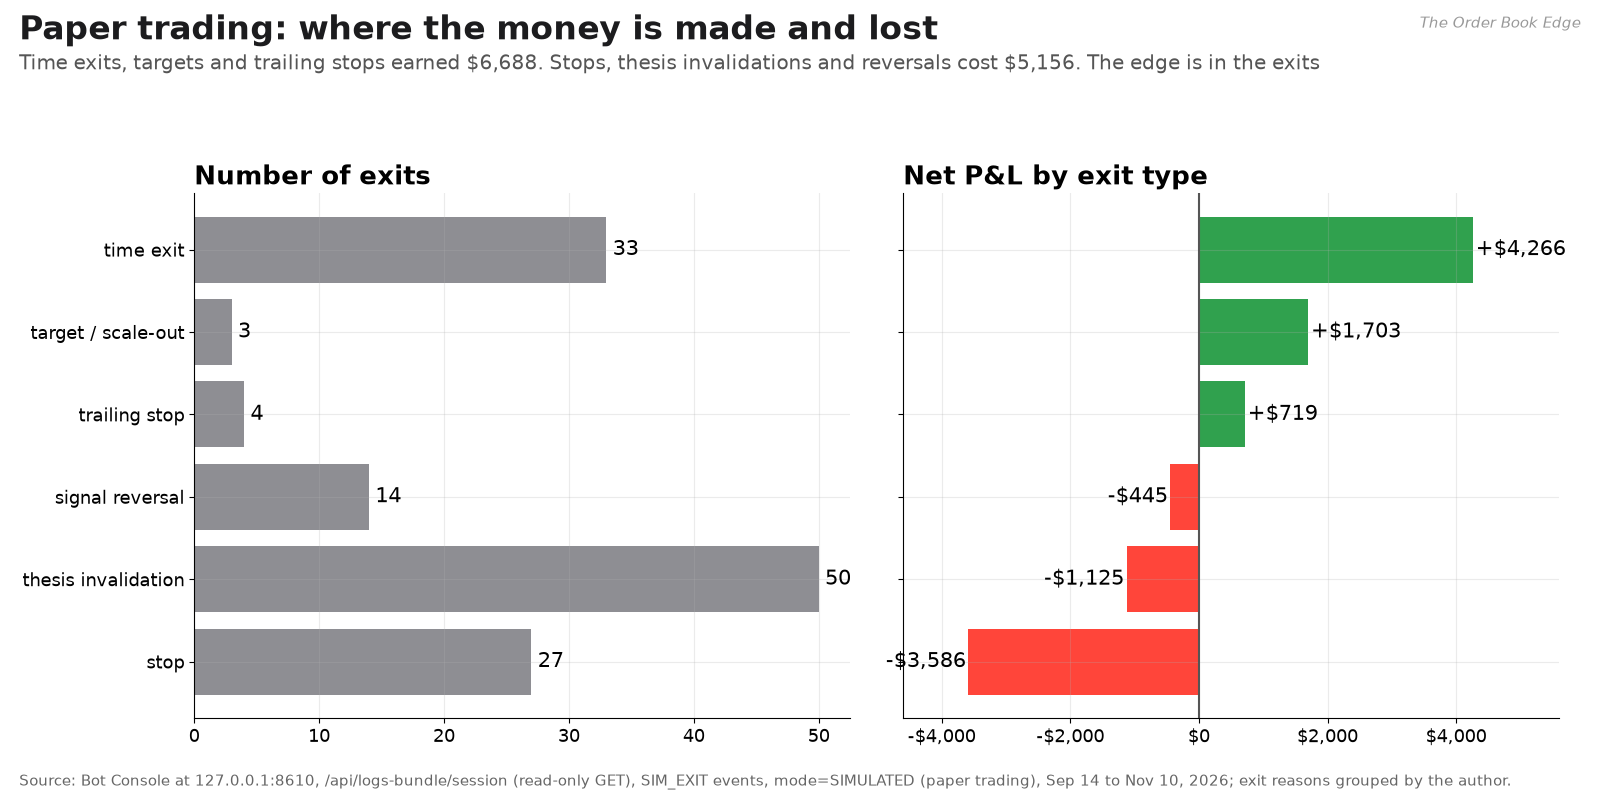
Grouping exits by type gives the clearest picture of how these bots work:
Time exits (closing a trade after a set holding period) were the biggest winner: 33 exits, +$4,266.
Targets and scale-outs added +$1,703 on three exits, and trailing stops +$719 on four.
Thesis-invalidation exits were the most frequent, at 50, and cost only $1,125. These close a trade when the market contradicts the reason it was opened, usually for a few ticks.
Hard stops cost $3,586 over 27 exits, and signal reversals $445 over 14.
This is what a well-designed exit layer does. It cuts many trades quickly and cheaply when the thesis fails, and it lets a minority run long enough to pay for the rest. In this sample the losing exits cost $5,156 and the winning exits earned $6,688.
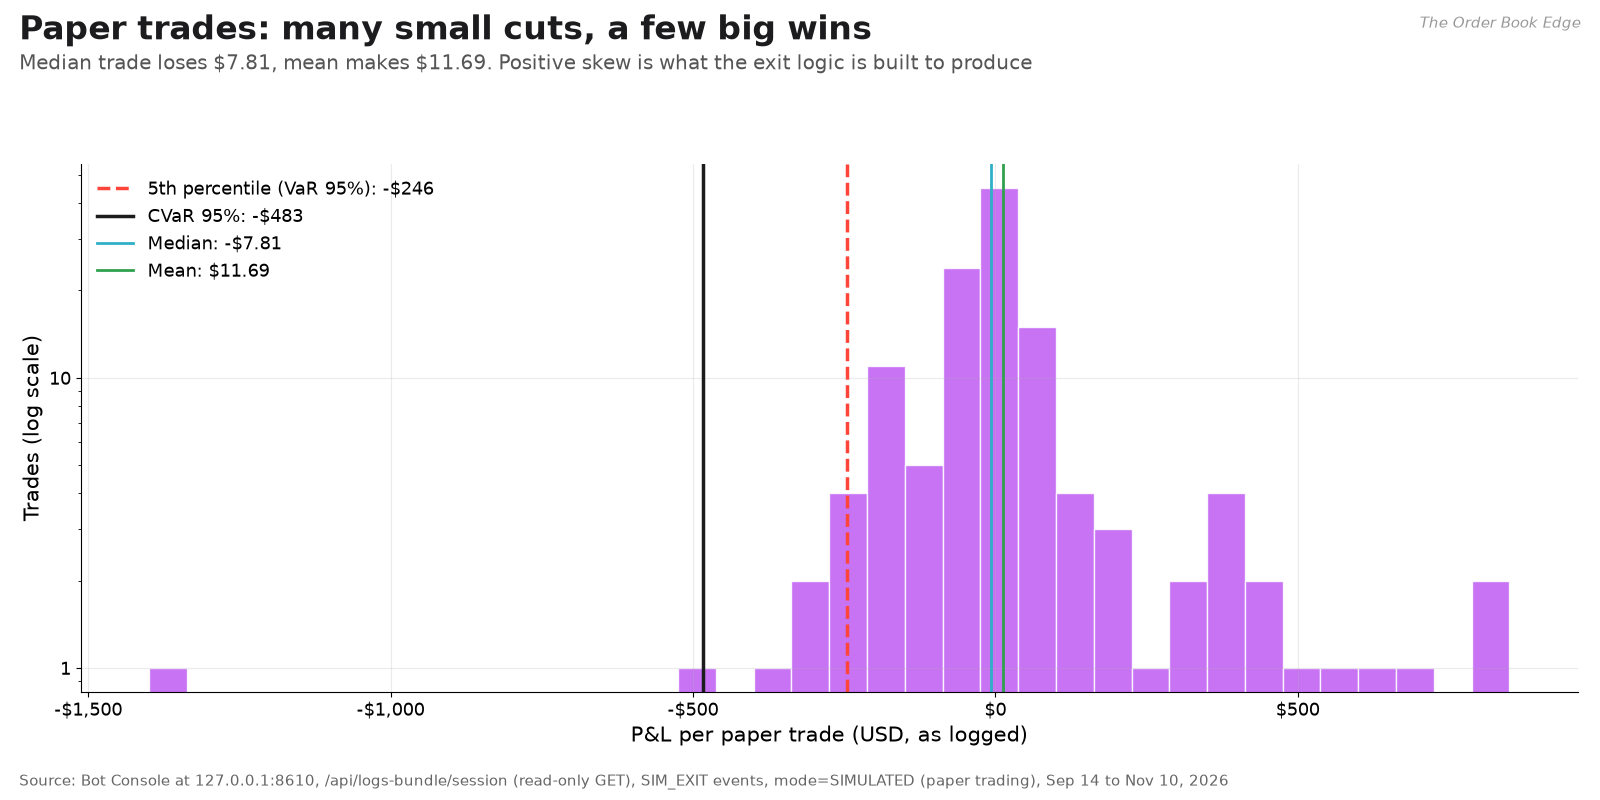
The trade distribution shows the same thing. The median paper trade loses $7.81. The mean makes $11.69. The difference comes from a right tail of winners between $300 and $800. Tail risk per trade, measured on these 131 trades, works out as follows:

Here X is the P&L of a trade, Q₁₋α is its (1−α) quantile, and α = 95%. The historical 95% VaR is $246 per trade and the CVaR is $483. That means the worst 5% of trades lose $483 on average. CVaR, also called expected shortfall, matters more than VaR because it measures how bad the tail is, not just where it starts.
Has the market changed? A drift check
The population stability index (PSI) is a standard way to test whether a distribution has shifted between two periods:
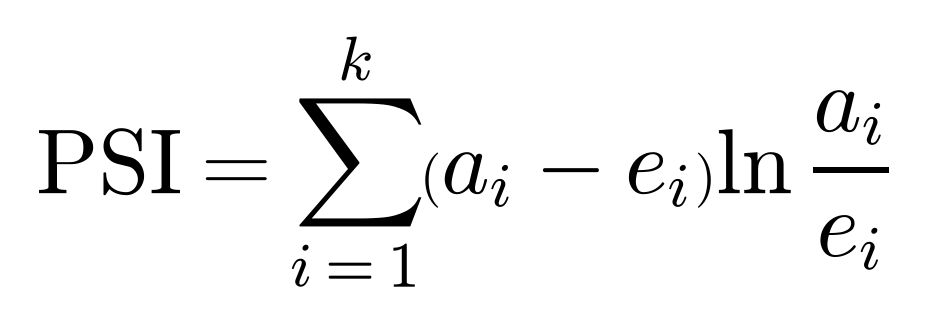
Here eᵢ is the share of observations in bin i during the reference period, aᵢ is the share in the recent period, and k is the number of bins. The usual rule of thumb is that below 0.10 the distribution is stable, 0.10 to 0.25 is worth watching, and above 0.25 it has shifted.
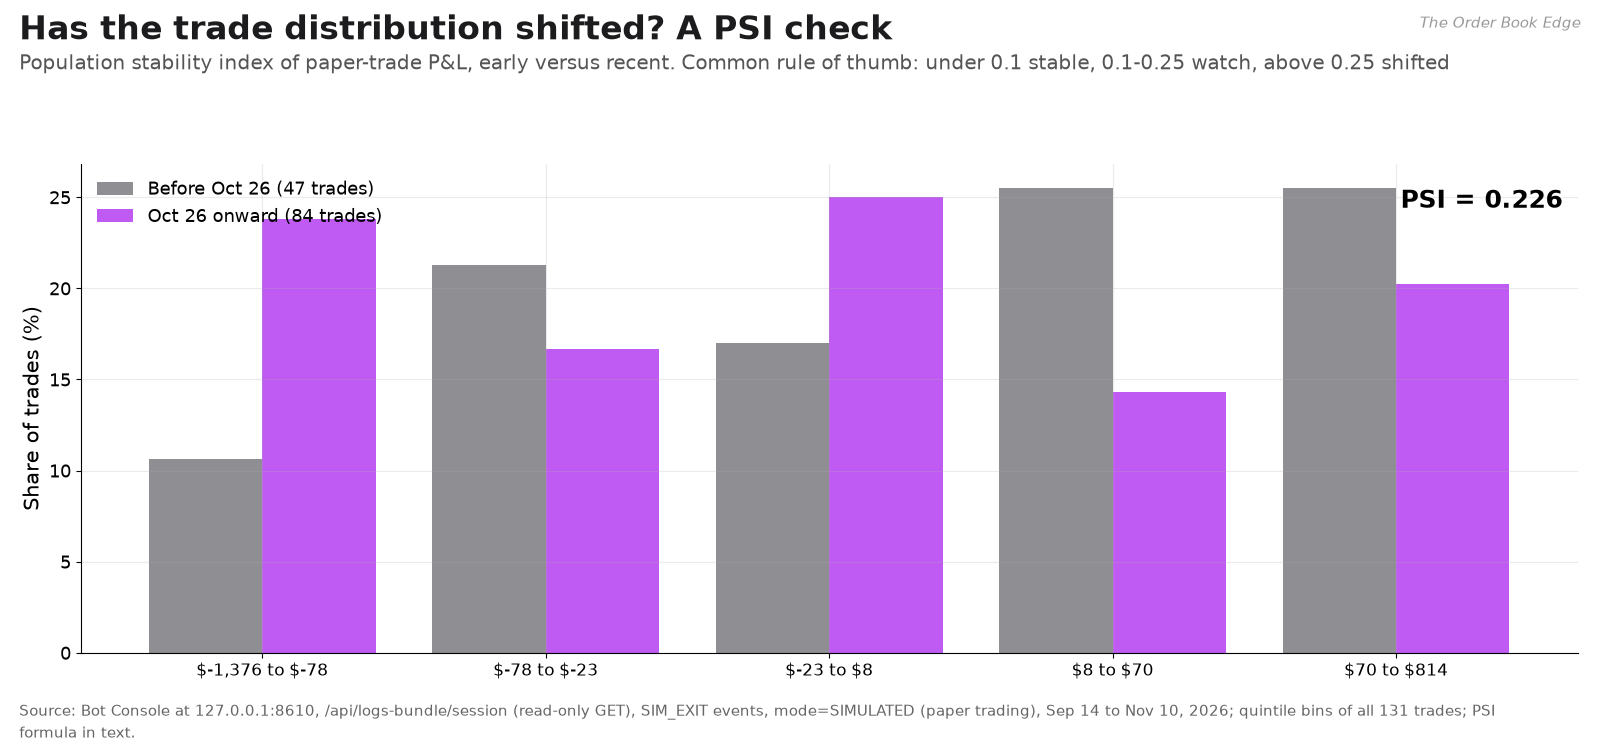
I split the paper trades at October 26 and binned all 131 by quintile of P&L. The PSI is 0.226, at the top of the “watch” band. Since October 26, the share of trades losing more than $78 has more than doubled, from 10.6% to 23.8%. The share of small winners, $8 to $70, has fallen from 25.5% to 14.3%, and the share of the largest winners from 25.5% to 20.2%. It is the same regime shift the S&P backtest bot labeled a collapse, seen at a milder level in the Treasury fleet.
The Russell 2000 bots today
The five Russell 2000 bar bots trade much less. They closed 27 simulated trades since mid-September for a net −54.85 index points, with a 37% win rate. The logs record these in index points per contract. Today they made five trades, three stopped out at a loss and two hitting soft or ratio targets, for a net −1.50 points. That is close to flat on a day that one of the reports describes as a broad selloff in equity futures. These bots are not winners, but on a bad day they did not compound the damage either.
The other adversary: the data feed
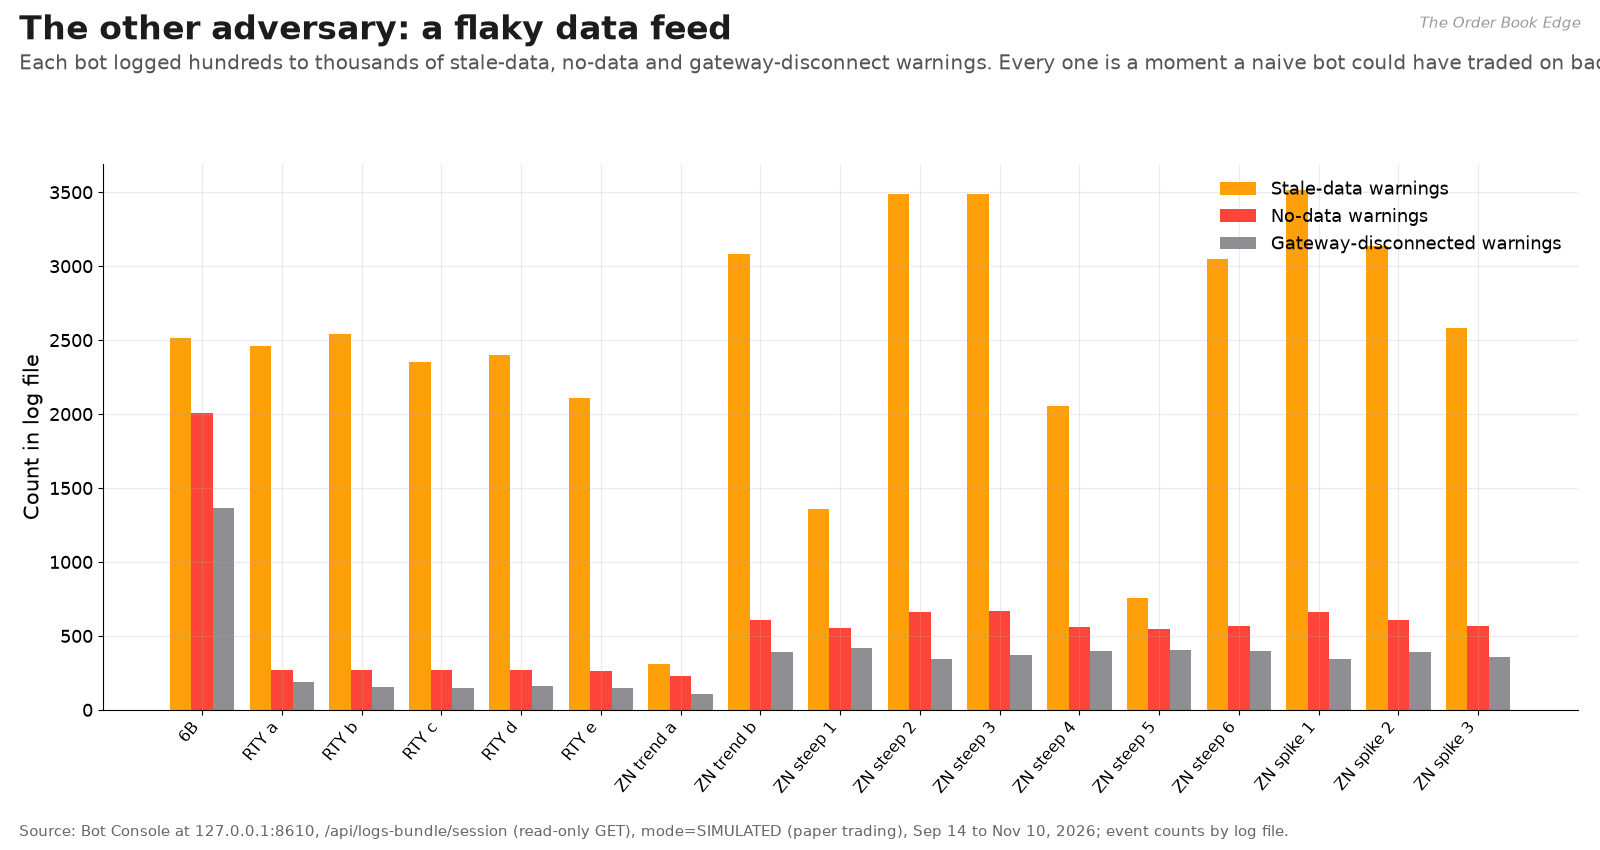
Markets were not the only problem. Every bot log contains hundreds to thousands of warnings about data quality:
Stale data: 311 to 3,513 warnings per log, where the latest price is older than the bot’s freshness limit.
No data: 227 to 2,009 warnings per log, where the subscription returned nothing.
Gateway disconnected: 107 to 1,362 warnings per log.
When I took the console snapshot this evening, the latest market data on the bots I checked was more than six minutes old, which is normal after the main session closes.
This is an underrated part of how the challenges were overcome. A bot that trades on a frozen price can place an order at a level that no longer exists, or miss a stop that should have triggered. My bots check data freshness before acting and refuse to trade when the data is stale, which is why those warnings exist. The warnings are noisy, but they are a safety mechanism at work.
Part 6: How the challenges were overcome, the risk playbook
“Overcome” is a strong word for a week in which most bots lost money. Here is what I mean by it. Five things went wrong in the market or the infrastructure this week:
A hot inflation print.
A sharp repricing of the Fed.
A 4% equity drop.
An oil reversal.
A data feed that went stale thousands of times.
None of these produced an account-ending loss, a runaway position or a trade on bad data. The worst single backtest loss in November was $1,730.49 (the S&P bot), and the worst single paper loss was $1,375. That outcome was designed, and the parts of the design are below.
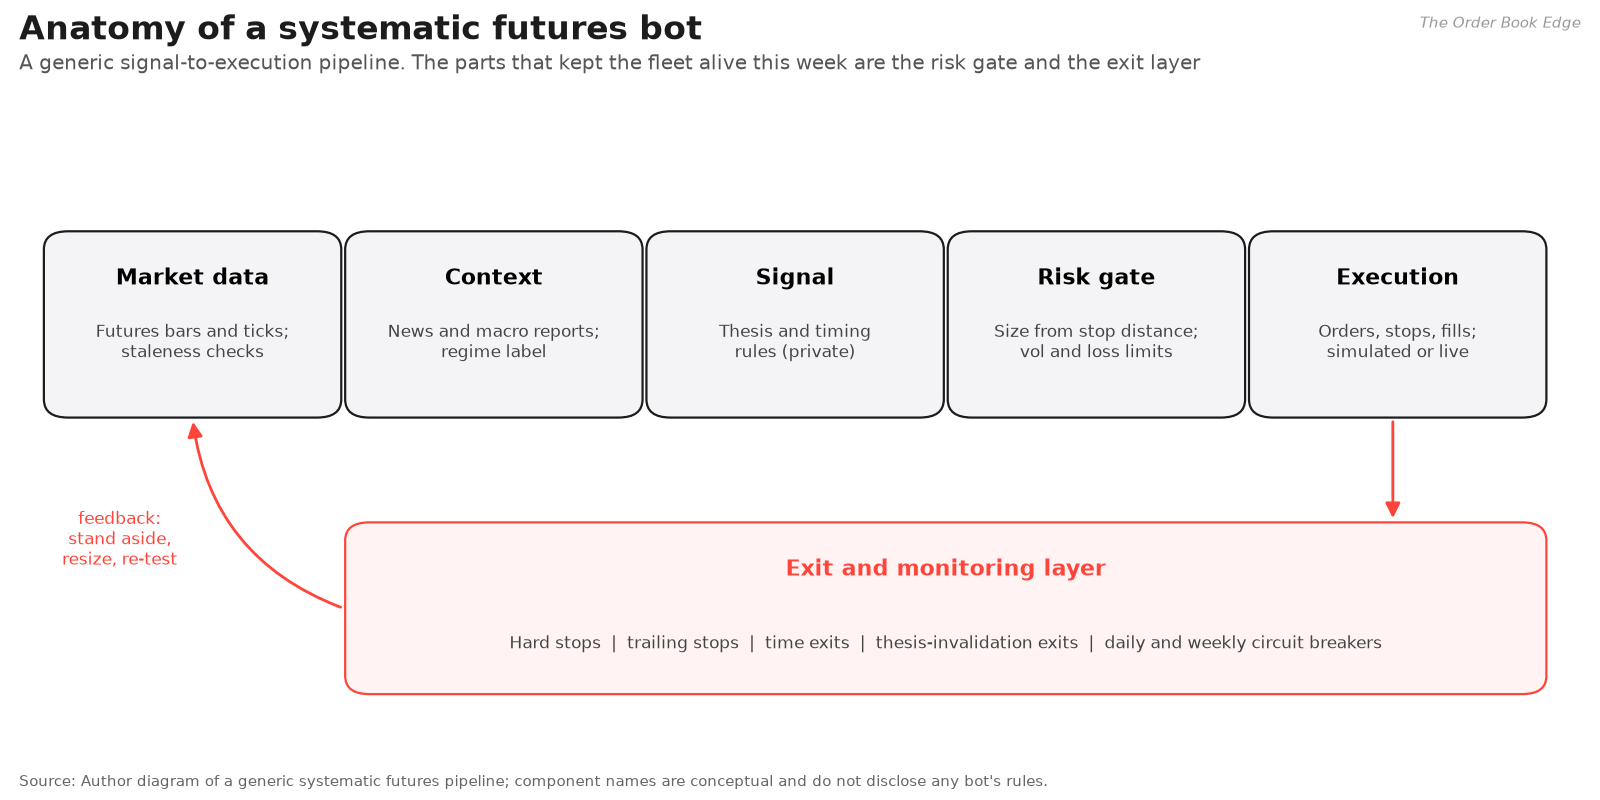
Every bot in the fleet follows the same generic pipeline. Market data comes in and is checked for staleness. A context layer reads the macro reports and labels the regime. The signal layer, the private part, decides whether its thesis is active. A risk gate sizes the trade and checks the portfolio’s limits. An execution layer places the orders, with hard stops attached. Around all of it, an exit and monitoring layer runs stops, trailing stops, time exits, thesis-invalidation exits and circuit breakers. It also feeds back into the start of the pipeline, telling a bot to stand aside, cut size or go back for retesting.
The signal layer gets most of the attention in trading, and it is the part I keep private. But this week, almost all the protection came from the layers around it.
1. Know the regime, and stand aside when it is wrong
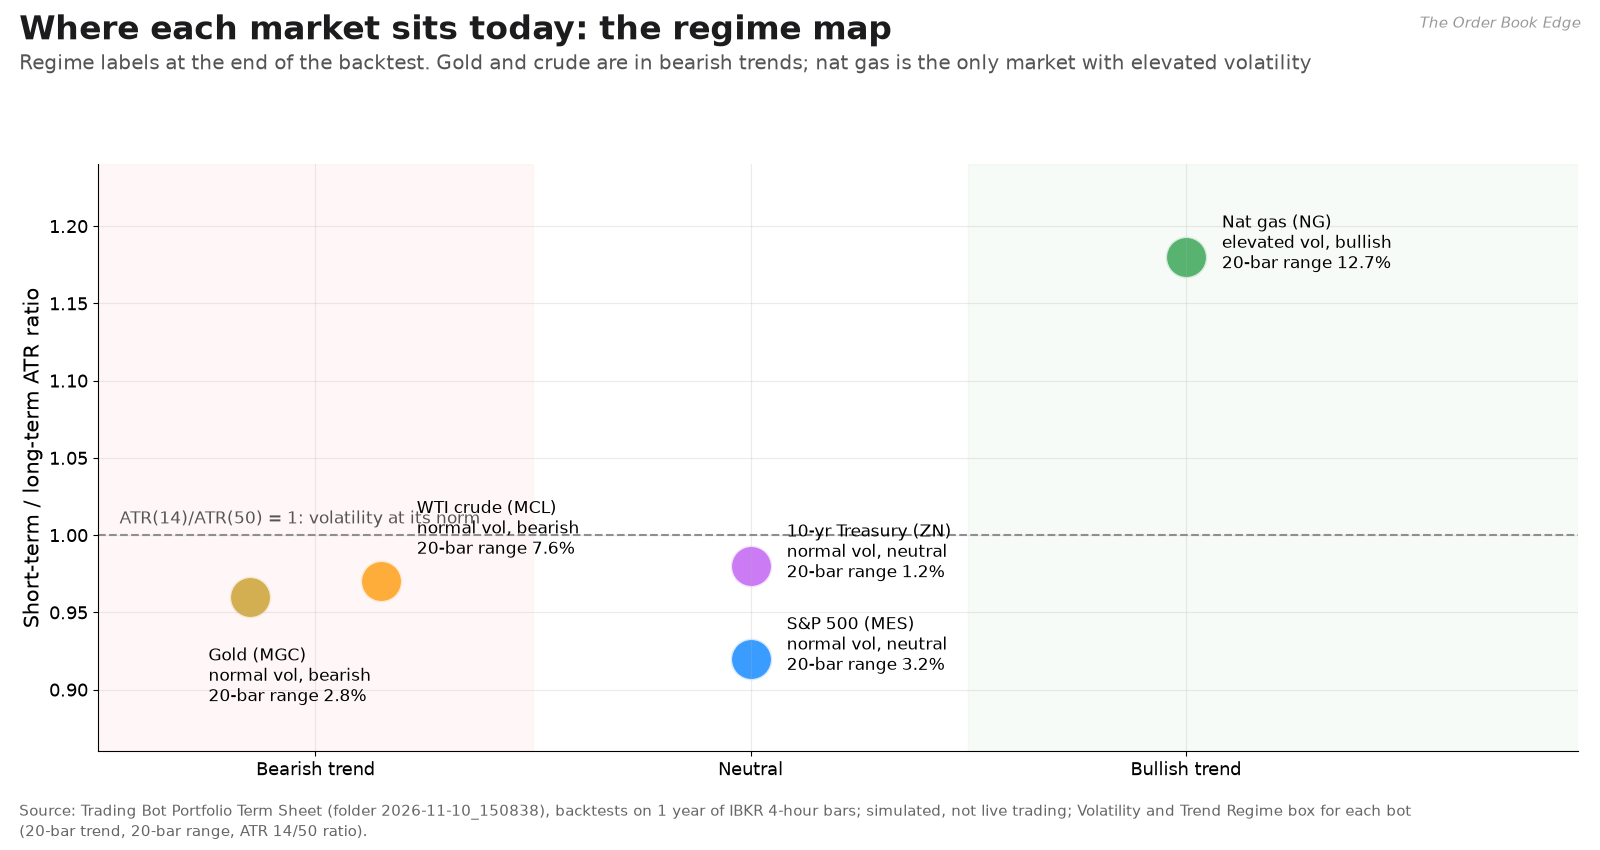
Each strategy carries a regime label built from two simple measures: the direction of the 20-bar trend and the ratio of short-term to long-term average true range (ATR):

Hₜ, Lₜ and Cₜ are the high, low and close of bar t. The ratio ATR₁₄/ATR₅₀ is above 1 when recent ranges are wider than usual. Today’s labels:
Gold: normal volatility, bearish trend (ratio 0.96).
Crude: normal volatility, bearish trend (0.97).
Treasuries: normal volatility, neutral (0.98).
S&P 500: normal volatility, neutral (0.92).
Natural gas: elevated volatility, bullish 20-bar trend (1.18), the only one of the five above 1.
The gold bot’s November is the purest example of this control at work. A long-only strategy in a bearish regime, whose conditions also need a weakening dollar, had no reason to trade, and it didn’t. The S&P bot is the counterexample. Its premise of a Fed pivot had failed, but it had no regime filter to tell it so, and it lost on all four of its November trades. Adding that filter is the first item on the term sheet’s repair list.
2. Size from the stop, not from the margin
The rulebook’s first idea, stated generally (it is standard practice), is that position size comes from the dollar risk you accept, divided by the dollar distance to the stop:
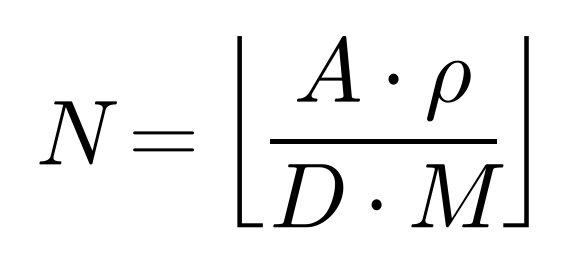
Here N is the number of contracts, A is the account size, ρ is the fraction of the account risked on the trade, D is the stop distance in price points, and M is the contract multiplier in dollars per point. The floor function rounds down, so you trade fewer contracts when in doubt.
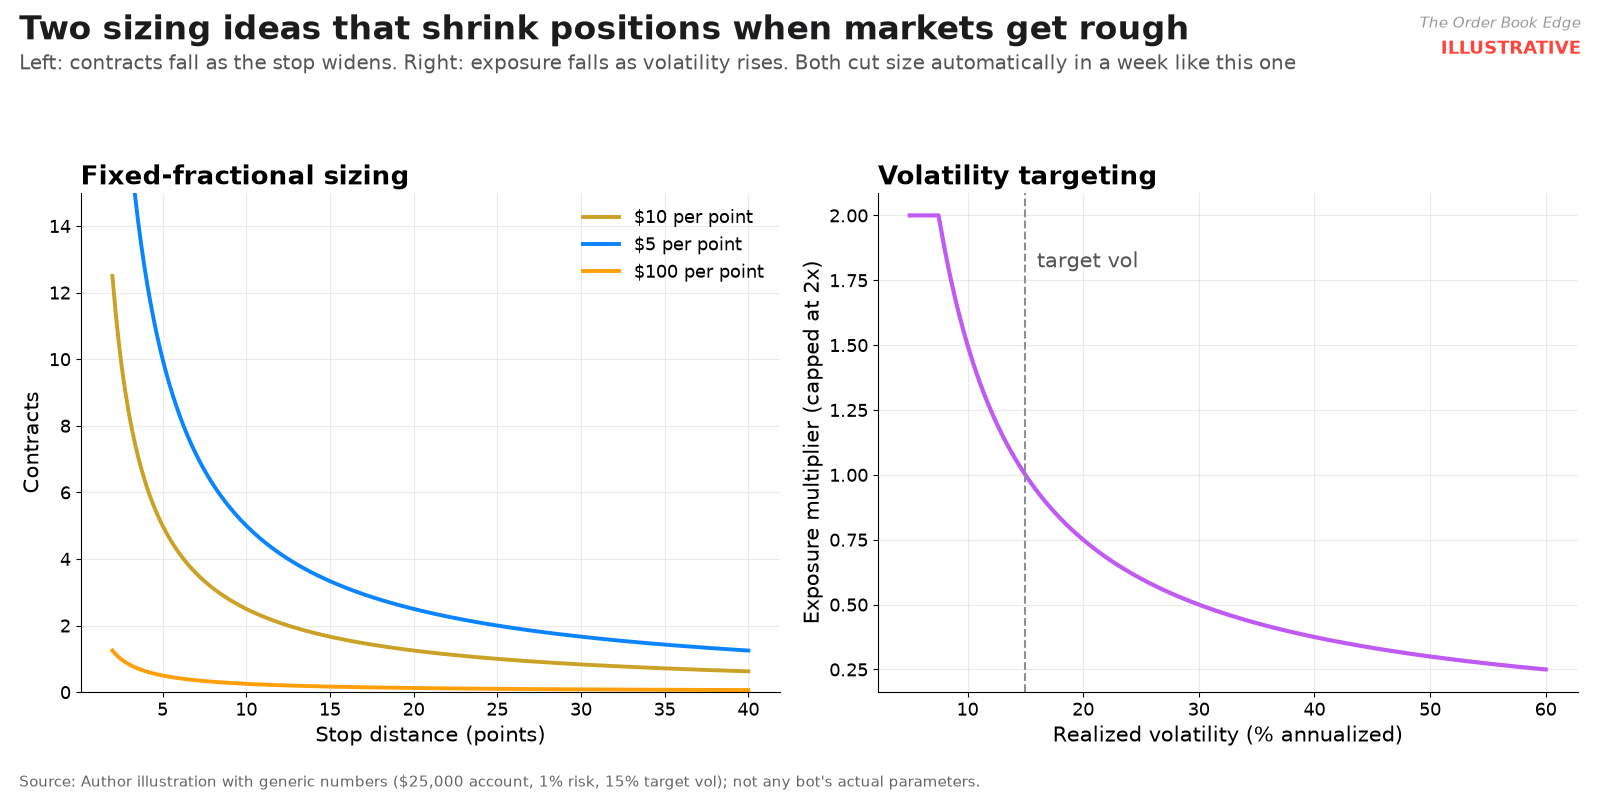
The left panel uses illustrative numbers, not any bot’s settings. It shows the effect: as volatility forces wider stops, the same dollar risk buys fewer contracts. In a week when ranges widened, that rule shrank positions automatically, before any human could react. It is also why the reports’ unreliable price levels did no harm. Sizing comes from the bot’s own stop distances, never from a number in a news summary.
3. Target volatility, not contracts
The right panel shows the portfolio-level version: scale exposure so that expected volatility stays near a target.

Here wₜ is the exposure multiplier, σ* is the target volatility, σ̂ₜ is a running estimate of current volatility, w_max is a leverage cap, rₜ₋₁ is the latest return, and λ (between 0 and 1) controls how quickly the estimate reacts. When realized volatility doubles, exposure halves. The rulebook expresses the same idea more simply, with a schedule that cuts size as implied volatility rises. I won’t give its specific bands.
4. Bet a fraction of Kelly, never more
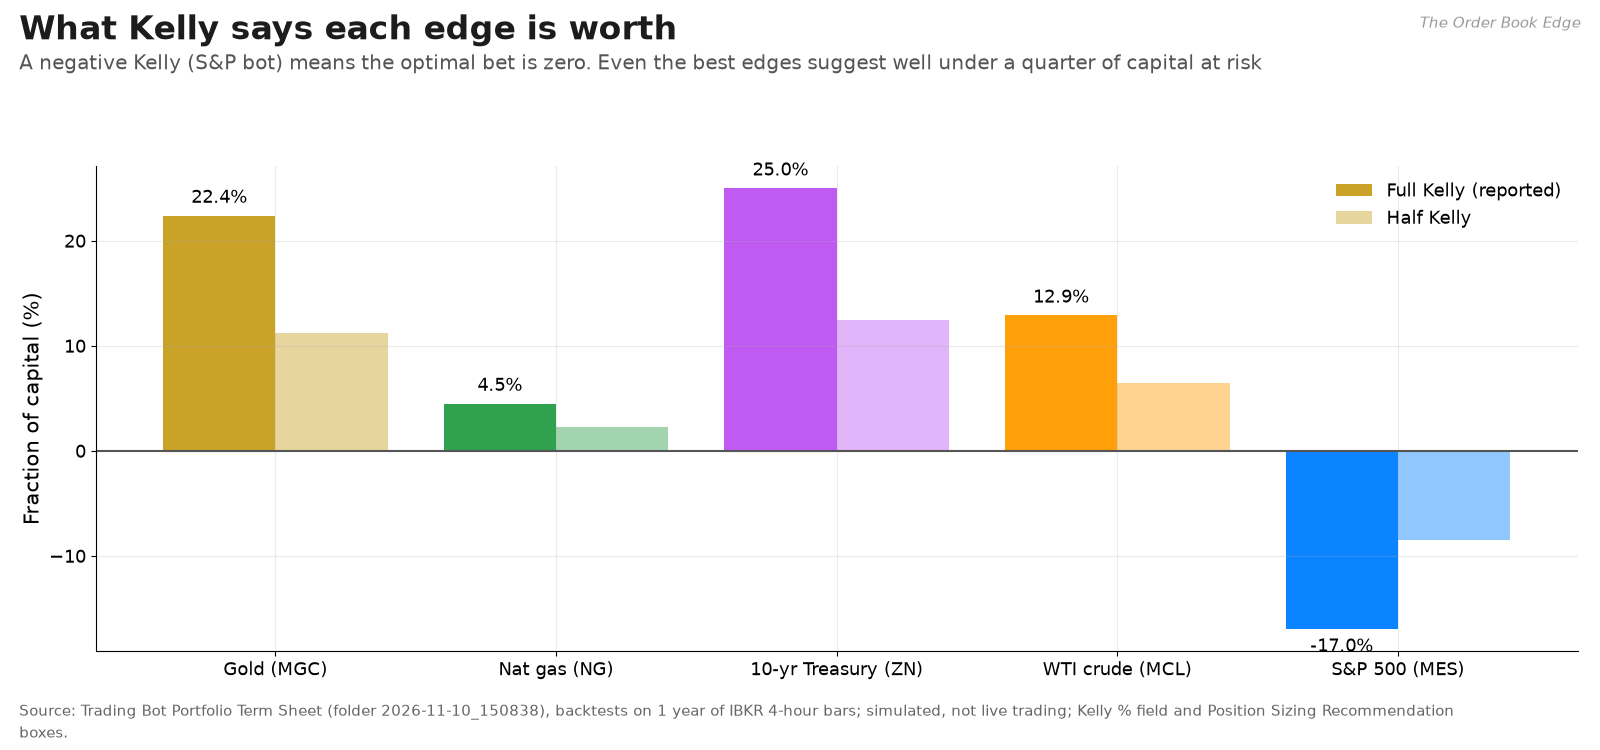
The Kelly criterion gives the fraction of capital that maximizes long-run growth for a bet with win probability p and payoff ratio b:

Here f is the fraction risked per trade and g(f) is the expected logarithmic growth per trade. The term sheet’s reported Kelly fractions follow directly from each bot’s win rate and payoff ratio, and I checked each one:
Treasuries: 25.0%.
Gold: 22.4%.
Crude: 12.9%.
Natural gas: 4.5%.
S&P 500: −17%, which means do not bet.
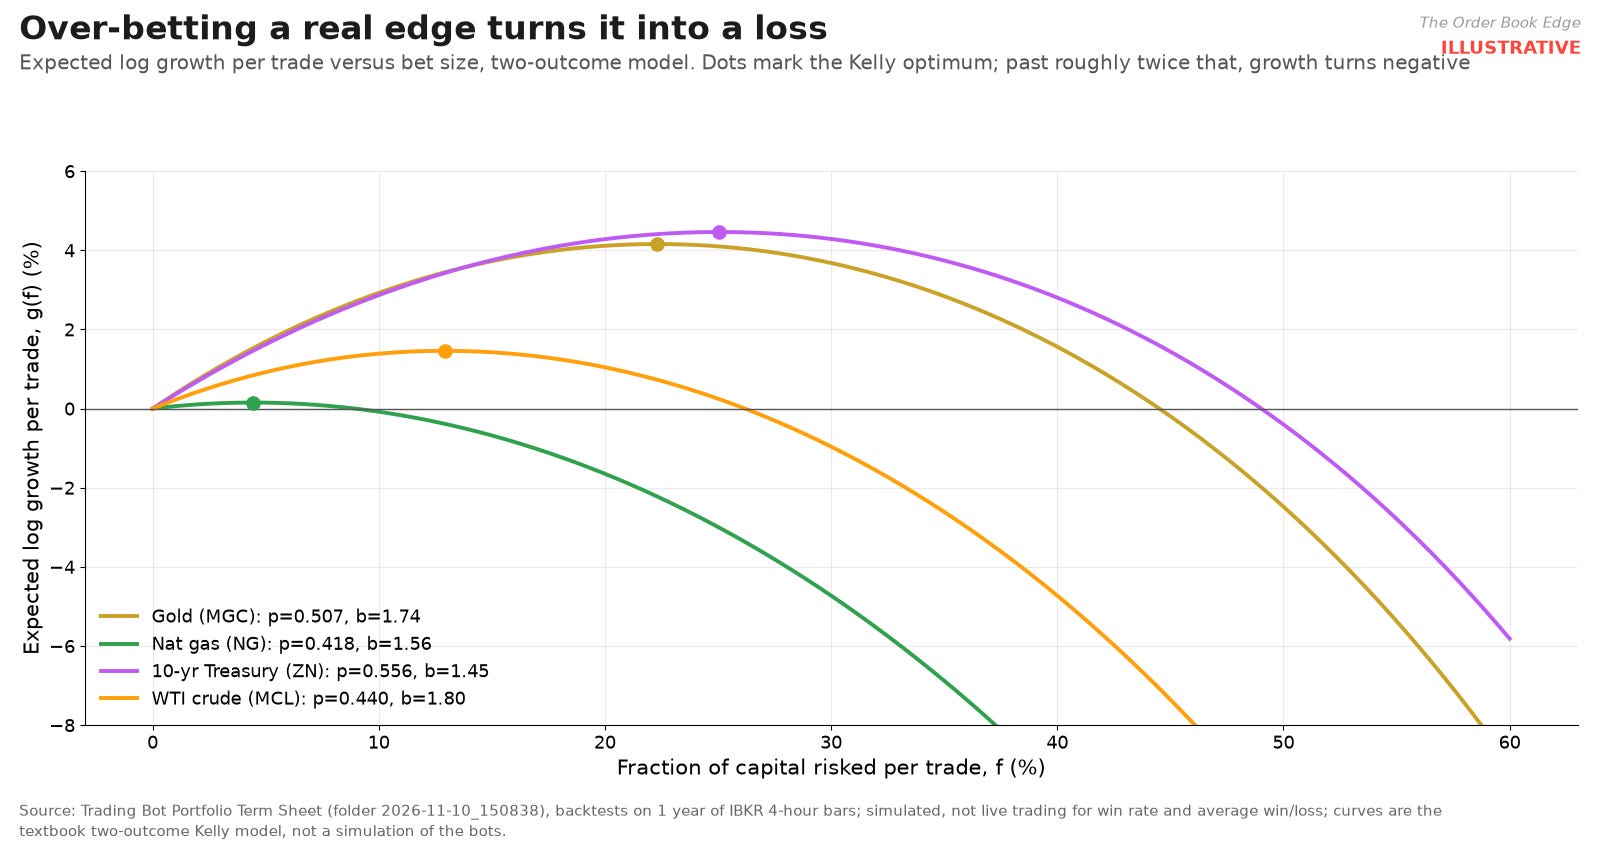
The growth curves make the danger concrete. They assume a simple two-outcome model, so they are illustrative, but they use each bot’s actual reported win rate and payoff. Growth peaks at f* and falls to zero at about twice f. Beyond that point, betting more makes a strategy with a positive edge lose money. And f itself is uncertain, because p and b are estimated from small samples. The 95% interval on Treasuries’ win rate runs from about 41% to 70%. Practitioners therefore use half-Kelly or less, and the term sheet’s sizing notes recommend “minimal” sizing for four of the five strategies. The fixed-fractional rule in point 2 caps risk per trade well below even half-Kelly, which is why no single November loss mattered much.
5. Plan for losing streaks before they happen
Every strategy with a win rate below 60% will have long losing streaks, and a bot that is not sized for them will be abandoned at the worst moment. A useful approximation for the expected longest run of losses in n independent trades with loss probability q = 1 − p is:
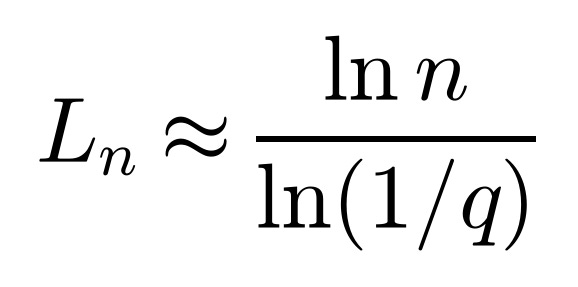
Here’s how the formula compares with each bot’s actual longest losing run:
Gold: the formula predicts about 6 for 67 trades at q = 0.493, and the actual longest run was 6.
Treasuries: about 4.7 predicted (45 trades, q = 0.444), against an actual 5.
Natural gas: about 8.7 predicted (110 trades, q = 0.582), against an actual 6.
S&P 500: about 12.9 predicted (65 trades, q = 0.723), against an actual 10.
The formula is close enough to plan with, and where it misses, it errs on the cautious side. The practical rule follows: before a bot goes live, its loss limits and capital have to survive a run of L_n losses at full size, with room to spare.
6. Circuit breakers: the control that worked hardest this week
On the paper fleet, the most important event of the week was not a trade. It was a pause. On November 5, the steepener variant #10 closed a trade for −$1,375, the largest paper loss in the sample. Its loss limit triggered, and the bot’s own log shows five circuit-breaker events between November 5 and November 9, each setting a cooldown, the last of them running into November 10. It sat out November 6, the day the equity market fell 4.36% and another bot in the fleet lost $703 on three stop-outs. Across the logs I count 25 circuit-breaker entries on three bots.
In general terms, the rulebook calls for daily, weekly and monthly loss limits, a cap on consecutive losses, and a rule that a halted bot stays out until at least the next session. I won’t give the levels. The point is that losses in a bad regime come in clusters. A circuit breaker turns a cluster into a single bad day.
7. Let the exits do the work
The exit statistics from Part 5 are the most direct evidence of how the fleet earned its small profit in a hostile market. Fifty thesis-invalidation exits cost an average of only $22.50 each. Thirty-three time exits earned an average of $129 each. Asymmetric exits, cutting quickly and letting winners run for a set time, turned a 40.5% win rate into a profit factor of 1.19. The Treasury backtest bot’s November 10 trade did the same thing on a larger scale. After stop-outs of about $1,250 each on November 2 and November 5, a short opened on November 5 was closed at midday on November 10, after the CPI selloff, on a mean-reversion exit for +$1,312.50.
8. Distrust inputs: data freshness and narrative hygiene
Two inputs tried to mislead the bots this week. One was the data feed, which went stale or disconnected thousands of times. The other was the AI-written research, which quoted contradictory levels. The defense is the same in both cases. Every decision that involves a price uses the bot’s own fresh data, or no decision is made. Narrative can decide which way a bot leans, never where it trades. Of everything in this playbook, this is the hardest to see from outside and the easiest to get wrong.
Part 7: What isn’t solved
An honest report card needs this section.
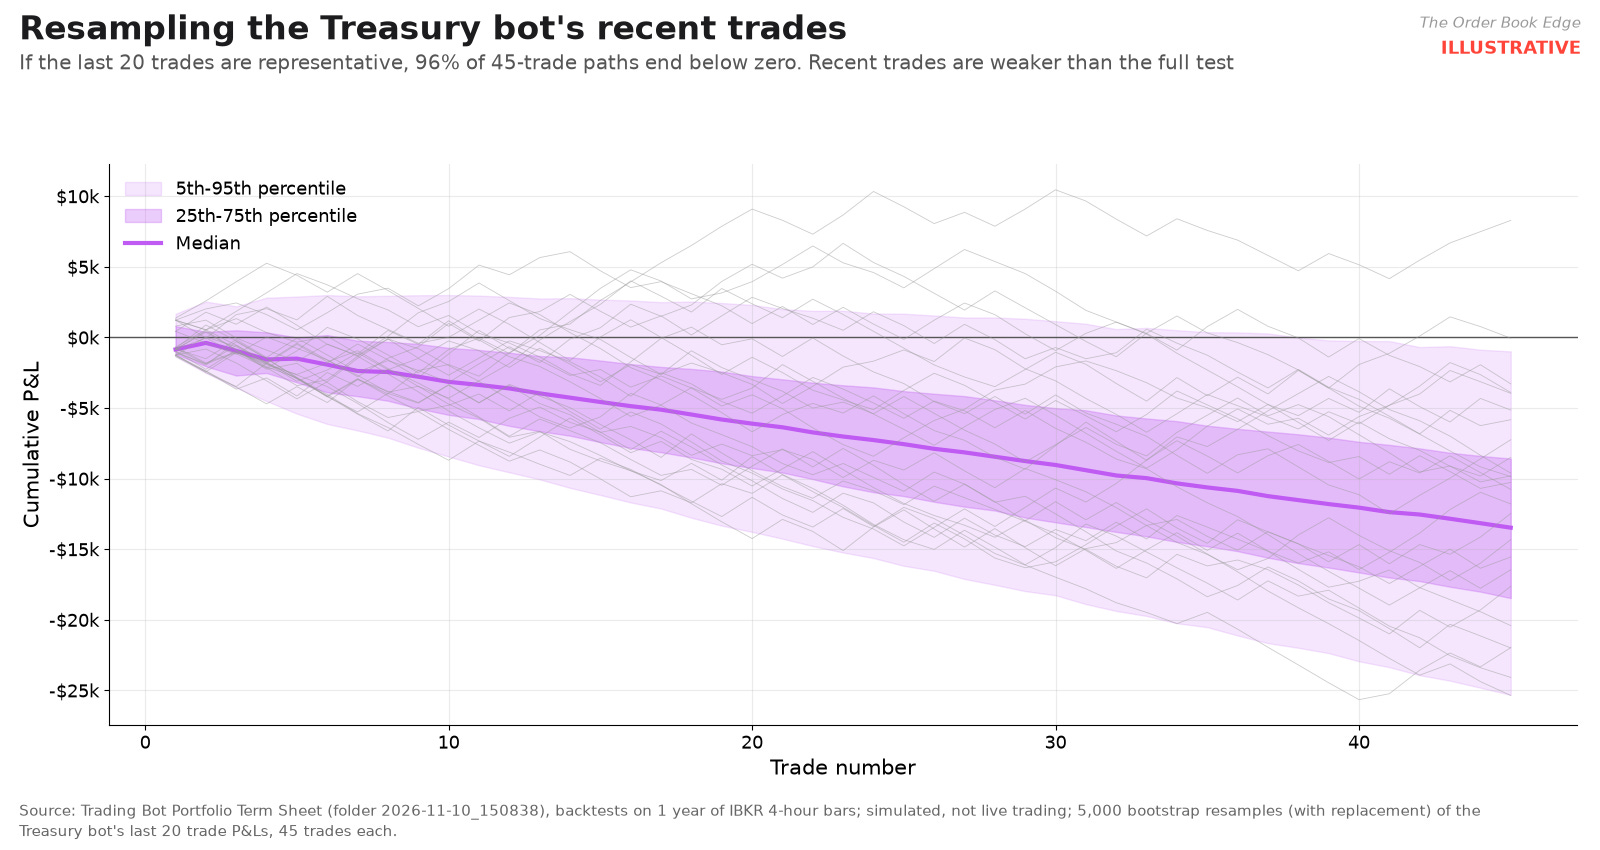
Recent performance is weaker than the full test. I resampled the Treasury bot’s last 20 backtest trades 5,000 times, building 45-trade paths of the same length as its full backtest. Of those paths, 96% end below zero. The full sample is profitable, but the recent sample is not. A bootstrap only says what happens if the recent trades are representative, and they may not be, since September was an unusually bad month for longs. Even so, I would not size this bot up on the strength of its headline Sharpe of 1.87.
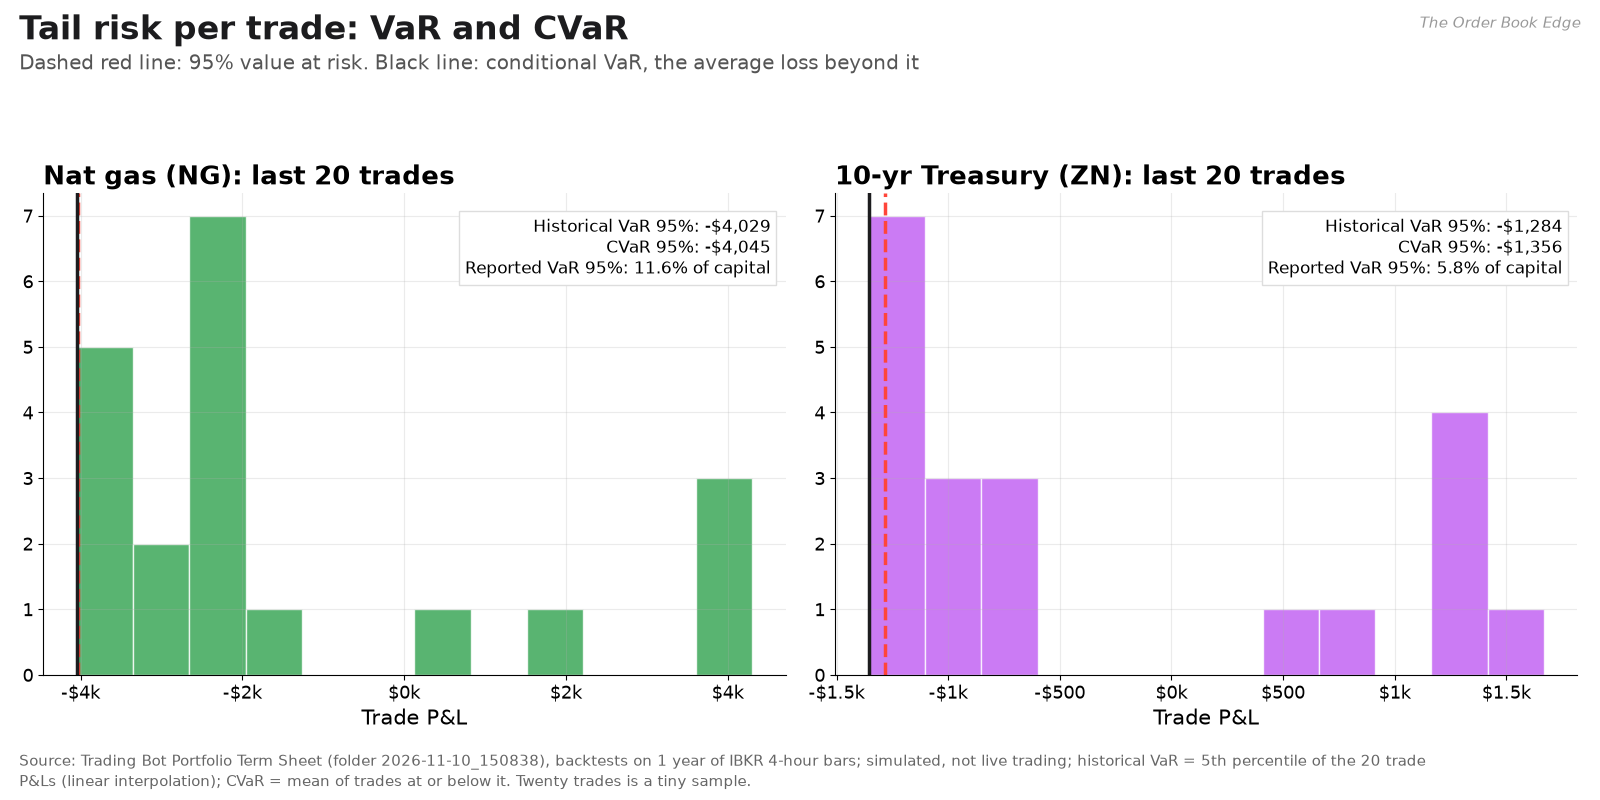
Tail risk per trade is large relative to capital for natural gas. On the last 20 trades, natural gas’s historical 95% VaR is about $4,029 and its CVaR $4,045. Its trades are big compared with its $35,000 allocation, which is how it reached a 121% drawdown. The Treasury bot’s tail is narrower, with a VaR of about $1,284, but it is far from negligible on $22,000.
The AI planner is too optimistic and too uniform. Every strategy got a forecast Sharpe of 1.5 to 1.9 and annual returns of 25% to 40%. The real results spread from −52% to +110%. The planner should be scored against the backtest results and recalibrated, or its forecasts dropped.
The research feed contradicts itself. As shown in Part 1, five analyses of the same day disagree on VIX by 17 points, on DXY by 8 points, and on gold by almost $2,000. The fix is mechanical: check every quoted level against the bots’ own data feed, and drop any that are off by more than a set tolerance before the narrative reaches the context layer.
The options overlay produced nothing today. Both the integration-signal and options-chain reports came back with zero actionable signals. The options download returned 20 clean quotes on one S&P options series, 92 contracts of total open interest, no live Greeks and a futures mid price of 0.00. None of the four profitable bots got an options chain for its own contract. Until that step works, the options sections of these reports are templates, not analysis.
Contract and cost assumptions need cleanup. The three reports disagree on margin. The Trading Analysis report uses $8,000 per contract for every bot. The Portfolio Summary uses $1,100 to $1,500. The term sheet’s sizing boxes use $600 to $3,000. The term sheet’s contract tables also show placeholder values, such as a last close of “$1e+05” for gold and a notional leverage of 1,000x, and these are clearly calculation bugs. They do not change the backtest P&L, but they would change position sizing if anyone relied on them.
Samples are small. Treasuries have 45 backtest trades over seven months, and the best paper bot has 31 trades. The paper fleet’s t-statistic is 0.57. This much data can rank ideas, but it cannot prove any of them.
Nothing here is live. The Trading Analysis report confirms zero live trades for all five strategies. Every number in this article is simulated, either a backtest or paper trading.
What I am watching next
The reports’ catalyst calendar is dense, and each date tests a different bot:
November 12, October PPI. Another hot print would support the Treasury short thesis and keep the dollar firm, which is bad for the long-only commodity bots.
November 19, FOMC minutes. Any sign that the committee is united on a December hike is the regime the S&P “Fed pivot” bot cannot trade. It stays under review.
December 8-9, FOMC meeting. The reports price a hike as likely. A surprise in either direction would test every circuit breaker in the fleet.
Natural gas into winter. It is the only market in the elevated-volatility regime, and its bot is the only one whose 20-bar trend label says bullish. Its thin edge and huge drawdown history make it the bot I trust least to size up.
Drift. I will rerun the paper-trade PSI weekly. If it moves above 0.25, the Treasury paper bots go back for retesting before they place any more paper trades.
Methodology and sources
Backtests. All backtest figures come from the Trading Bot Portfolio Term Sheet (folder 2026-11-10_150838, generated November 10, 2026 at 3:29 p.m. ET), which tests on Interactive Brokers four-hour historical bars. I placed each month’s P&L by checking the monthly return tables against each bot’s last-20 trade list, which I matched by exit date. Monthly placement for months before 2026 is less certain, so the 2026 charts use only verified months. Costs come from the Trading Analysis report (3:30 p.m. ET), and capital plans from the Trading Bot Portfolio Summary (3:49 p.m. ET).
Market narrative. This comes from the Futures Trading Strategy Report (generated 3:08 p.m. ET), a bundle of five AI-written analyses of the day’s news. Where its levels conflict with each other or with the bots’ data, I say so.
Paper trading. These figures come from read-only requests to my local bot console’s fleet and log endpoints, taken on the evening of November 10, 2026:
Per-trade P&L is summed from each bot’s logged exit events.
The bots’ own running totals reset when a bot restarts, so I did not use them.
Treasury P&L is in the dollar units the bots log. Russell 2000 bar-bot P&L is in index points.
My calculations. Bootstraps, PSI, t-statistics, Kelly growth curves and losing-streak estimates are mine, and each chart says so. Charts that use illustrative or hypothetical numbers are stamped ILLUSTRATIVE.
Strategy descriptions. These are deliberately conceptual. The rules, parameters, thresholds and code are proprietary and are not disclosed here.
This article is for education and research only. It is not investment advice and not a recommendation to buy or sell any security, futures contract or option. Every performance figure is simulated or hypothetical. Hypothetical results are prepared with hindsight, do not reflect actual slippage, commissions or market impact, and cannot account for the risk of actual trading. Futures and options involve substantial risk of loss, and you can lose more than your initial investment. Past performance, simulated or actual, does not indicate future results. Consult a qualified professional before making any trading decision.
If you want the next fleet report when it comes out, a free subscription is the easiest way to get it.