


Educational analysis only. This is not financial advice, a recommendation or an offer to trade anything. Every price, probability and payoff below is either sourced to a named outlet or document, computed by me from public Yahoo Finance data, or labelled illustrative. The bot results quoted are simulated and come from the documents, not from live trading. Stocks, futures and options can lose money, and futures and options can lose more than you put in.
Wednesday, November 18, 2026: a Fed governor says “shock”, and eight bots are all leaning on the same story
At 4:30 p.m. on Wednesday an automated pipeline wrote an 83-page strategy report. Thirty-seven minutes after that it produced six more documents: a portfolio term sheet, a trading analysis, a portfolio workbook, a rules reference, a signals summary and an options-chain summary. Together they describe nine trading bots, each built on one sentence of macro storytelling, and eight of those bots arrived as Python files. This article is a full audit of all of it: what the documents claim, what the code does in concept, what the markets actually did, and what the numbers say about whether any of it can be trusted.
The date matters. On Wednesday, Federal Reserve Governor Christopher Waller said the central bank may need to “shock people” with a half-point rate hike at the December 8 to 9 meeting, according to CNBC. The 10-year Treasury yield sat near 5.07%, the 2-year near 4.8%, and the dollar index near a 19-month high. Spot gold fell about 3% to its lowest level since September 2025, according to Investing.com and Kitco. The euro slipped under 1.10, a low not seen since April 2025. Bitcoin dropped toward $62,500 intraday. WTI crude settled at $83.26 after the EIA reported a 3.4 million barrel build in US crude stocks, and December natural gas jumped 5.1% to $3.372 on colder forecasts, according to CNBC and other market reports.
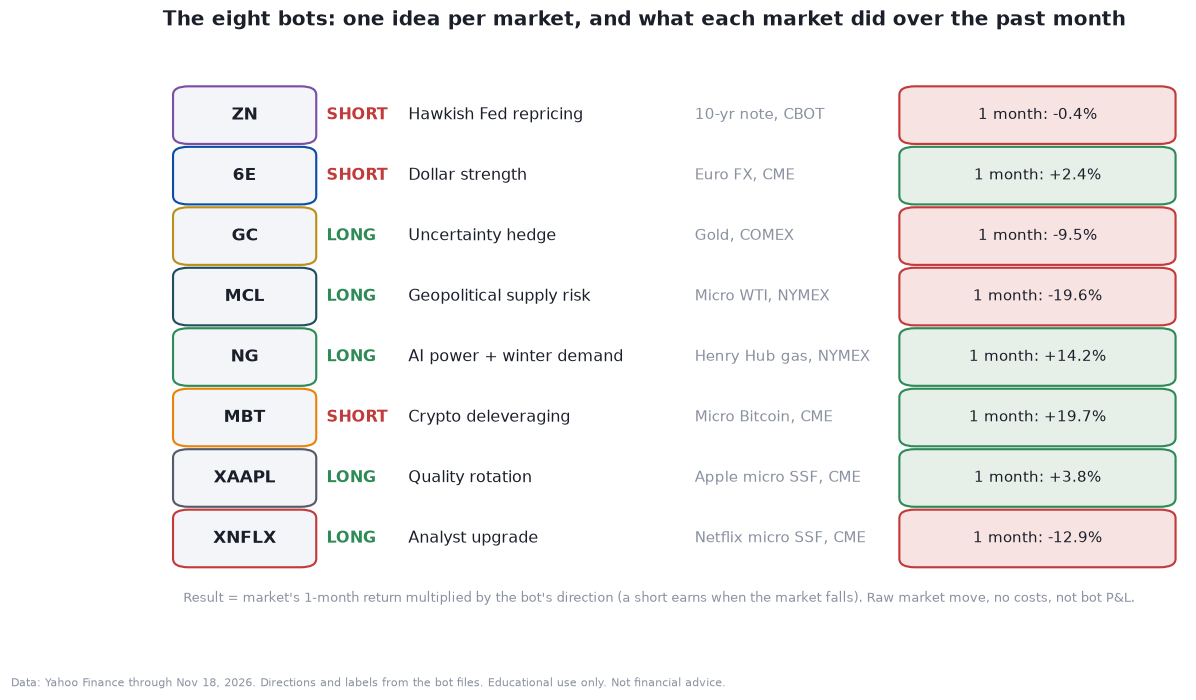
That is one hawkish catalyst feeding a very uneven tape, and the eight bots were written to trade it from eight angles: short Treasuries, short the euro, long gold, long crude, long natural gas, short Bitcoin, long Apple and long Netflix. Four of those eight ideas are being paid by the market right now. Four are not. Which four, and why, is the core of the first half of this piece.
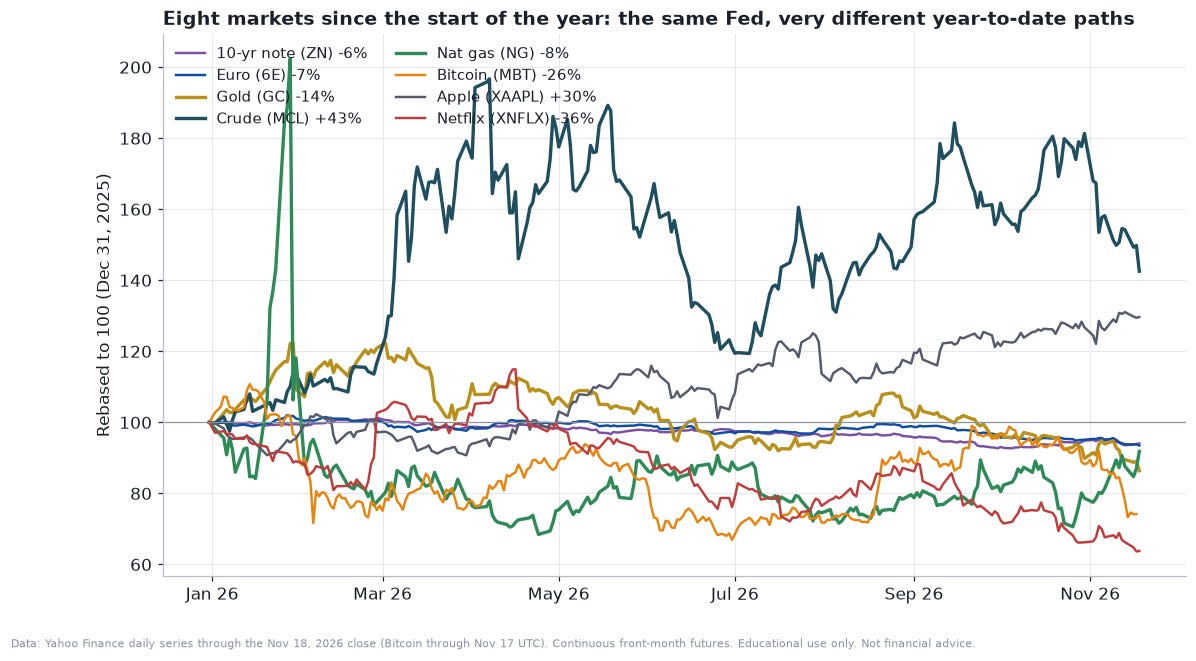
Here is the short version of what I found, before the detail.
First, the documents are mostly empty of evidence. The portfolio term sheet reports nine bots, but only two of them, the 10-year note short and the micro crude long, show any backtest trades. The other seven are stamped “NO_TRADES”, and the page diagnoses that as “entry conditions were never triggered”. The data-connection lines on those very pages say the real reason: the market-data feed returned permission errors, so there was no data to trade on. A data outage was recorded as a strategy verdict. A separate analysis report from the same run says zero of nine bots received any ticks at all, and lists a combined result of $0.00, while the term sheet lists $4,764.40. Both cannot describe the same run.
Second, the two backtests that exist are real enough to examine and too small to trust. Sixteen trades for the note short and thirty-eight for crude. When I resample the trade lists, the 95% interval for the average trade comfortably includes zero in both cases. The documents print “probability of profit” figures of 85% and 83% that sit in the same neighbourhood as my resampled estimates for the average trade being positive, which is a coincidence worth explaining rather than celebrating.
Third, the “macro thesis” in every bot is a label. In concept, each bot is a generic trend-and-momentum machine with a fixed trade direction. Nothing in the code reads the Fed, oil inventories, gas storage, ETF flows, or analyst ratings. The story attached to each bot is the reason a human picked the direction, not an input the bot checks. That is not a criticism of the direction; it is a statement about what the system can and cannot know.
Fourth, there are mechanical problems that matter more than any signal. Six of the eight files carry futures contract-month labels that have already expired. Two of the eight, the Apple and Netflix bots, are structurally broken as shipped. Nothing handles contract rolls, first-notice dates, central-bank meetings, inventory reports or earnings. Paper fills happen at the midpoint of a bar with no spread, no slippage and no fees. And the options-chain document was pulled for an expired index-futures contract with a price of 0.00.
Fifth, the portfolio is not diversified the way eight markets suggests. Held at equal dollar notional, one market, natural gas, would carry about 45% of the variance, and crude another 28%. The four winners share one macro driver, the rate shock, and the scenario analysis shows how quickly that flips if the Fed relents.
I will take these in order. The first half covers the documents, a conceptual view of the bots, and the thesis-versus-tape scorecard. The second half is market by market, then portfolio risk, then the backtest forensics, then the data-quality list and a calendar of what can break the book before year-end.
The attachment pile: seven PDFs, eight Python files, no duplicates
The seven PDFs are not copies of each other. I checked the text of each. They are seven different views of one run, folder-stamped 2026-11-18_163030.
The big one is the 83-page strategy report. It begins with the model’s visible scratchpad, a “Thinking...” block in which an AI reads a news feed and maps each headline to a futures trade. That scratchpad survived into the finished report. It is useful, because it shows the origin of every bot: a headline list that includes the Fed’s possible larger December hike, Bitcoin below $63,000, a Houthi missile attack on Riyadh’s King Khalid Airport, a $16 billion fall in stablecoin supply, and an AI capital-spending boom. The report maps those to trades in rates, currencies, metals, energy and crypto, with the instruction that it should cover institutional futures only and no single stocks. The single-stock-futures bots for Apple and Netflix exist anyway, and the report’s own section on them runs to a list of 55 stocks. I come back to that tension later.
The 43-page portfolio term sheet is the document with the numbers: nine bot sections, a contract specification table for each, an AI “plan estimate” of return, Sharpe and win rate, an “actual result” next to it, a risk scorecard, and, for the two bots that traded, a trade list. The 23-page trading analysis is the odd one out. It reports nine bots, zero with trades, zero ticks, a data success rate of 0%, and $0.00 combined P&L, and it lists 413 rules as “enforced”. The 8-page portfolio workbook gives allocation and cost estimates. The 13-page rules reference excerpts a rule engine’s risk protocols for the two profitable bots. The 3-page signals document reports zero signals found and a news multiplier of exactly 1.0000x. The 5-page options document is the one pulled for the wrong contract: ESM26, a June 2026 S&P 500 futures option, with a futures price of 0.00, labelled with a December 18 expiry.
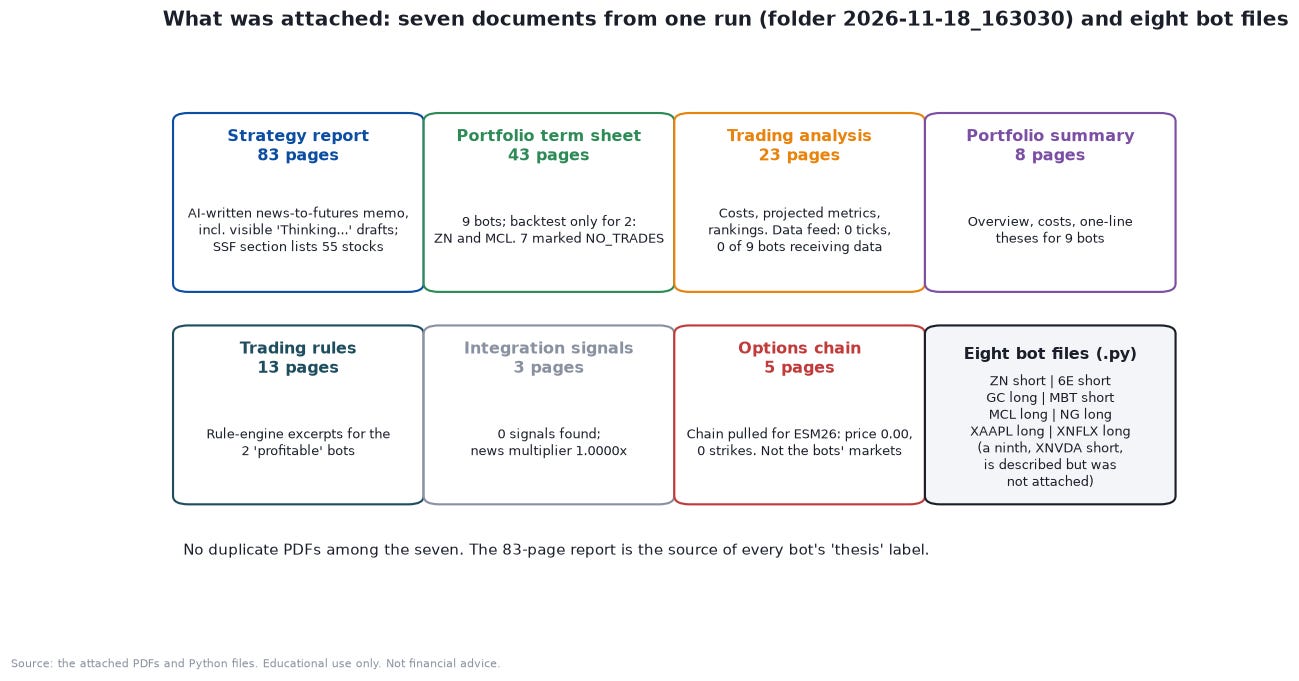
I would call two of the seven broken in the plain sense that they cannot be right. The trading analysis contradicts the term sheet on whether any trades exist, and the options document analyses a contract unrelated to any of the bots. The signals document is not broken, it is just empty. None of the seven are duplicates, although the 83-page report and the term sheet both repeat the same strategy sentences nearly word for word, because the term sheet quotes the report.
The bots are eight files named for their trade. One more bot, a short on a Nvidia single-stock future called XNVDA, appears in the term sheet and is marked NO_TRADES because its symbol is on the data vendor’s not-entitled list. That file was not attached, so it is outside this review, as is the launcher script that starts the nine bots. I looked only at the eight bot files. They are the ZN short, the 6E short, the GC long, the MCL long, the NG long, the MBT short, and the XAAPL and XNFLX longs.
One more oddity before the code. The documents disagree about money. The workbook lists total capital of $132,000 across nine bots, while the rules reference states a $50,000 allocation and a +9.5% portfolio return, which is $4,764.40 divided by $50,000. On the workbook’s capital the same profit is 3.6%. The workbook’s “average Sharpe 1.60, average win rate 56%, average max drawdown 11.4%” are the AI plan estimates, not results. The only measured results in the entire pile are two sets of trades.
What the bots do, in concept only
I am not going to reproduce the code, its parameters, or its settings. What follows is the shared skeleton in generic terms, which is what every one of the eight files has in common. They are cousins: one template, eight directions.
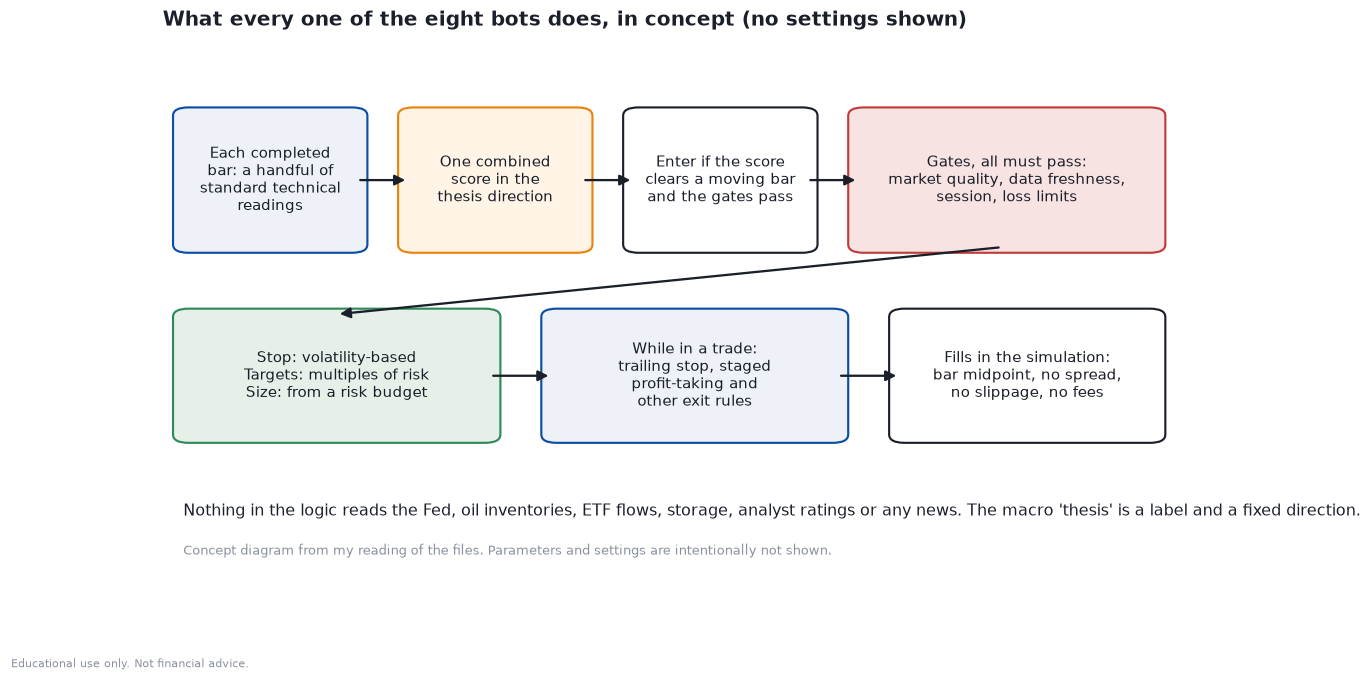
On each completed bar the bot computes a handful of standard technical readings. It standardises them and blends them into one score whose sign is aligned with the bot’s fixed direction. If the score clears a moving bar and a set of gates all pass, the bot enters. The gates are ordinary hygiene: market quality, fresh data, the trading session, and loss limits. After entry, a stop sits a volatility-based distance away, targets are set in multiples of the initial risk, and the position is managed by a trailing stop, staged profit-taking and a few other exit rules. Size comes from a risk budget divided by the dollar stop distance.
In generic mathematics, the score is a weighted sum of standardised signals:
A trade is allowed when the signed score clears the bar and the gates pass:
Here d is the fixed direction, +1 for long and −1 for short, and θ is the adaptive bar. The stop distance is a multiple k of a volatility estimate, and size is the risk budget divided by what the stop would cost per contract:
E is account equity, ρ is the fraction of equity risked per trade and M is the contract multiplier. Profit targets are set in multiples of initial risk, usually called R-multiples:
That is the whole machine. It is a competent template for a trend-following system, and I have no quarrel with the architecture. My quarrel is with what the architecture cannot see. The “thesis” strings in each file, such as hawkish-Fed repricing, geopolitical supply risk, AI power demand, deleveraging, quality rotation and analyst upgrade, are names and a direction. I searched each file for any logic that reads a Fed calendar, inventory data, storage, ETF flows, earnings or analyst ratings, and found none. The macro story decides which way the bot may trade. The tape, filtered through a generic momentum score, decides when. A bot that is told “short bonds” will not know that the market has already priced the news, and it will happily sit short into a first-notice date.
Two further structural facts. All eight use bar-midpoint fills in simulation, so every entry and exit is assumed to trade at a price no real order can guarantee, with no spread, no slippage and no fees. And the template has no concept of the calendar: no contract roll, no expiry, no meeting day, no report day. I come back to what that costs in the last third of the piece.
Thesis versus tape: four ideas are being paid, four are not
The cheapest useful test of a macro thesis is to ask whether the market has moved in the direction the thesis needs. I took each market’s return and multiplied it by the bot’s direction, so a short earns when its market falls. This is a raw market move, with no costs and no bot P&L, but it is a fair read on whether the story is currently working.
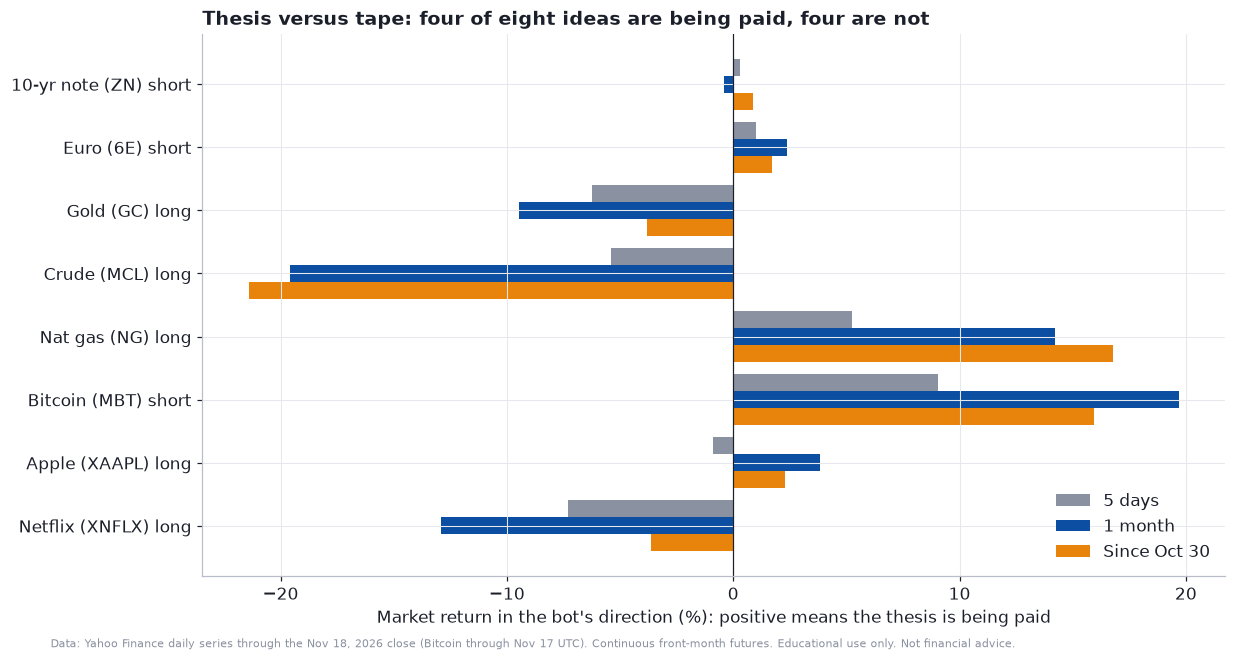
Over the past month, since the October 30 peak in crude, and over the last five sessions, the pattern is the same:
Being paid: the euro short (the euro is down 2.4% over a month), natural gas long (up 14.2%), Bitcoin short (Bitcoin is down 19.7%), and the Apple long (up 3.8% in a month, and 29.6% on the year).
Not paid: the 10-year note short (note futures are up 0.4% over a month, so the short is slightly under water), gold long (down 9.5% over a month and 29% below its January closing high), crude long (down 19.6% over a month and 21.4% since October 30), and the Netflix long (down 12.9% in a month and 48% below its high).
The most interesting one is the pair at the top. The hawkish thesis is spectacular in currencies and crypto and shaky in the market it names first. The 10-year note is a smaller loser than you would think for a market that has just heard a Fed governor float 50 basis points. That is because most of the repricing already happened: the 10-year yield went from 3.96% in late February to a peak of 5.31% on October 5 and now sits at 5.07%, and ZN is 7.1% below its 52-week high. The incremental news on Wednesday moved the front end, where the 2-year yield jumped, and left the 10-year barely changed. I will quantify that in the note section.
The pair at the bottom is stranger. Gold and crude were both supposed to be uncertainty hedges. Both are falling, because the thesis stack contains two contradictory forces and the bot’s author picked one of them. A hawkish Fed lifts real yields and the dollar, which pushes gold and oil down. A geopolitical shock lifts both. On Wednesday the first force won twice over: a Houthi strike claim on Riyadh did not lift crude at all, and gold fell through $3,750 on the rate story. A system that carries both theses at once cannot be hedged against either.
There is a second thing to understand before reading any chart in this piece: the contracts are not the same size. One contract of each of these markets is a very different amount of exposure.
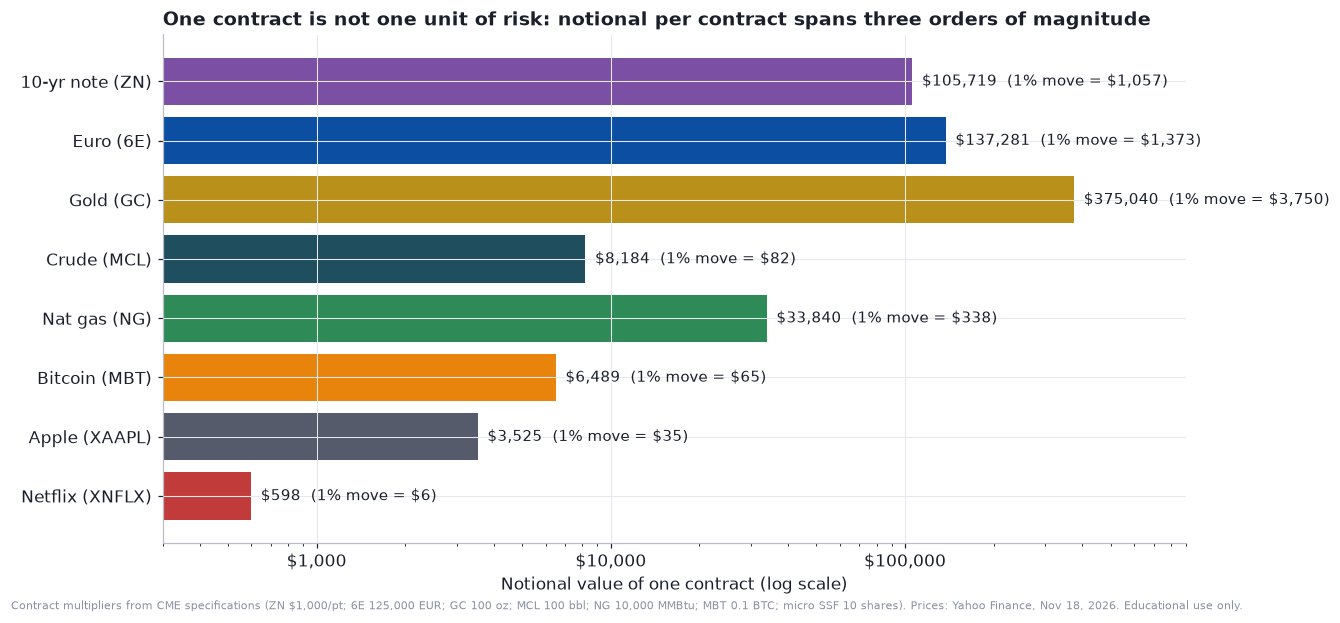
The notional value of one contract is the price times the contract multiplier:
One 10-year note future is about $105,700. One euro future is about $137,300. One gold future is $375,000. One micro crude contract is about $8,200, one natural gas contract about $33,800, one micro Bitcoin contract about $6,500, and a micro Apple or Netflix single-stock future, which covers 10 shares, is about $3,500 and $600. A 1% move is $1,057 on a note, $3,750 on gold, and $6 on the Netflix micro. A portfolio that holds “one of each” is really a portfolio of gold, euro and Treasuries with some rounding errors around the edges. And at $6 per 1% move, a micro single-stock future cannot absorb even a modest commission and spread: the cost of trading it is a large fraction of any realistic profit.
That is the document-level view. Now the macro setting that drives all eight ideas, in one place.
The backdrop in one page: the shock was real, but it landed mostly at the front end
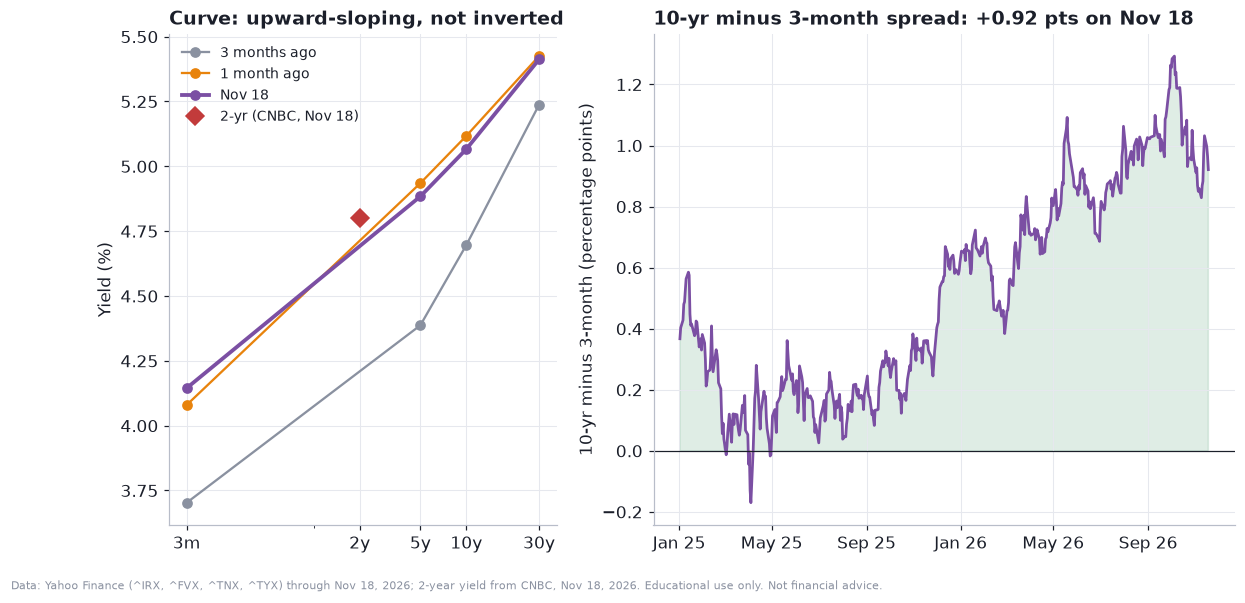
The 10-year yield closed at 5.07% on Wednesday and the 30-year at 5.41%. The 3-month bill yield is 4.15% and the 2-year about 4.80%. The curve is therefore upward-sloping at every point from three months out. The 10-year minus 3-month spread is +0.92 points and the 10-year minus 2-year spread is about +26 basis points, which is a flat but positive slope. Over the last three months the front end has risen more than the long end: the 3-month bill is up about 45 basis points and the 5-year about 50, while the 30-year is up only about 13. That is a mild bear flattener, and it is presumably the flattening that the report calls “inversion deepening”. The curve is not inverted. A claim in the document that “the 2s10s inversion deepens” is simply wrong against the market on the day it was written, and it is a good example of text produced from a template rather than from a data look-up.
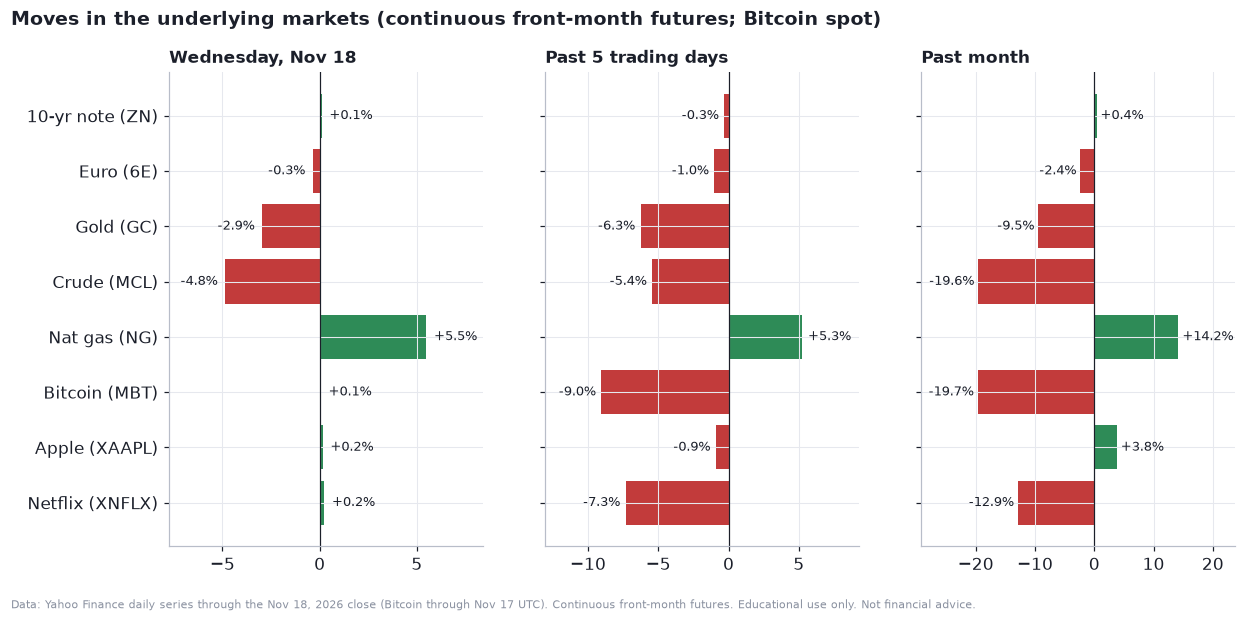
The scale of Wednesday’s cross-market move is easy to understate. Gold fell 2.9% in a day and natural gas rose 5.5%. Crude fell 4.8% on my continuous-contract series, a bigger drop than the 3.2% settlement change in the December contract that market reports quote, because the two series are not the same contract and not the same timestamp. I use the continuous Yahoo series for every chart so that the charts are comparable with each other, and I quote the December settlement of $83.26 wherever I mean the headline price. The VIX closed at 24.6, just under the level at which the rule documents tell a bot to cut size.
The first bot: short the 10-year note (ZN)
Take the headline bot first, because it is the one with the longest backtest and the one most directly tied to the catalyst. The bot is short 10-year Treasury note futures. The document’s reasoning is that a Fed willing to hike more than 25 basis points is bearish for bonds, and the instrument is the December 2026 contract (ZNZ6), although the Python file labels itself with the September 2026 contract (ZNU6), which expired in late September.
Start with what a ZN contract is. It pays $1,000 per full point of price, with a minimum tick of one-half of a thirty-second, worth $15.625. It settles into deliverable Treasury notes, and the December contract has a first notice day of November 30 and a last trading day of December 21. Anyone holding it past the end of the month either rolls to March or faces delivery notices. A trend-following template with no notion of the calendar will not roll for you.
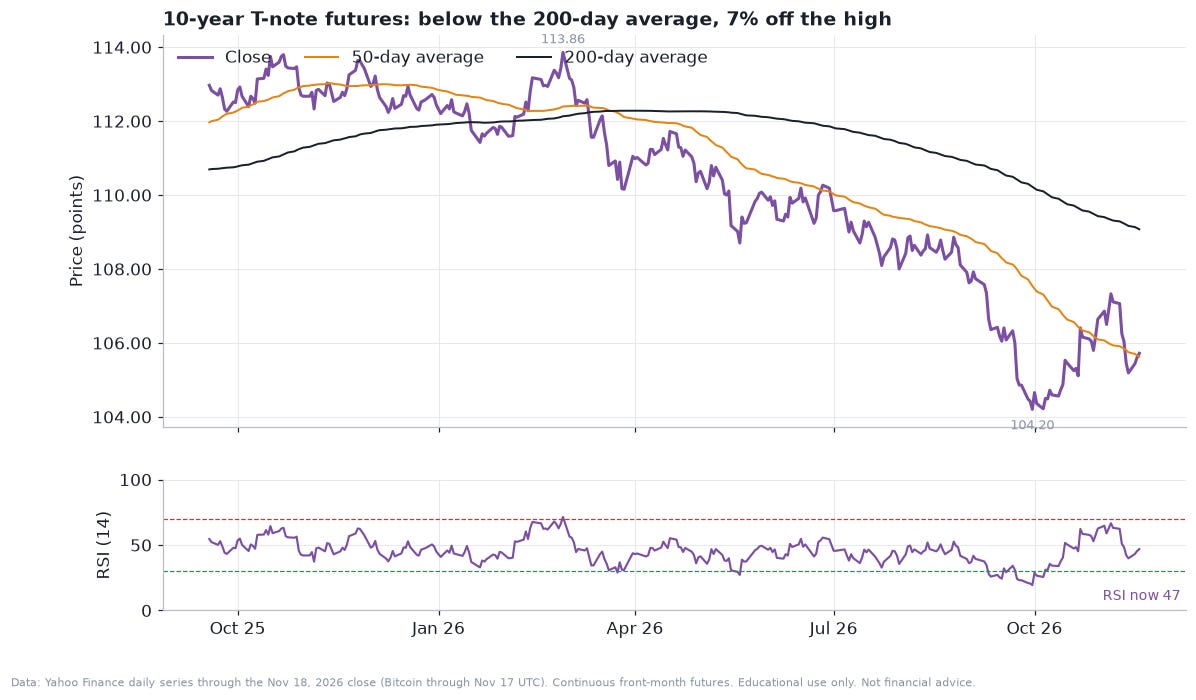
The technical picture is neutral-to-heavy. ZN closed at 105-23 (105.72), above its 50-day average (105.63) and 3% below its 200-day average (109.07). That 200-day average has been rolling over since spring, which is the technical signature of a downtrend that has run for most of the year: the contract is down 6.0% year to date, and 7.1% under its 52-week high of 114.375. The 14-day RSI is 47, which is nothing. The most recent swing low was 104.20 on September 30, days before the 10-year yield’s 5.31% peak on October 5. Since the October 30 peak in crude the contract has moved less than 1%, and price is sitting on its own 50-day average. A short seller here is short a market that has already done most of its falling and has stopped trending. A trend bot with a momentum score based on persistence needs persistence, and for a month ZN has not given it any.
The more important fact is what ZN actually measures. A note future is, to first order, a bet on the level of the 10-year yield, and its sensitivity is captured by duration. For a small yield move,
I measured this directly. Over the past year, regressing daily ZN returns on daily changes in the 10-year yield gives a slope of −0.063 per percentage point, with a correlation of −0.98 and an R-squared of 0.955 once the dollar is added. Put plainly, a 10 basis point rise in yield costs the contract 0.63%, an effective duration near 6.3, and the yield explains more than 95% of the contract’s daily variance. In dollars, one basis point is worth about $67 on one contract. A 25 basis point move is about $1,670. The bot’s short is therefore a short of the 10-year yield falling, and everything it needs to know is in one number the bot never reads.
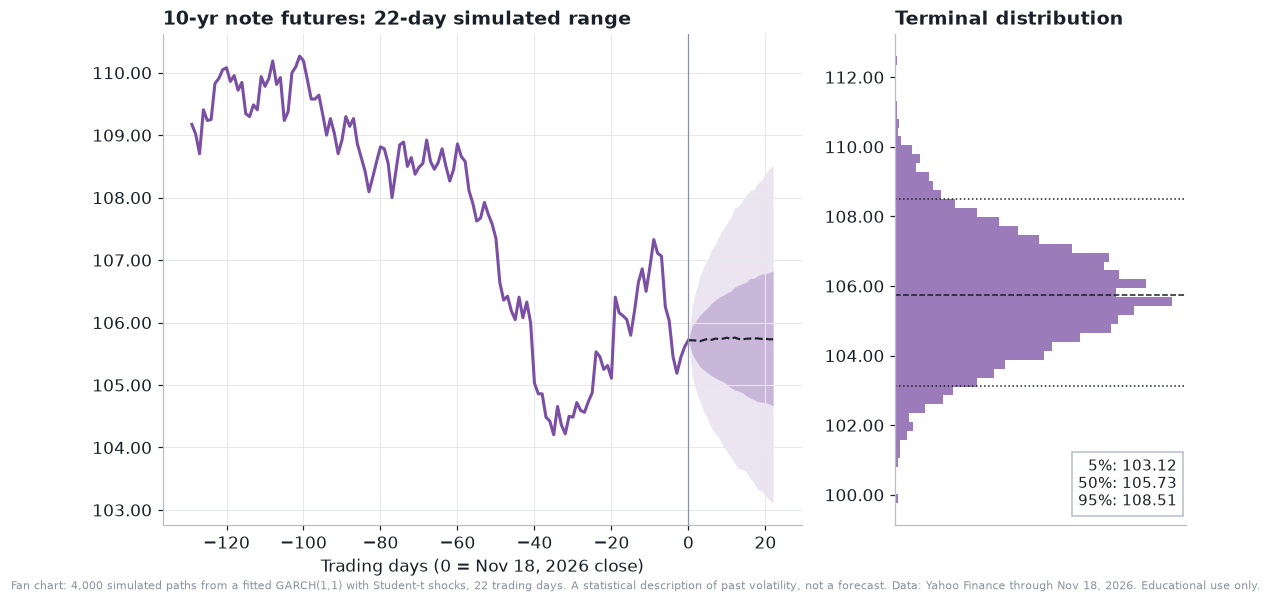
How much can ZN move in the next month? I fitted a volatility model to the daily returns and simulated 4,000 paths. The standard model is GARCH(1,1), where today’s variance is built from a long-run level, yesterday’s shock and yesterday’s variance:
For ZN the fitted persistence α + β is 0.991, with Student-t shocks of about 11 degrees of freedom. Persistence that high means shocks fade slowly. The half-life of a variance shock is
which comes to about 73 trading days for ZN. The simulated 22-day distribution has a median of 105.73, a 25th to 75th percentile range of 104.66 to 106.83, and a 5th to 95th percentile range of 103.12 to 108.51. That is a one-month range of roughly 2.6 to 2.8 points either side, or about ±$2,700 per contract, and it is nearly symmetric. If the bot is right and a 50 basis point hike is delivered, the yield-to-price arithmetic puts ZN near the bottom of that range. If the Fed hikes 25 and says it is done, the top of the range is in play. The simulation does not know which. It only says how wide the net has to be, and the realised volatility of the last 20 days, 6.8% annualised against a one-year figure of 4.5% and a 99th percentile reading on the year, says the net has just gotten wider.
Weigh that against the thesis. Rate futures overwhelmingly favour a 25 basis point hike, with only about 4% to 5% priced for 50. If the December outcome matches the price, the surprise is zero and a short has nothing new to pay it. A trade whose edge depends on the market being wrong by 25 basis points needs a very confident view that the Fed will go big, and Waller’s comment moved the 2-year yield while leaving the 10-year little changed. The bot chose the instrument with the least leverage to the idea it expresses.
The second bot: short the euro (6E)
The euro future contract is 125,000 euros, so a $0.0001 move per euro is $12.50 and a one-cent move is $1,250. The bot is short, on the logic that US rate hikes strengthen the dollar and a more cautious European Central Bank weakens the euro. The bot file uses the June 2026 contract (6EM6) and the term sheet uses December (6EZ6), whose last trading day is December 14.
This is the cleanest-working idea in the whole pile. The euro future closed at 1.0983, within a hair of its 52-week low of 1.0980, down 2.4% in a month, down 6.0% in three months, and down 6.5% on the year. Against the 52-week high of 1.2076, the contract is 8.4% lower. It has been below both its 50-day and 200-day averages since mid-September, and its 14-day RSI is 29, which is oversold by the textbook but not a reversal signal on its own.
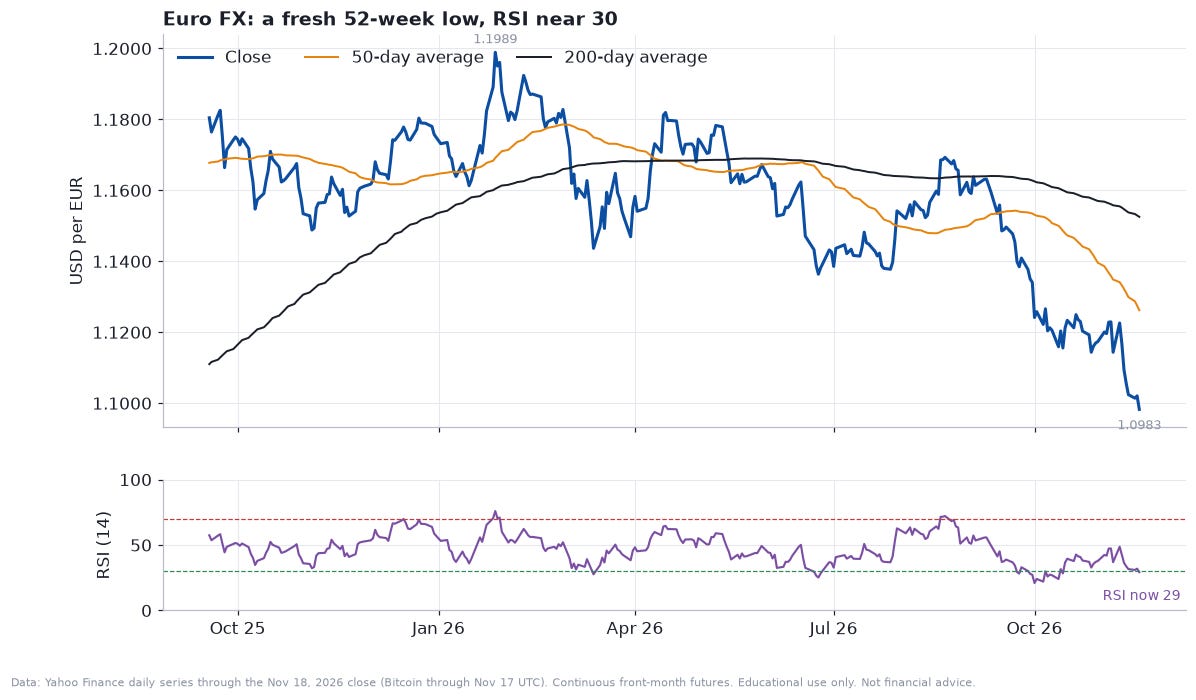
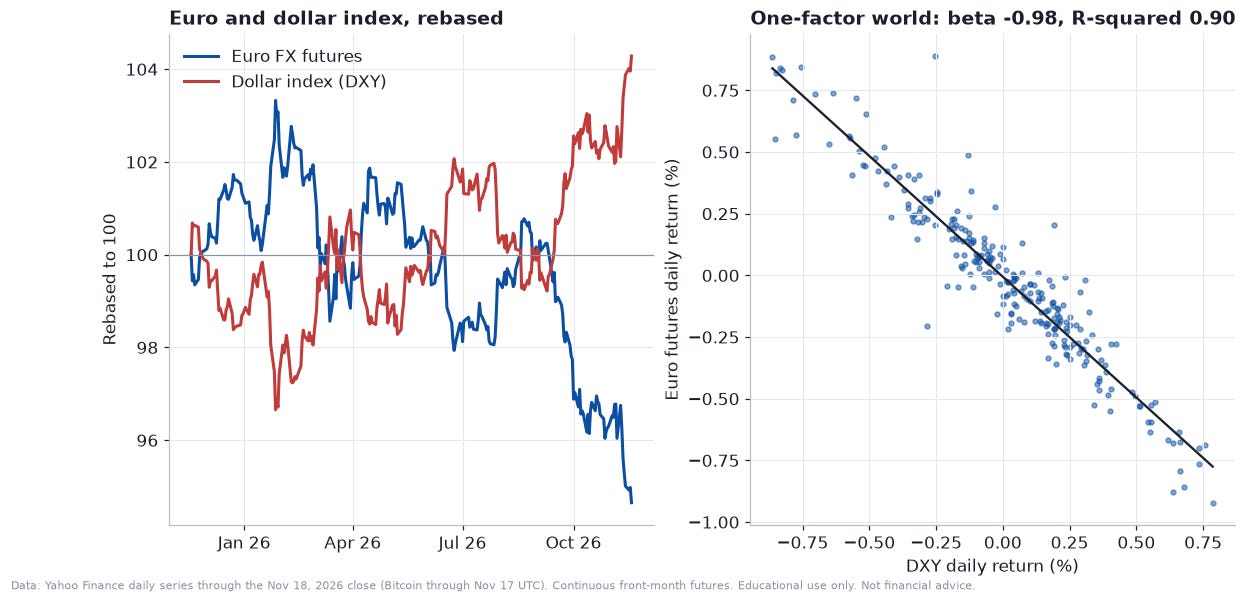
The reason it works is that the euro is, over short horizons, almost a one-factor market. Regressing daily euro-futures returns on daily dollar-index returns over the past year gives a beta of −0.99 with an R-squared of 0.90:
with the estimator
Ninety percent of the euro’s daily variance is the dollar. The euro leg of the dollar index carries most of the index’s weight, so that is partly arithmetic, but the practical meaning is the same: to be short the euro is to be long the dollar, and to be long the dollar is to be on the right side of the Fed’s tone. The dollar index closed near 103.8, up 5.0% in three months and 2.0% in a month and, according to market reports, at a 19-month high, while the euro future fell 6.0% in three months.
The fundamental case is rate differentials: a Fed threatening more hikes against a central bank facing weak euro-area growth. Market reports on Wednesday said the ECB was also expected to hike in December, but that the US-euro rate gap was widening anyway and growth worries dominated. That matters for the trade, because it means the short euro is not a bet that the ECB stays on hold. It is a bet that the Fed moves faster, and the market already prices 25 basis points of that.
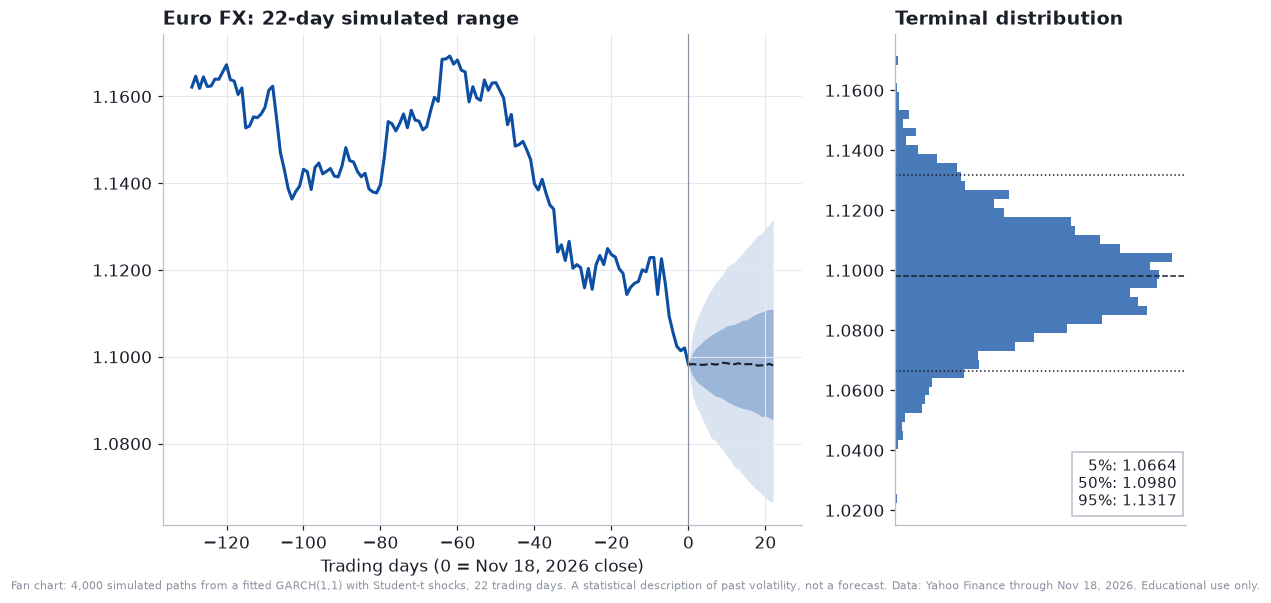
The fitted volatility model gives a 22-day distribution with a median of 1.0980, a 25th to 75th percentile range of 1.0855 to 1.1110, and a 5th to 95th percentile range of 1.0664 to 1.1317. Persistence is 0.986 and the forecast annualised volatility is 6.2%. In dollars, the 5% to 95% band spans about $8,200 per contract. The risks are two-sided and the skew matters: oversold currencies with a central bank decision (ECB, December 17) and a Fed decision (December 9) in the same fortnight have a history of sharp short-covering moves. The bot has no way to know the calendar.
The other point is hygiene. The euro has been trending for months, which suits a momentum template, and the bot’s short has had a strong tape behind it. The file’s contract label is the June contract, which expired in mid-June. The file registers only the root symbol for data, so which contract it would trade is decided outside the file, and nothing inside it handles a roll.
The remaining sections are for paid subscribers: gold, crude, natural gas, Bitcoin, Apple and Netflix one by one, the portfolio risk model, the forensic look at the only two backtests, the data-quality audit, and the calendar.
The third bot: long gold (GC)
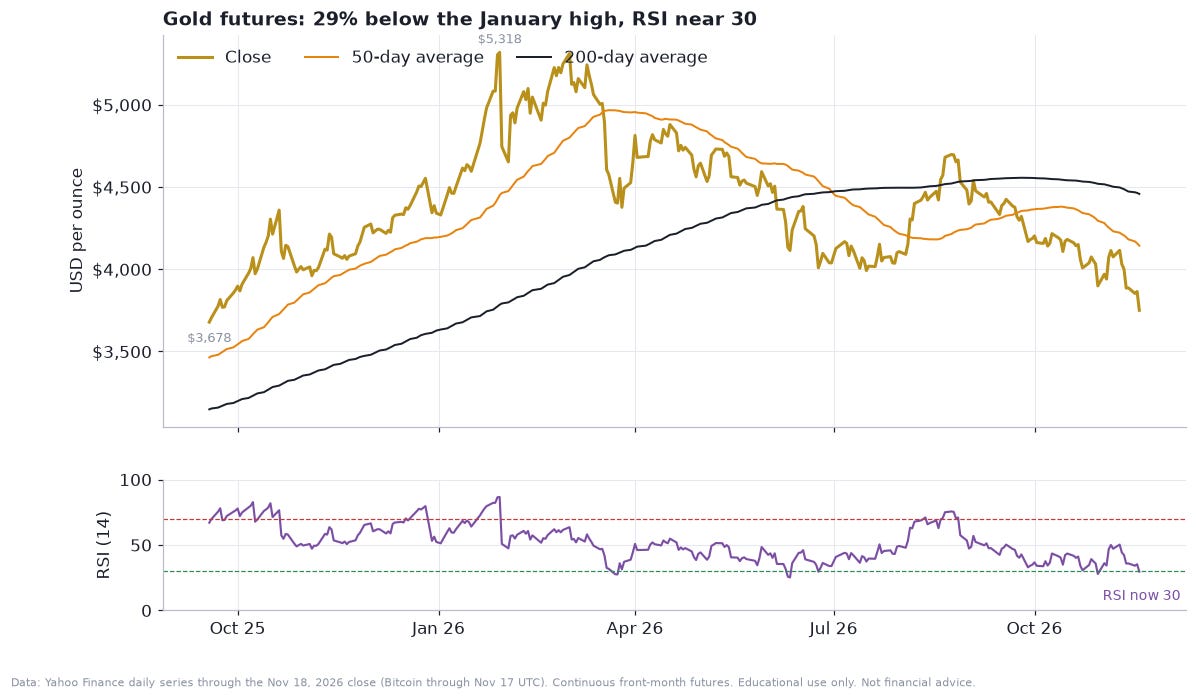
Gold is where the thesis stack collides with itself. The bot is long gold as an “uncertainty hedge”, and the tape on Wednesday made it the worst-performing idea in the book. A gold future covers 100 troy ounces. At $3,750 that is $375,000 per contract, and a 1% move is $3,750. The bot file names the August 2026 contract (GCQ6), expired in late August. The December contract has a first notice day of November 30.
Gold closed at $3,750.40 on my continuous series, down 2.9% on the day, 9.5% in a month, 18% in three months and 13.6% on the year. It is 29% below its January closing high of $5,318, and it sits below both its 50-day average ($4,143) and its 200-day average ($4,458), with a 14-day RSI of 30. Spot gold broke below $3,800 for the first time since September 2025 on Wednesday, according to Investing.com, and below $3,750, a 14-month low, according to Kitco. That is not a dip in an uptrend. It is a trend break after a parabolic run.
The macro explanation is plain. Gold pays no income, so its opportunity cost rises with real yields. The 10-year yield is near 5.07%, up from 3.96% in February and around 5.31% at the October peak, and the dollar is at a 19-month high. Over the past year, gold’s daily returns have had a 60-day rolling correlation of between about −0.8 and −0.15 with the dollar index and between about −0.4 and +0.1 with changes in the 10-year yield. Both relationships are negative most of the time, and they have not been stable, which is the usual caution about all rolling correlations:
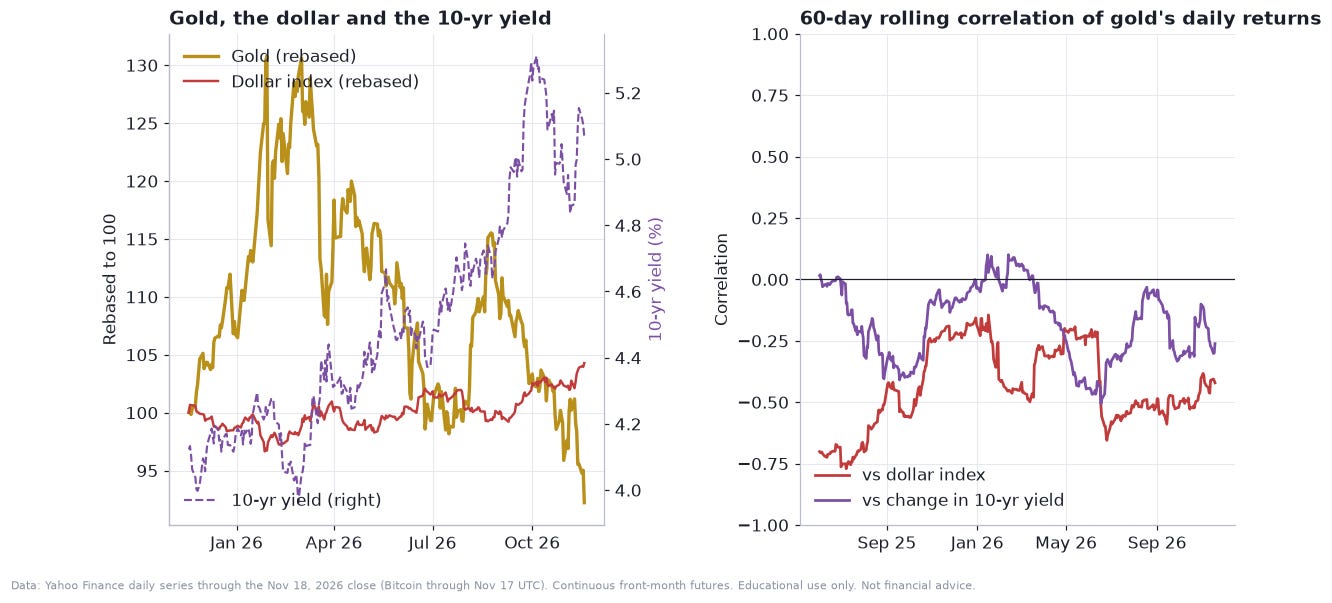
A regression of gold’s daily returns on the dollar and the yield explains only about 16% of the variance, so gold is not a pure rates trade. There are other drivers, such as central-bank buying, fund flows and the safe-haven bid that fed the run to a January peak, but when real yields and the dollar jump together gold has a hard time. “Uncertainty hedge” assumes that geopolitical risk and rate risk move in opposite directions. In 2026 they have moved together, and rate risk has been the louder of the two.
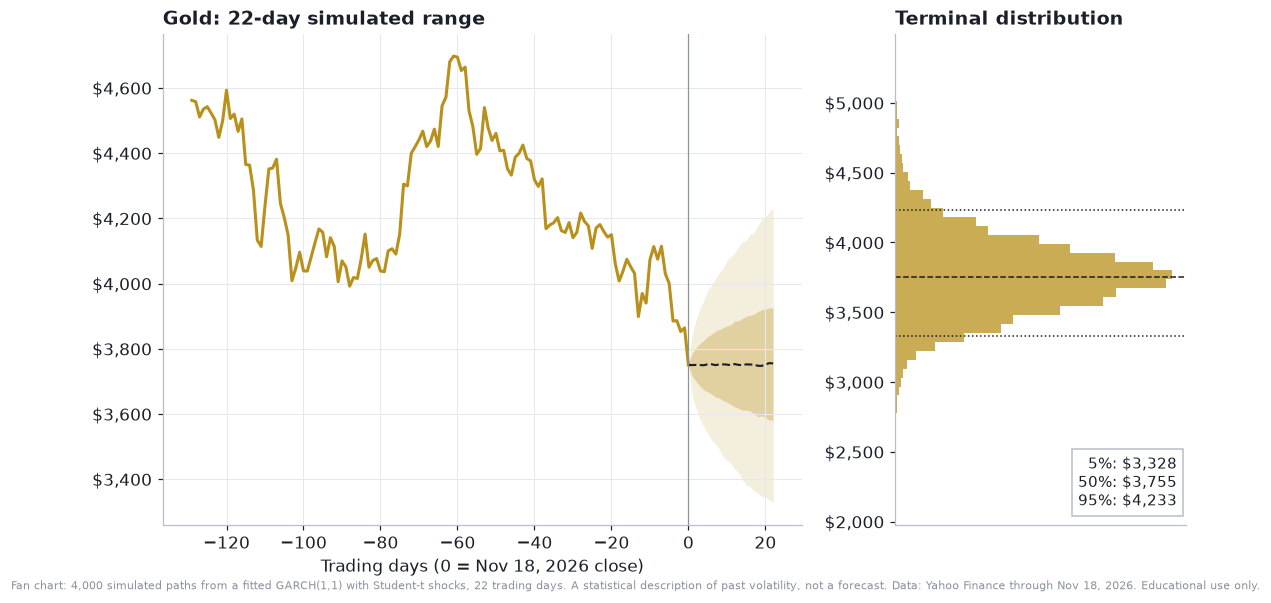
The simulated 22-day range, from a fitted volatility model with persistence 0.976 and a forecast annualised volatility of 25%, has a median of $3,755 and a 5% to 95% range of $3,328 to $4,233. That is a band of $905 per ounce, or about $90,500 per contract. For scale, the whole ZN band is about $5,400 per contract, so gold’s risk per contract is roughly seventeen times larger, in an instrument where a one-day move of 3% is now routine.
What would have to change? Either the Fed hikes and the dollar tops, or the tape turns up on bad news. Neither is something this bot reads. For a tape-reading template, an oversold market below both averages is not a long signal, so the bot’s own filters will most likely keep it out of the trade until a new trend forms. The risk is the opposite: a sharp bounce triggers an entry at the top of a relief rally.
The fourth bot: long micro WTI crude (MCL)
The crude bot is long micro WTI, which is 100 barrels per contract, so $8,184 of notional at $81.84 and $100 per dollar of price. The thesis, in the term sheet’s words, is the Houthi missile attack on Riyadh’s King Khalid Airport injecting a supply-risk premium into crude, tempered by “surplus-outlook and inventory-build headlines”. The Python file names the July 2026 contract (MCLN6, long expired), the term sheet quotes the January 2027 contract (MCLF7), and the December contract that the headline price refers to expires on Friday, November 20.
The tape tells the story the bot’s author half-acknowledged. Crude is up 42.5% on the year, from $57.42 on the last day of 2025, with a closing high of $112.95 on April 7. But it is down 19.6% in a month, 21.4% since October 30, and 27.5% below that closing high. It is under both its 50-day average ($94.83) and its 200-day average ($88.09), with a 14-day RSI of 33. Wednesday’s drop was the market’s answer to the EIA’s weekly report: US crude stocks rose 3.4 million barrels to 417.8 million, well above expectations, with gasoline and distillate stocks also up, according to CNBC. Brent settled at $91.95, so the Brent-WTI gap widened to about $8.7 as US crude fell faster than the world benchmark.
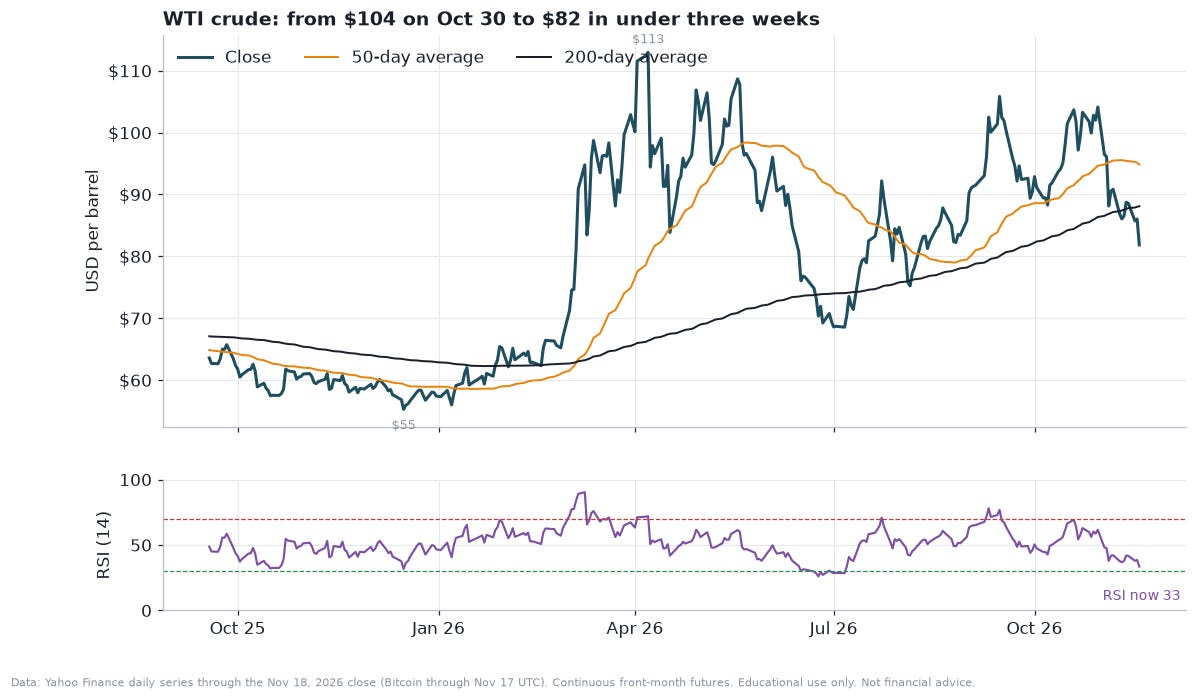
What should a bot that is long a geopolitical premium make of the fact that the Houthis claimed a strike on Riyadh’s financial centre and airport on Wednesday and oil did not rise? Reports at the time showed Brent and WTI slipping on the day of the claim. A risk premium is paid when the market expects a physical supply disruption, not for headlines, and with an inventory build and a surplus narrative a missile claim is not enough. This is the central weakness of any macro-label bot: the label does not tell the bot when the market has stopped believing the label.
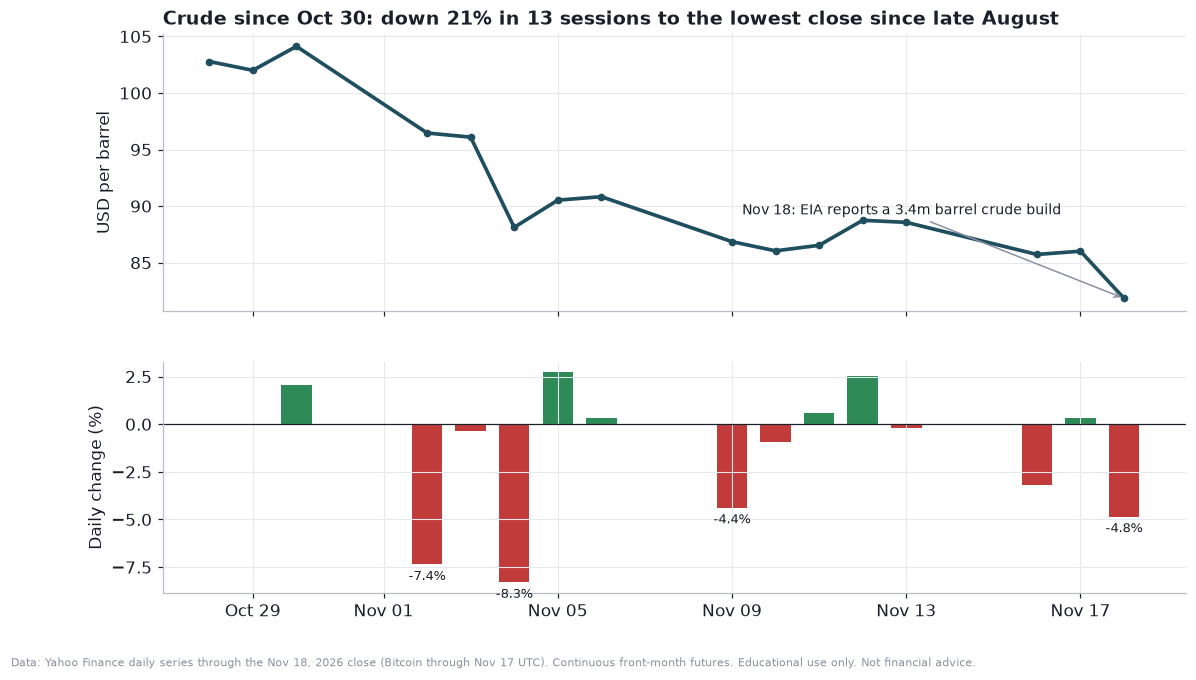
The path since October 30 is eight down sessions out of thirteen, with two outsized drops of 7.4% on November 2 and 8.3% on November 4 and a further 4.8% fall on Wednesday. A long bot obeying a trailing stop would have exited on the first big drop, which is what the stop is for. The danger is the next entry: after a 21% fall, oil is in the territory where a momentum score flips on bounces.
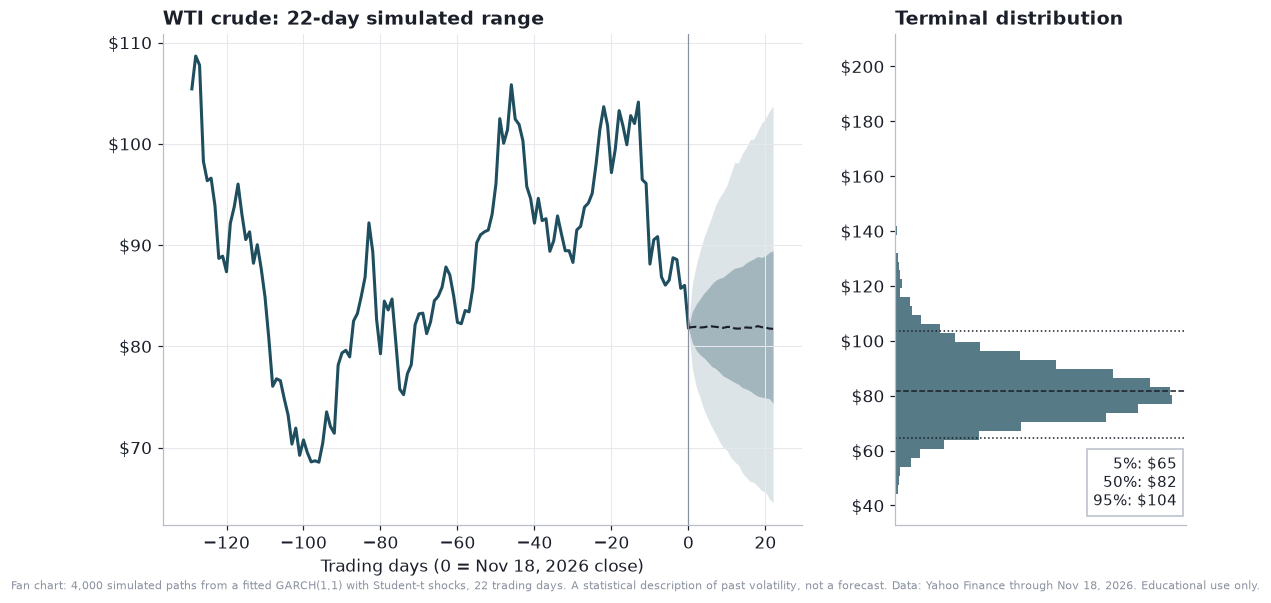
Oil’s risk is the largest in the book except for natural gas. The 20-day realised volatility is 55% annualised, the one-year figure is 58%, and the fitted GARCH model, with persistence 0.987 and a forecast of 50% annualised, simulates a 22-day range with a 5th to 95th percentile of $64.55 to $103.74 around a median of $81.72. That is a $39 band, or $3,900 on a single micro contract and $39,000 on a full-size one. A payoff of somewhere between a gain of $2,200 and a loss of $1,700 per micro by month-end tells you only that the net is wide.
One more thing that matters for any oil trade held for weeks: the curve. A futures contract converges to spot at expiry, and the holder of a long position earns or pays the shape of the curve each time they roll. For two adjacent contracts, the annualised roll yield is
where F₁ is the nearer price and F₂ the further. When the front is above the back, that is backwardation, and the yield is positive for a long. I do not have a clean public curve for November 18 and so I will not quote one, but the backtest section below shows that the term sheet’s own fills sit consistently beneath the front-month series, which is the footprint of a backwardated curve: an elevated front, a discount to the January contract, and a market that was, for months, paying for prompt barrels.
The fifth bot: long natural gas (NG), and a winter-seasonality claim the data contradict
The natural gas bot is the one with the best Wednesday of the lot, and the worst-supported logic. Natural gas futures cover 10,000 MMBtu, so a price of $3.38 is $33,840 of notional per contract and a 1% move is $338. The bot is long, with the thesis labelled “AI-power demand and winter seasonal”. The Python file names the July 2026 contract (NGN26). The December contract, NGZ26, expires on November 25.
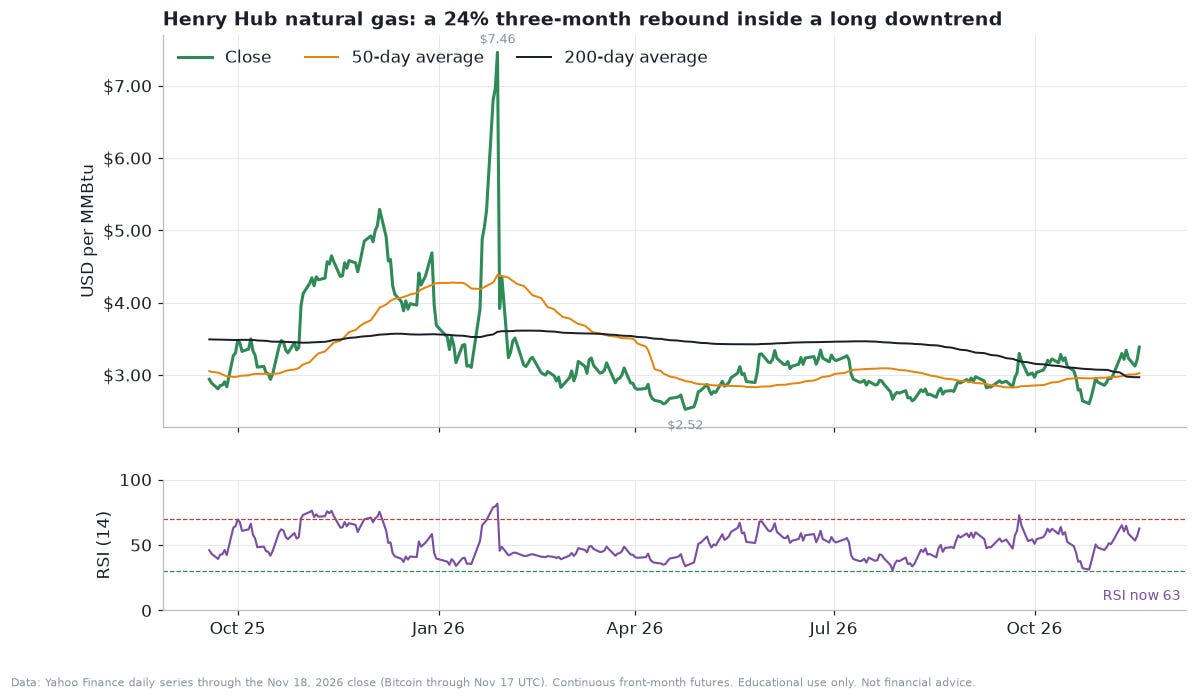
Henry Hub for December settled at $3.372 on Wednesday, up 5.1% from $3.208, according to market reports, as the two-week forecast for heating degree days jumped to 297 from 216. Storage was expected to have built to roughly 3,889 billion cubic feet, about 2.3% above the five-year average, in the EIA report due Thursday. My continuous series shows the contract at $3.384, up 14.2% in a month and 23.8% in three months, but still 8.2% lower on the year and 54.6% below the closing high of $7.46 set on January 28 during the winter spike. It is above both its 50-day average ($3.02) and its 200-day average ($2.97), with a 14-day RSI of 63. This is a rebound from $2.52 on April 24 inside a long downtrend.
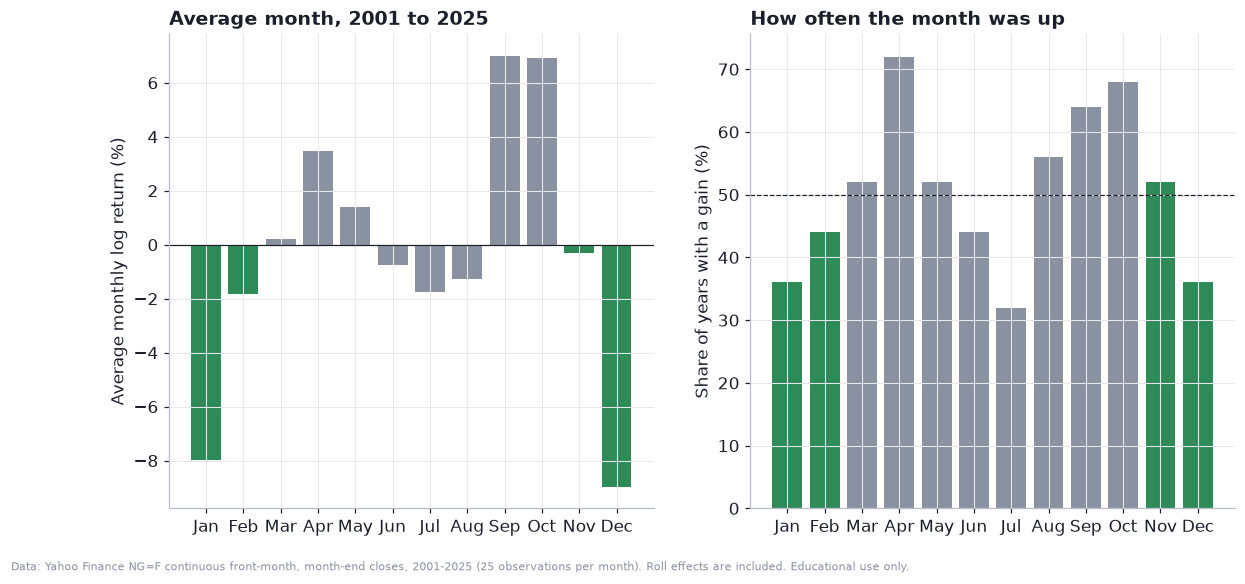
Now the seasonal claim. The bot’s label asserts that winter tends to be good for gas. I tested it directly. Using 25 years of month-end closes of the continuous front-month series, 2001 through 2025, I computed the average log return in each calendar month:
The result goes against the label. December averaged −9.0%, January −8.0%, and February −1.8%, with the market up in only 36% of Decembers, 36% of Januaries and 44% of Februaries. Averaged over the three winter months, the contract lost 4.8% a month, against a gain of 1.9% a month in the other nine. The best months were September and October, at about +7% each, and the worst was December. In other words, the best time to own front-month gas in this sample was before the winter demand showed up, not during it.
Be careful about how far to push this. A continuous front-month series includes roll gaps, 25 observations per month is a small sample, and gas returns are heavy-tailed, so the average of 25 numbers is dominated by a few huge moves, such as the 2008 collapse from $13 and a handful of other extreme months. The January 2026 spike lies outside the sample. The usual explanation is that the winter premium is already in the winter contracts well before winter starts. What earns money in December is a colder-than-priced forecast, which is exactly what happened Wednesday, and which a momentum bot reads only after the fact.
The fitted volatility model has persistence of 0.972 with heavy tails (about 5.3 degrees of freedom), and it forecasts 63% annualised volatility. Its 22-day 5th to 95th percentile range is $2.52 to $4.54 around a median of $3.39, which is $20,300 across one contract. One caution on the inputs: the continuous series contains a one-day gap of about −64% on January 29, when the expiring February contract’s spike gave way to March. That is a roll gap rather than a tradable move, so I set that single day to zero in every risk calculation in this piece.
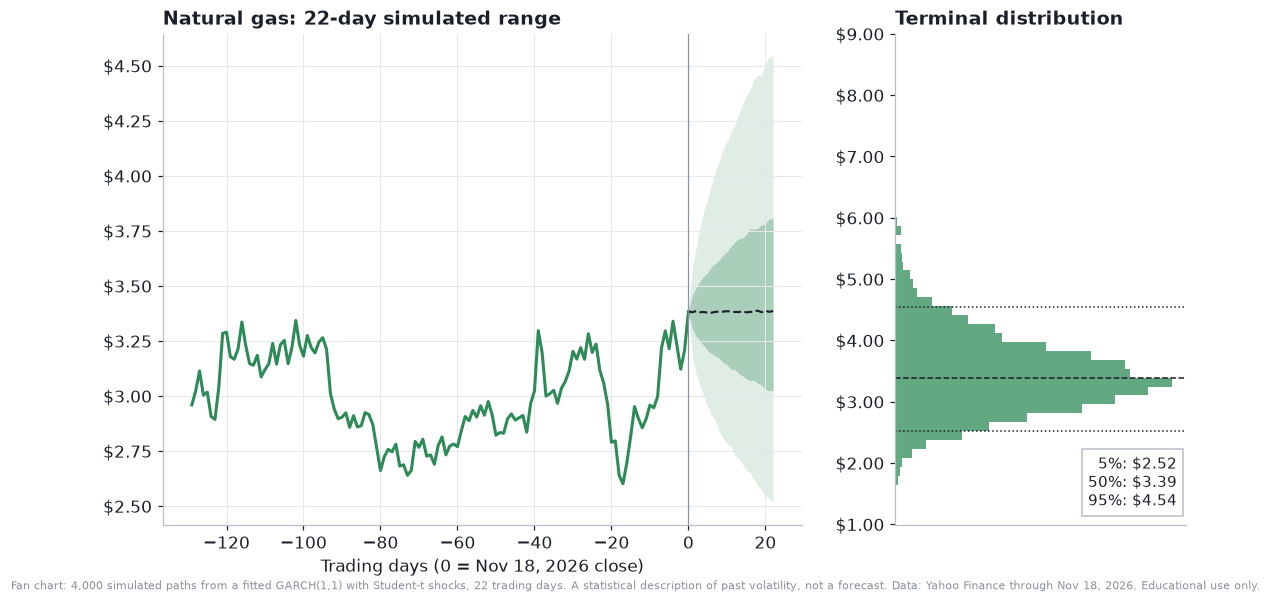
The honest reading is that the bot is on the right side of the best-moving market in the book this week, for reasons its label does not describe. The label is “AI power demand”. The driver was a change in the weather map.
The sixth bot: short micro Bitcoin (MBT)
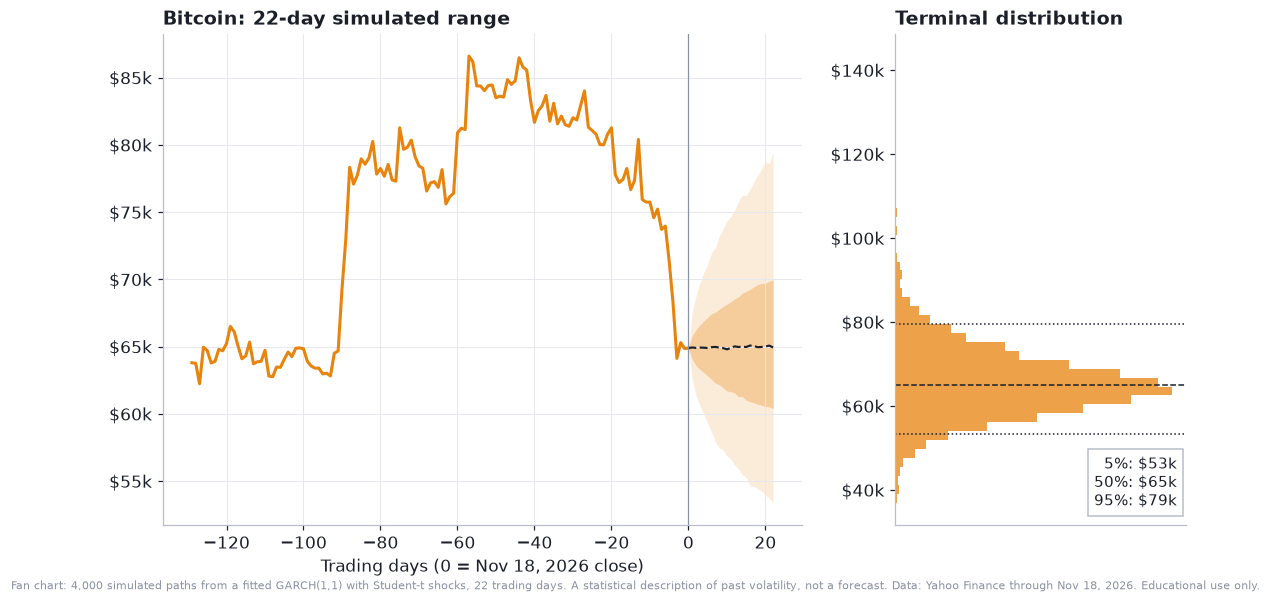
The Bitcoin bot is short one-tenth of a bitcoin per contract. At the November 17 close of $64,894 that is $6,489 of notional and $65 per 1% move. The Python file names the June 2026 contract (MBTM6). The November contract, MBTX6, expires on Friday, November 27. The bot’s thesis is “deleveraging”, the idea that liquidations and ETF outflows push the price down further.
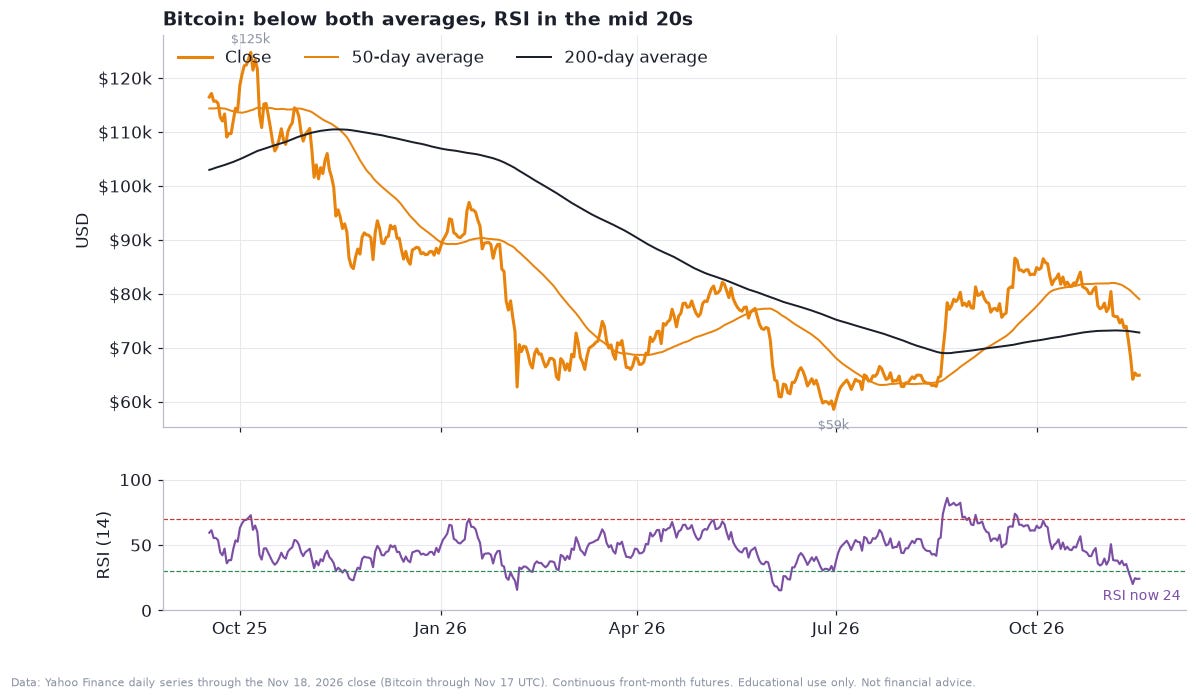
The tape has paid it. Bitcoin is down 19.7% in a month, 14.2% in three months, 25.8% on the year, and 48% below its closing peak of $124,753 on October 6, 2025. It is below its 50-day average ($78,991) and its 200-day average ($72,798) and its 14-day RSI is 24, the lowest reading of the eight markets. On Wednesday it traded as low as about $62,500, an over-four-month low, according to Investing.com. Spot Bitcoin ETFs lost about $240 million on Tuesday and more than $2.58 billion in November, according to Cointelegraph and CryptoQuant, and CoinDesk reported that the basis trade, buying spot and selling futures, was drying up.
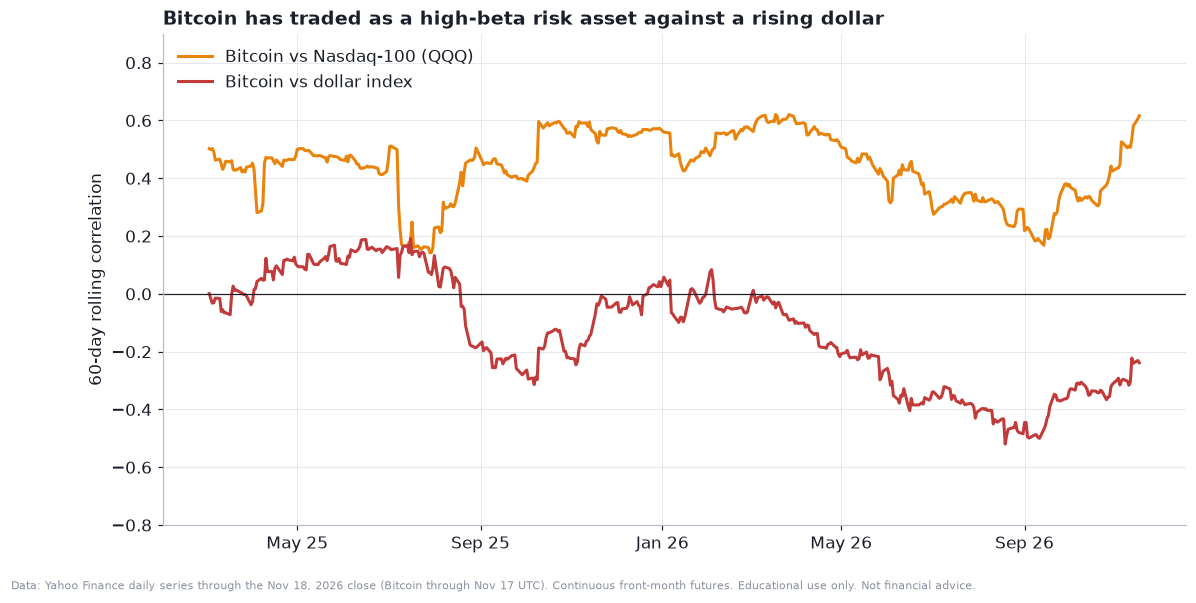
The macro link is not subtle. Over the past 60 sessions Bitcoin’s daily returns have a correlation of 0.62 with the Nasdaq-100 fund QQQ, up from a low of about 0.2 in late summer, and −0.24 with the dollar index. Over 120 sessions its correlation with the S&P 500 is 0.43, the highest in this book. Bitcoin is trading as a leveraged technology stock that is sensitive to the dollar and to rates, not as a hedge. A hawkish Fed hits it twice, once through discount rates and once through liquidity.
That is why the idea has worked, and why its remaining edge is thin. The contract is oversold by the textbook measure, it is only about 11% above its June closing low of $58,559, and its 20-day realised volatility of 42% is at the 90th percentile of the past year. The fitted model, with persistence 0.979 and very fat tails (3.9 degrees of freedom, the thickest in the book bar Apple and Netflix), gives a 22-day range of $53,400 to $79,400, with a median of $64,900. In dollars that is $2,600 of range on one micro contract. A short has more room to run only if the Fed delivers more than the market expects, and as we saw, only about 4% to 5% is priced for that. A relief rally in equities would hit this short harder than anything else in the book, because its correlation with equities is the highest in the book.
The seventh bot: long Apple micro single-stock futures (XAAPL)
Apple is the one idea the market is clearly rewarding, and the one where the bot’s description is least connected to its mechanics. The micro single-stock future covers 10 shares, so at $352.45 it is $3,525 of notional and $35 per 1% move. The thesis label is “quality rotation”: money leaving weaker tech names for the highest-quality large cap.
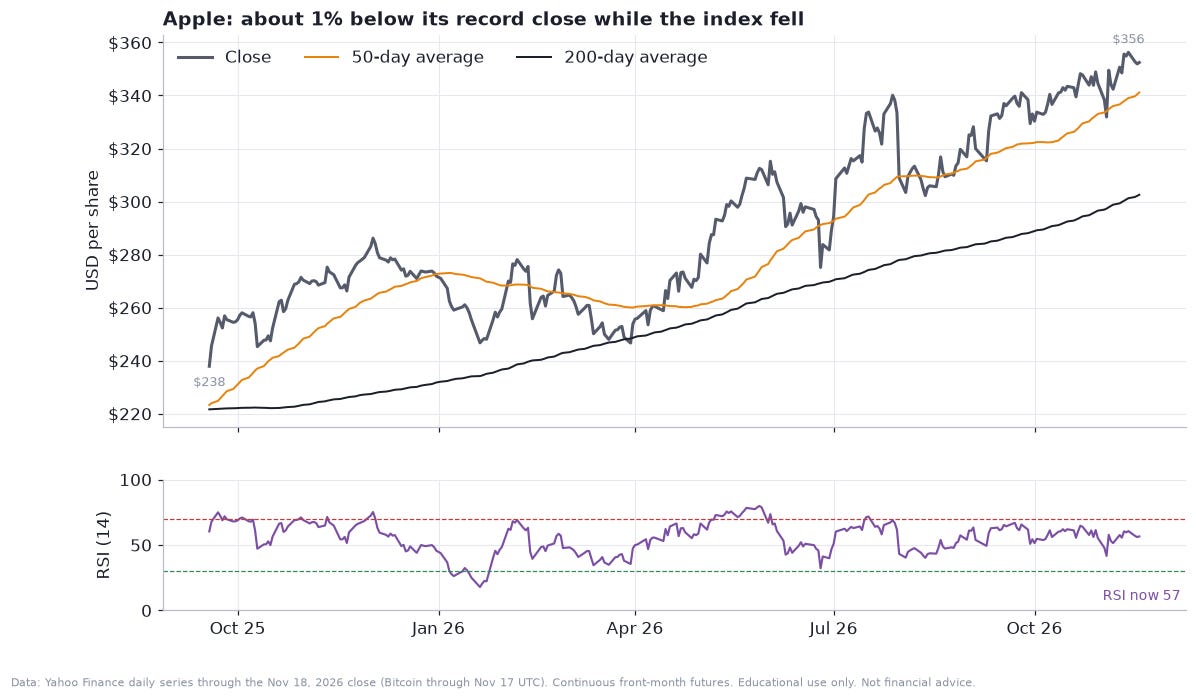
Apple closed Wednesday at $352.45, 1.1% below its record close of $356.27 on November 13 (the intraday record was $360.83 that day, which implies a market value above $5.2 trillion). It is up 29.6% on the year, 13.2% in three months and 3.8% in a month, comfortably above its 50-day average ($341) and 200-day average ($303), with a 14-day RSI of 57, a neutral reading, unlike the oversold readings in five of the other seven markets. It has done this while the S&P 500 fell 3.2% from November 13 and 6.3% from its October 6 high. That is relative strength in the plainest sense.
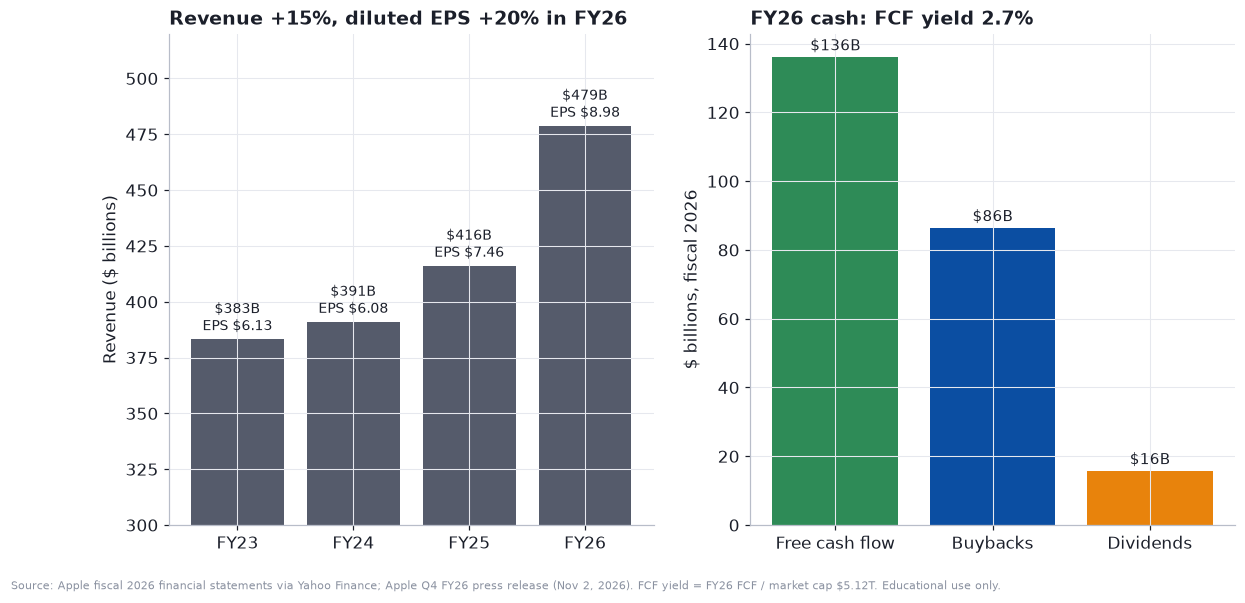
The fundamentals support the price without making it cheap. In fiscal 2026 Apple’s revenue rose 15% to $479 billion and diluted earnings per share rose 20% to $8.98, according to its financial statements via Yahoo Finance and its November 2 results. It generated $136 billion of free cash flow, spent $86 billion on buybacks and $16 billion on dividends. At a market value of about $5.12 trillion that is a free-cash-flow yield of 2.7% and a trailing price-to-earnings ratio near 39. The valuation is rich, but the return of capital is large: buybacks and dividends together are about 2.0% of the market value, covered by free cash flow about 1.3 times over. Reuters reported that Apple guided to a drop in holiday-quarter margin because of rising memory costs, and Yahoo Finance reported cuts of 10% to 15% to iPhone 18 Pro orders. That is the bear case: a record price on a growth story that is slowing at the margin.
Single-stock futures are priced from the stock, the interest rate and the dividends to be paid before expiry, a cost-of-carry relationship:
where D is a dividend paid at time t_D. With short-term rates near 4.1% and a dividend yield of only 0.3%, the future trades at a premium of roughly 0.3% a month to the stock, which is a cost for a long that does not show up in a bar-based backtest of the stock’s price. The December contract expires on Friday, December 18, the quarterly expiry that also brings index-option and index-futures expiration.
The most valuable thing the market can tell you about Apple is in its options, because the next big event is earnings, expected on or about January 28. Reading at-the-money implied volatility off the Yahoo Finance option chains after the Wednesday close, I find 25.3% for the December 18 expiry and 27.0% for the February 19 expiry. The jump between expiries that straddle the earnings date is the market’s price of the event. If σ₁ is the implied volatility before the event, σ₂ the volatility after it, and T₂ the longer expiry in years, the variance attributable to the event is the extra total variance in the longer option:
Applying this to the January 15 and February 19 expiries, I get an implied earnings-day standard deviation of about 5.5% for Apple. If the move is roughly normal, the expected absolute move is a little under 80% of that, about 4.4%:
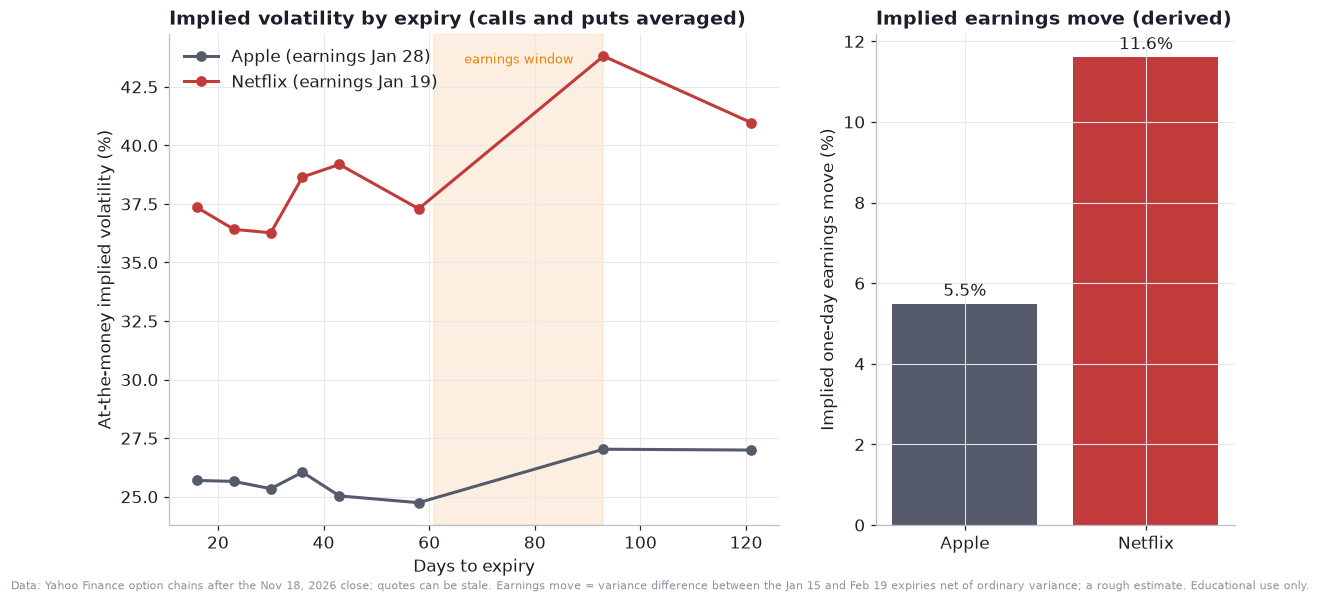
This is a rough estimate from stale-able quotes, not a quoted straddle price, but the arithmetic is the point. A long micro single-stock future has a one-day, plus-or-minus-5.5% event sitting about ten weeks out. It is worth about $190 on a $3,525 position, and a bot with no calendar has no way to reduce the position before it.
The fitted volatility model for Apple is the weakest fit in the study (persistence of 0.69, with heavy tails of 3.5 degrees of freedom), which is typical for a megacap whose big moves are scheduled events rather than clustered shocks. Its 22-day range is $311 to $401 around $352, so about $900 of range on a 10-share contract. The last remark is that the bot’s file is, in my reading, structurally broken: a block of code was pasted into the middle of the class so that only the constructor stays inside it and the rest of the methods are left outside. As written it cannot run, so no honest backtest of it exists whatever the state of the data feed.
The eighth bot: long Netflix micro single-stock futures (XNFLX)
The Netflix bot is the mirror image of Apple. It is long, with the label “analyst upgrade”. The micro future covers 10 shares, which at $59.82 is $598 of notional and $6 per 1% move. Netflix split its stock ten-for-one, so charts show a 52-week high of $115 and a close of about $60. I found no input in the code that reads ratings, price targets or upgrades. The label is a name for a direction.
The tape is the worst of the eight. Netflix is down 36.2% on the year, 25.4% in three months, 12.9% in a month and 47.6% below its closing high (its 52-week intraday high was $115.25). It is below its 50-day average ($68.17) and its 200-day average ($80.17), with an RSI of 34, near its 52-week low of $59.41.
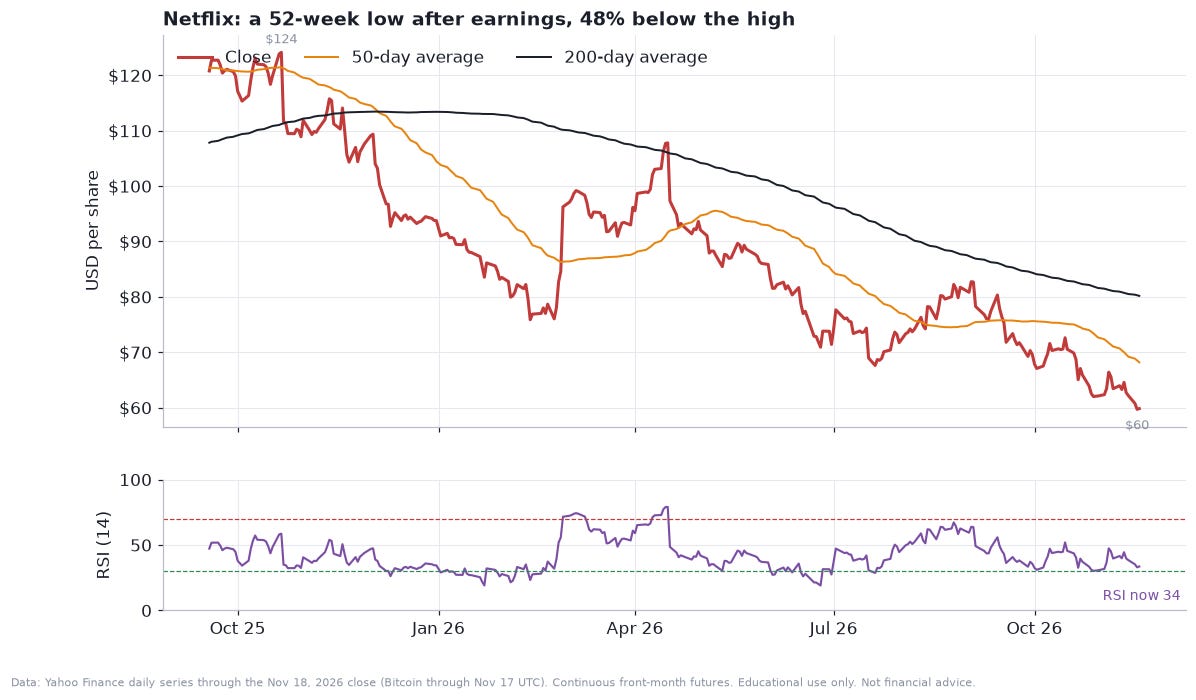
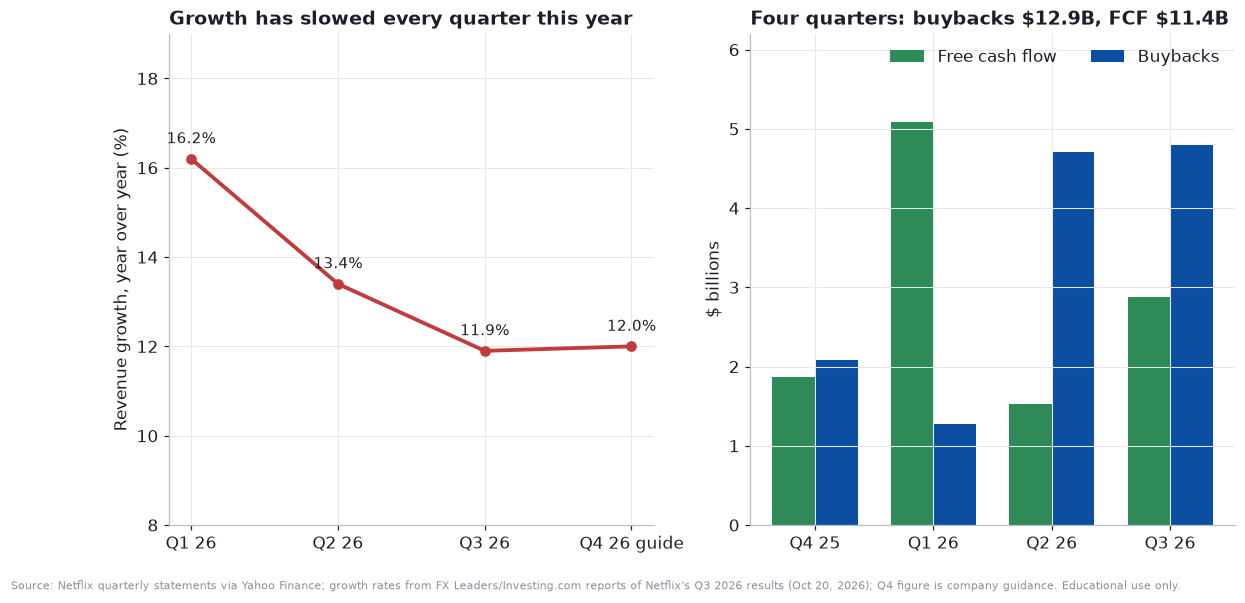
The stock has never recovered from the third-quarter report on October 20, and the facts are mixed. Revenue was $12.87 billion, up about 12%, and earnings per share were $0.87 against $0.59 a year earlier, with an operating margin of 34.6% against 28.2%, part of which management attributed to the timing of expenses. But growth has decelerated every quarter this year, from 16.2% in the first quarter to 13.4% in the second and about 12% in the third. The fourth-quarter guide is $13.4 billion, also about 12% growth, below Wall Street’s $13.7 billion, with a guided operating margin of 26.0% and earnings per share of $0.67. The full-year revenue forecast was trimmed to $51.1 billion and the 2026 advertising forecast cut to $2.7 billion from $3.0 billion, even with advertising revenue growing more than 80%. According to FX Leaders, the average analyst price target is about $85, 42% above the market price, and Jefferies maintained its Buy rating at $85.
The balance sheet has become part of the story. Netflix bought back a record $4.8 billion of stock in the third quarter. Over nine months it spent about $10.8 billion on buybacks against about $9.5 billion of free cash flow, and its cash fell to $8.2 billion from $12.3 billion in March while debt stands at $15.1 billion, or $6.9 billion net of cash. The 2026 free-cash-flow forecast was cut to $12.0 billion from $12.5 billion. In the last four quarters I count $12.9 billion of buybacks against $11.4 billion of free cash flow from the filings. At a price near 17 times earnings, according to EBC Financial, the stock is no longer priced for growth.
The options market sees more risk here than in Apple. Implied volatility is 36.3% in December and 43.8% in February, and the same event-variance arithmetic as above gives an implied earnings-day standard deviation of about 11.6%, more than double Apple’s. Earnings are expected in January (I use January 19 as the estimated date), and the December 18 single-stock expiry arrives first. For a long, the downside scenario is a repeat of October: the stock fell on guidance that came in below consensus. The upside scenario is a short squeeze from the lowest valuation in years. The 22-day modelled range is $51.04 to $70.28 around $59.75, and the fitted model’s persistence of 0.48 is, in effect, saying that the model has little memory and the cone should be read as a rough width.
Like the Apple file, the Netflix file is structurally broken. The consequence for both is that neither can be backtested as shipped, so the only evidence on single-stock futures in this pile is the price history of the underlying stocks.
The portfolio view: eight ideas, one rate shock
Now step back from the single names and look at the book as an equal-notional portfolio of the eight signed positions: short ZN, short 6E, long GC, long MCL, long NG, short MBT, long XAAPL and long XNFLX. This is illustrative, because the bots do not trade equal notional, but it is the cleanest way to ask how the ideas interact.
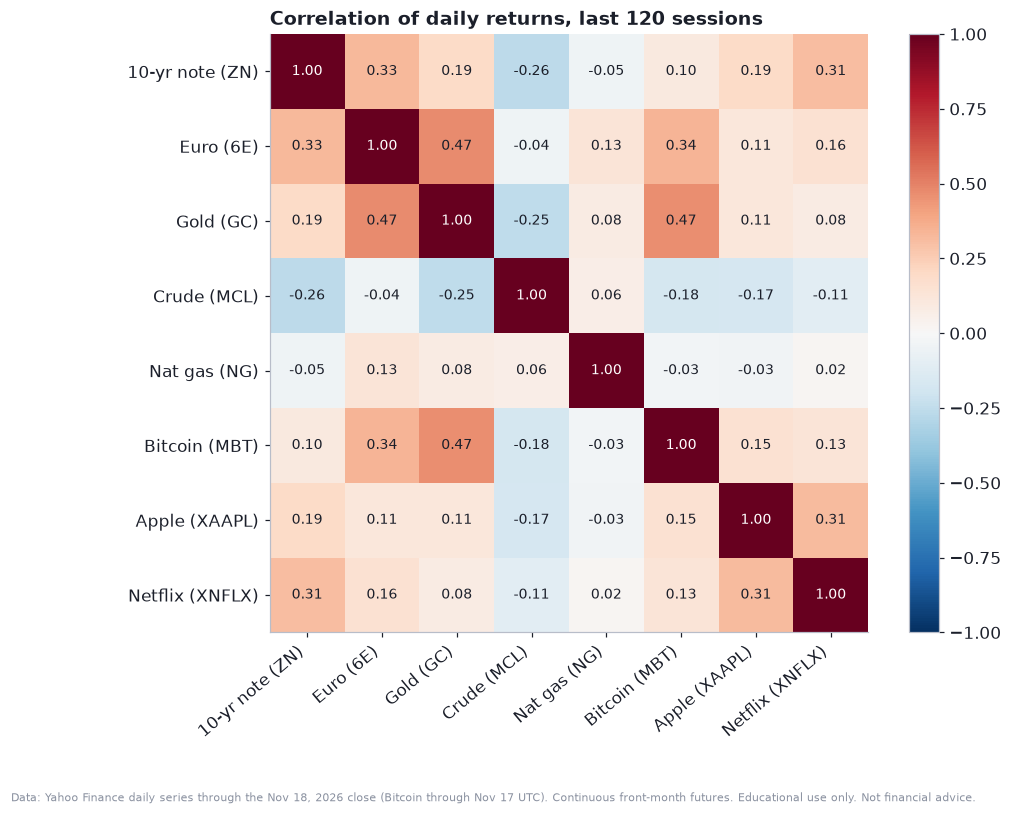
Start with correlation. The unsigned correlations over the last 120 sessions are mostly small. The largest are between the euro and gold (0.47), gold and Bitcoin (0.47), the euro and Bitcoin (0.34), the euro and the 10-year note (0.33), Apple and Netflix (0.31) and the note and Netflix (0.31). Crude is the odd one out, with negative correlations of −0.26 to the note and −0.25 to gold. The key detail is how the signs interact. The book is short the euro and short Bitcoin but long gold, and those three positively correlated assets are held with opposite signs. The short euro and the long gold hedge each other, and so do the short Bitcoin and the long gold. The “hawkish” bots and the “uncertainty” bot are partly cancelling each other.
If I measure it directly, the correlation of the signed euro position with the signed gold position over the last year is −0.39, and the signed Bitcoin and gold positions is −0.21. Then the hawkish-Fed shock should be partly hedged within the book. The problem is that on Wednesday the offset was tiny: the short euro earned about 0.3% while gold lost 2.9%.
Principal-component analysis asks how many independent bets there really are. The covariance matrix Σ is decomposed into eigenvectors V and eigenvalues Λ, and the share of variance explained by component k is its eigenvalue over the total:
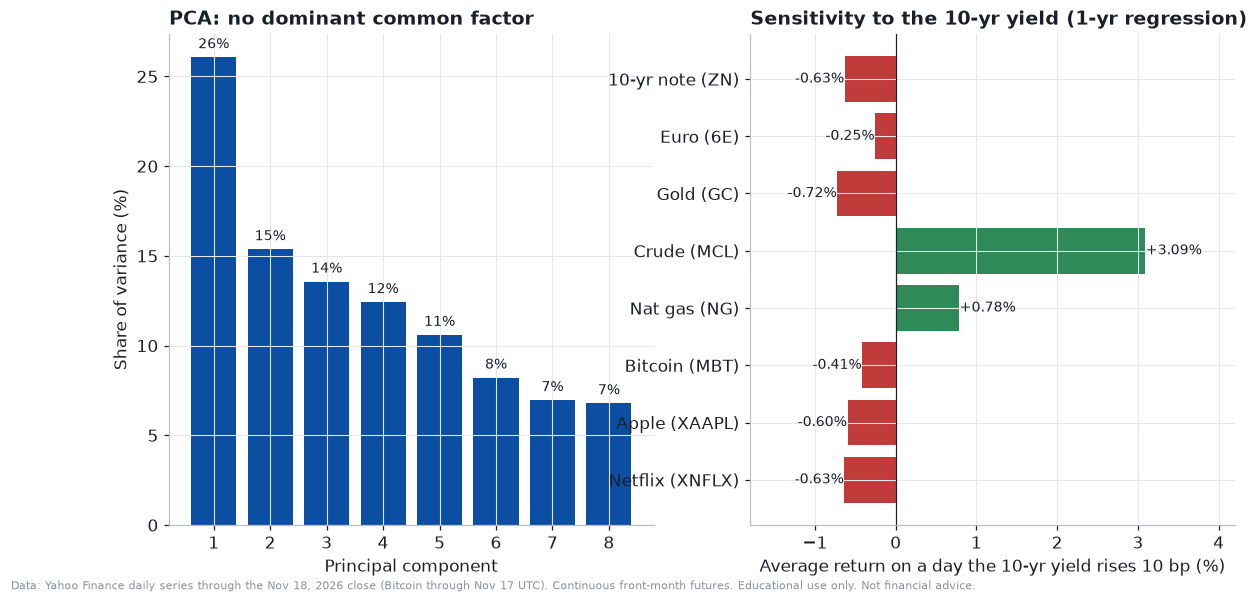
For these eight markets the first component explains 26% of variance, the next two 15% and 14%, and it takes six components to pass 80%. There is no dominant common factor, which for a book that is supposed to be eight views on one catalyst is surprising. The first component loads on the note, the euro and gold in the same direction and on crude in the opposite direction: it is a dollar-and-yields axis. The second is dominated by natural gas. Eight markets really are close to eight bets, which is good for diversification and bad for the idea that one macro view is being expressed.
The right-hand panel of that figure shows how each market reacts to a 10 basis point rise in the 10-year yield, estimated over the past year with the same regression as before:
The note falls 0.63% as expected. Gold falls 0.72%, Netflix 0.63%, Apple 0.60%, Bitcoin 0.41% and the euro 0.25%. Crude, on the other hand, has risen 3.1% per 10 basis points, and natural gas about 0.8%. The crude figure looks absurd, and it is a warning about estimation. In 2026 the oil price spike and the rise in yields happened together, driven by the same geopolitical and inflation story, and a regression on a single year is happy to call that a stable relationship. I would not trade on a beta of +3.1, but it is a reminder that crude has recently been the same bet as the hawkish one, not a diversifier.
The next question is what each position contributes to the risk of the book. With weights w and covariance Σ, the portfolio variance is σ² = w′Σw, and the share contributed by position i is
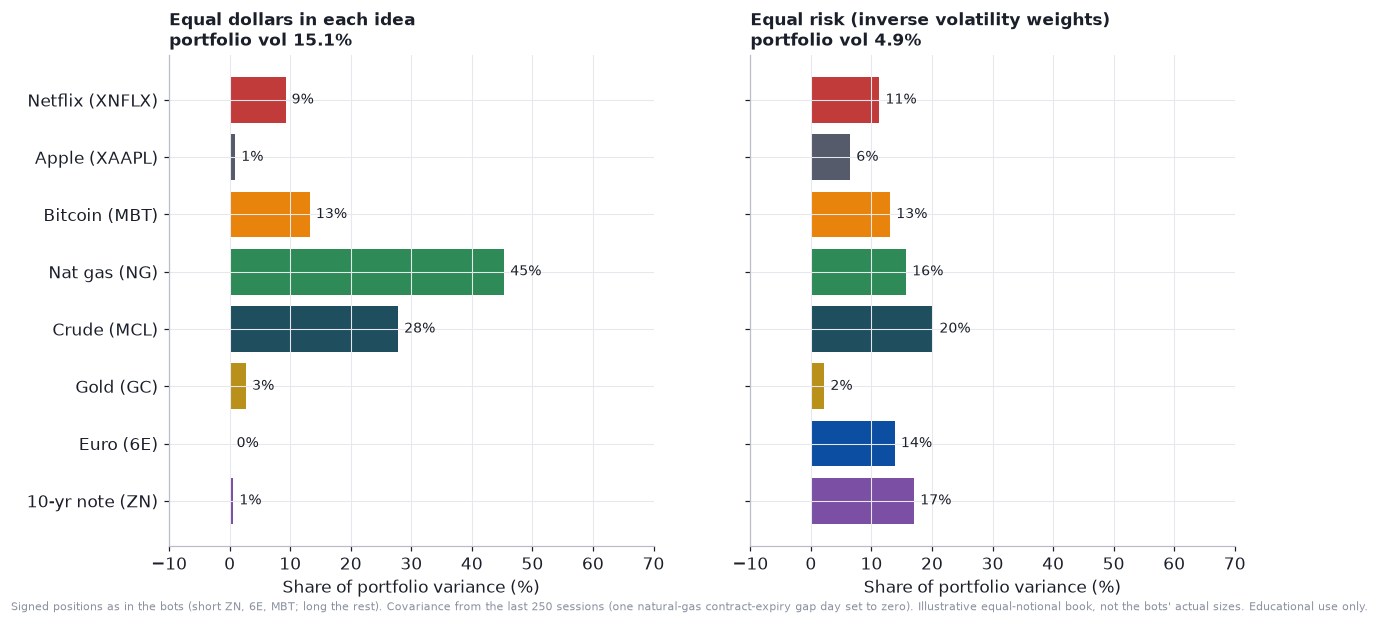
At equal dollar notional in each idea, the portfolio’s volatility is 15.1% a year, and natural gas contributes 45% of the variance, crude 28%, Bitcoin 13% and Netflix 9%. The note, the euro, gold and Apple together contribute about 4%. That is the arithmetic of notional: a $34,000 gas contract has 63% volatility, while a $105,000 note contract has 5%. Equal dollars is equal exposure and very unequal risk. The standard fix is to weight each position inversely to its volatility:
With inverse-volatility weights the contributions become nearly even, between 2% and 20%, and the book’s volatility drops to 4.9%. But the weights are then 39% in the note and 33% in the euro, and only 2% in natural gas, which would be a very different book. The contrast carries a lesson that applies to any bot sized from a dollar risk budget: the choice of contracts and size matters more than the signal.
How bad can a day be? I computed a one-year historical simulation of the signed equal-notional book from 250 daily returns.
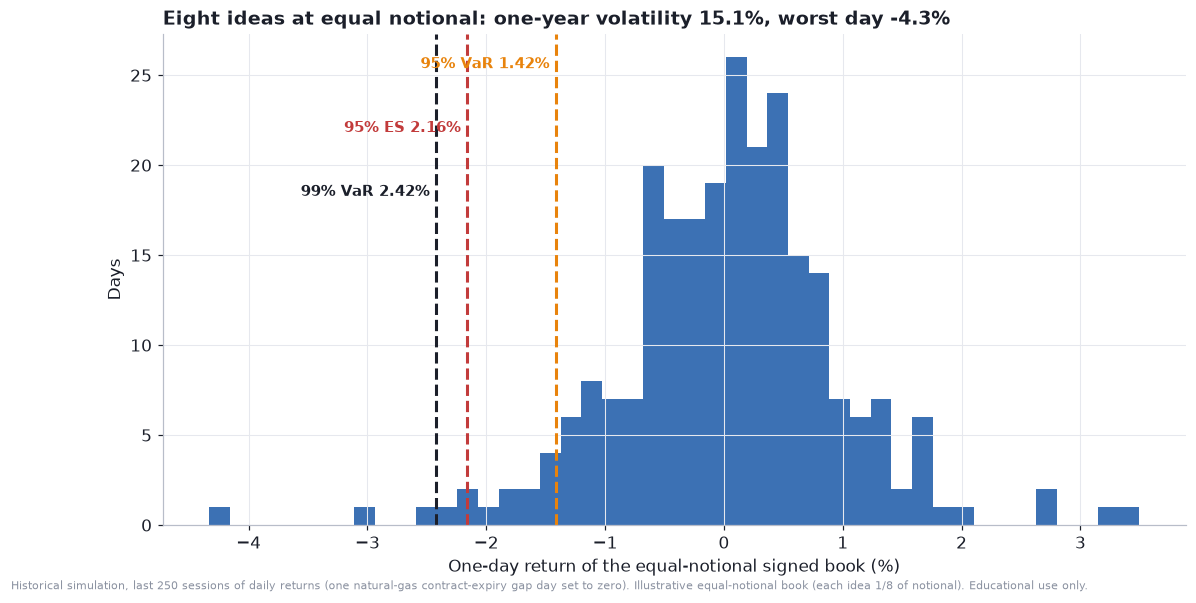
The 95% one-day value at risk is 1.42% of notional, the expected shortfall beyond it is 2.16%, and the 99% value at risk is 2.42%. The worst day was a 4.3% loss and the best a 3.5% gain. On $100,000 of book notional, spread equally, that is a 95% daily loss of about $1,400 and an average tail loss of about $2,200.
Finally, a scenario table. Using the same regressions of each market on the 10-year yield change, the dollar-index return and the S&P 500 return, I applied four hypothetical shocks. These are my illustrative choices. The change in the value of each idea is the sum, over factors, of its beta times the factor shock, signed by the direction of the bot:
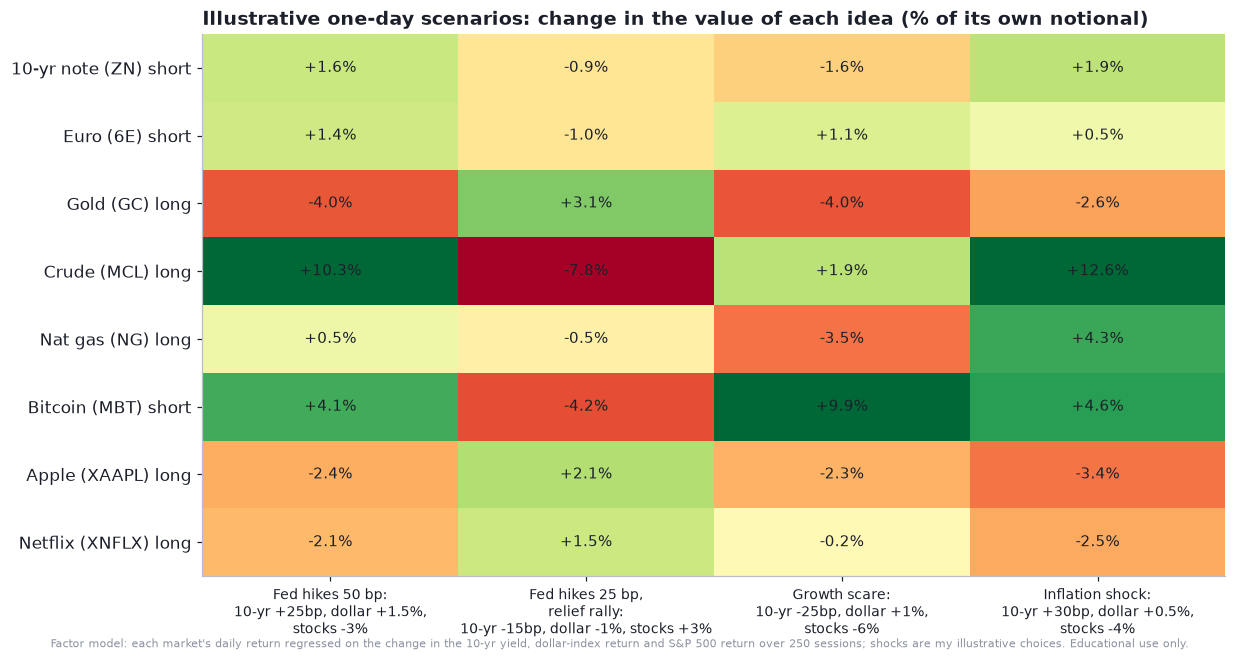
In a 50-basis-point shock, with the 10-year up 25 basis points, the dollar up 1.5% and stocks down 3%, the shorts in the note, the euro and Bitcoin gain (by about 1.6%, 1.4% and 4.1% of their notional), while gold loses 4.0% and Apple and Netflix lose about 2% each. In the opposite case, a 25-basis-point hike with relief, the signs flip and the Bitcoin short loses 4.2% and the gold long gains 3.1%. In a growth scare, with yields down, the dollar up and equities down 6%, the Bitcoin short is the big winner and gold and gas the main losers. The averages are small: the equal-weighted book moves by +1.2%, −1.0%, +0.2% and +1.9% across the four scenarios, and excluding crude, whose regression is the least believable, it moves by less than half a percent in every one. The most useful reading is qualitative: the eight positions are a collection of hedges against each other, with a handful of big single-name bets, rather than a tilt on a single outcome.
The only two backtests, taken apart
Two bots have trades: the note short and the micro crude long. The numbers in the term sheet are simulated and hypothetical, and the document says so. Here is what they claim, followed by what I can check.
The note short made $3,143.97 on 16 trades: 7 winners averaging $1,644 and 9 losers averaging $930, a profit factor of 1.38, a maximum drawdown of $2,506 (16.7% of starting capital), a printed Sharpe ratio of 0.57 and an annualised return of 32.8%. The crude long made $1,620.43 on 38 trades: 16 winners averaging $495 and 22 losers averaging $286, a profit factor of 1.26, a maximum drawdown of $2,068 (34.5% of starting capital), a printed Sharpe of 0.65, six consecutive losses at the worst, and an annualised return of 17.1%. Next to each, the document prints the AI’s own “plan estimate”, which was a Sharpe of 1.6 and 1.7 and win rates of 58% and 55%. The realised win rates of 44% and 42% undershot the plan by 13 to 14 points. The estimates were not a forecast with any statistical content. They were a story.
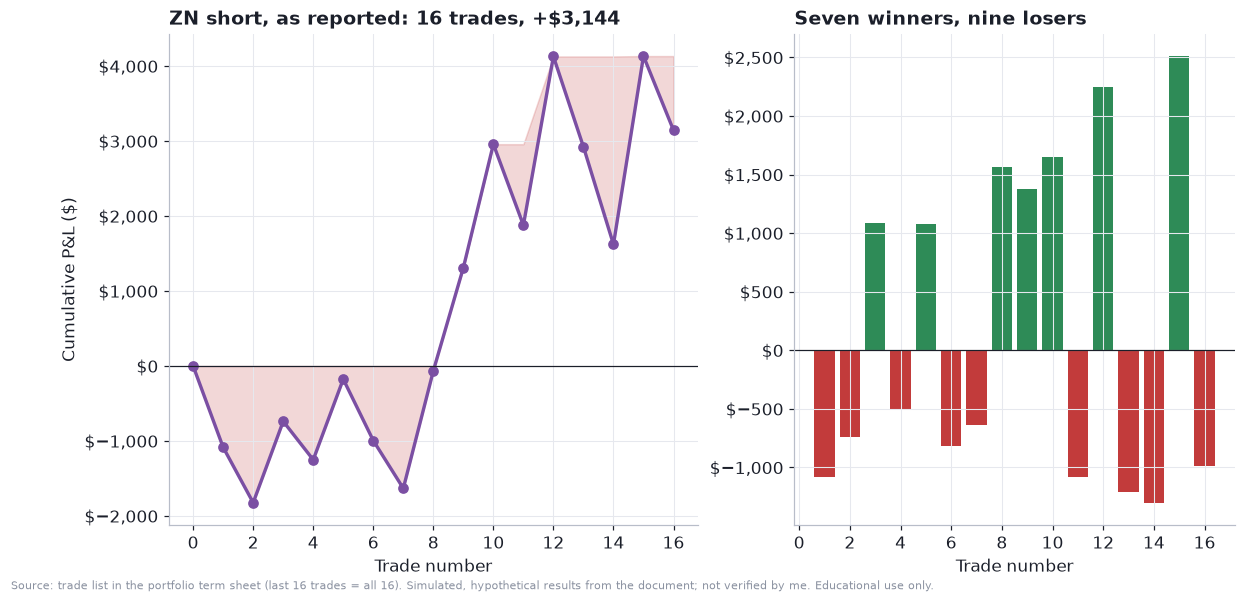
The ZN equity curve has a recognisable shape. The first eight trades netted roughly nothing, with a $1,800 drawdown along the way, and the rest of the profit came in a burst as the note fell from about 108 to about 104 between August and the start of October. That is a trend-following system doing what it is for, in a trend. It says very little about how the system behaves in a sideways market.
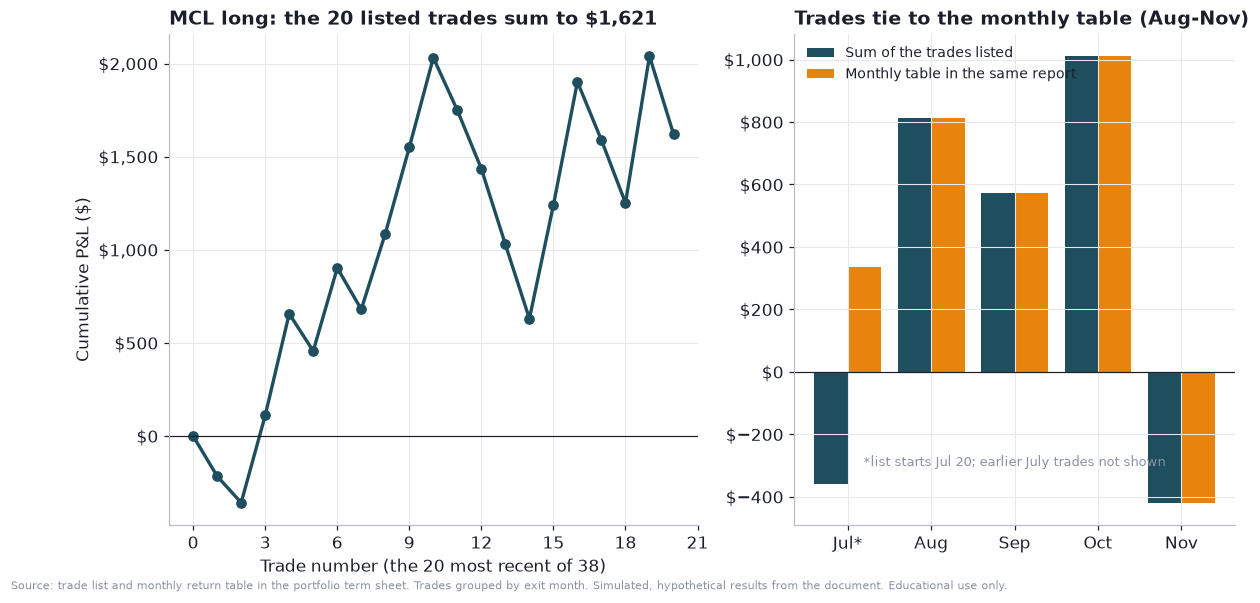
For crude I could do something useful: reconcile the trade list to the monthly return table printed on the next page. The term sheet prints the last 20 of 38 trades. Grouped by exit month, they sum to $814 in August, $572 in September, $1,011 in October and −$419 in November, which match the monthly table to the dollar. July does not match because the list begins on July 20. And the 20 listed trades sum to $1,621.29 against a 38-trade total of $1,620.43, which implies that the first 18 trades netted to about −$1. The document is internally consistent here. That is worth saying, because most of its other claims are not.
Now the ratios. First, the printed “Sharpe” is not a Sharpe ratio. For the note short, the mean trade is $196.50 with a standard deviation of $1,378.32 across 16 trades. The t-statistic of the mean trade is
which is exactly the printed 0.570. The document’s “Sharpe” is a per-trade t-statistic. It is a fair measure of evidence, but it is not annualised and not comparable with the 1.6 “plan estimate” next to it. Second, the printed “Calmar ratio” is total profit divided by maximum drawdown in dollars: $3,144 / $2,506 = 1.255, and $1,620 / $2,068 = 0.784. A Calmar ratio uses annualised return, so the label is wrong. Third, a Sortino ratio of 2.94 beside a Sharpe of 0.57 is a large gap for a system that wins 44% of the time, and suggests a downside-deviation convention that I cannot reproduce. Fourth, the note’s “95% VaR” is printed as 0.0%, which is not a risk measure but an empty cell.
What does a t-statistic of 0.57 mean? Roughly, that the probability of seeing an average this far from zero by luck, if the true mean were zero, is above 50%. The usual hurdle is about 2. The number of trades needed to reach it, at the same ratio of mean to standard deviation, is
For the note, with a ratio of 0.143, that is about 197 trades against the 16 available. For crude, the printed Sharpe of 0.648 over 38 trades implies a ratio of about 0.105 and a requirement of about 360 trades. The document grades the crude backtest “Statistical Confidence: HIGH (38 trades)”. It is not high.
I then asked how uncertain the average trade is by resampling. I drew 20,000 bootstrap samples with replacement from the printed trade P&L values and computed the mean of each:
For the note short the 95% interval for the average trade is −$433 to +$878, and the bootstrap probability that the mean is positive is 71%. For the 20 listed crude trades the interval is −$102 to +$269 and the probability is 80%. Both intervals straddle zero.
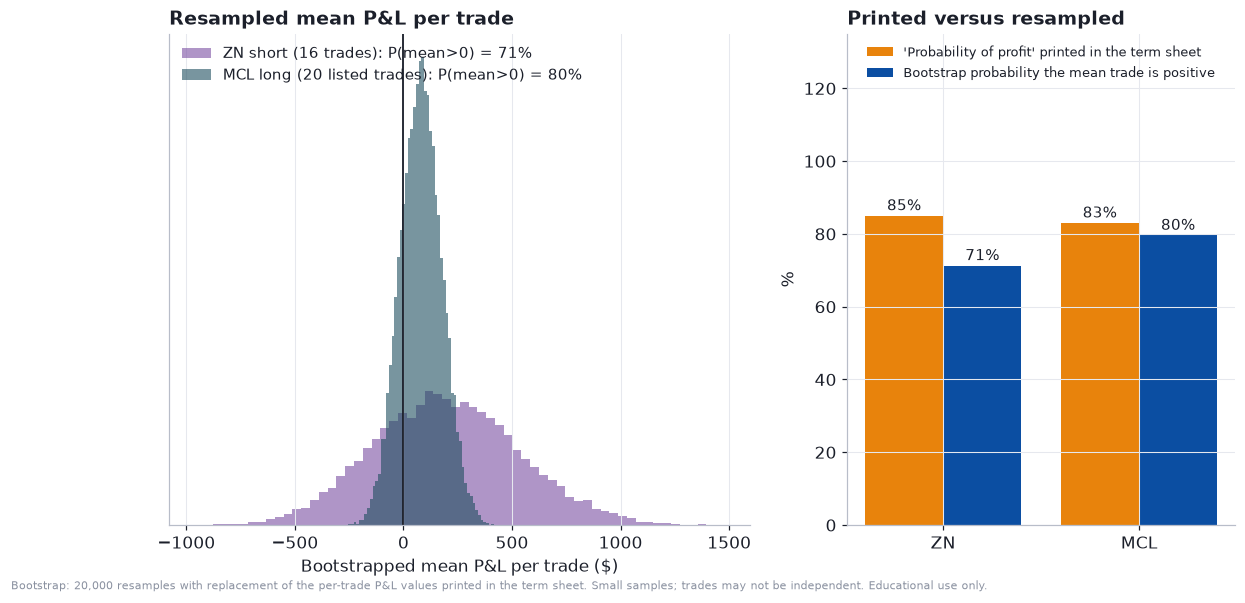
The term sheet prints a “Probability of Profit (Forward-Looking)” of 85% for the note and 83% for crude, “based on backtest win rate, profit factor, and risk metrics”. My resampled figures of 71% and 80% are in the same neighbourhood, but the two numbers answer different questions. Mine says how often a resampled past has a positive average. The document’s claims to describe the future, which a resample of 16 trades cannot do, and the neighbourhood agreement is partly an accident of both being above 50% for a system with a positive average trade.
Two numbers in the document are right, and it is worth saying so. The Kelly fractions are computed correctly from the win rate and payoff ratio. With win probability p and payoff ratio b equal to average win over average loss:
gives 11.9% for the note (p = 0.4375, b = 1.77) and 8.6% for crude (p = 0.421, b = 1.73). And the expectancy per trade is positive in both cases, because the win rate sits above the break-even level:
The break-even win rates are about 36% and 37%, against realised rates of 44% and 42%, so the expectancy is about $196 a trade for the note and $43 for crude. But a Kelly fraction estimated from 16 trades has an error larger than itself, and nobody should size on it.
There is one more check, on the fills. The simulation fills at the midpoint of a bar, which assumes no spread, no slippage and no fees. I compared each trade’s entry price to the continuous front-month closing price on that day. For the note, the entries sit on average 0.25 points below the front-month price, worth about $250 per contract, in a range from 0.71 below to 0.22 above. For crude, they sit on average $7.10 below, in a range from $1.44 to $14.98 below, and always on the same side. A midpoint fill would scatter both sides of the close. A consistent gap on one side is what a different contract month looks like, and it fits the contracts the term sheet names, the December note and the January crude. A crude contract trading as much as $15 under the front month in September, and only $2 to $5 under by October, means the curve was steeply backwardated and then flattened, which is a useful fundamental reading in itself. It is also consistent with the backtest having used the contracts the term sheet names, which is more than the Python files do.
Data-quality audit: what is wrong, in order of how much it matters
The chart below summarises the problems I can document. Red means the problem stops a bot from running or being tested, amber means a figure that is wrong or misleading, and grey means a design limitation.
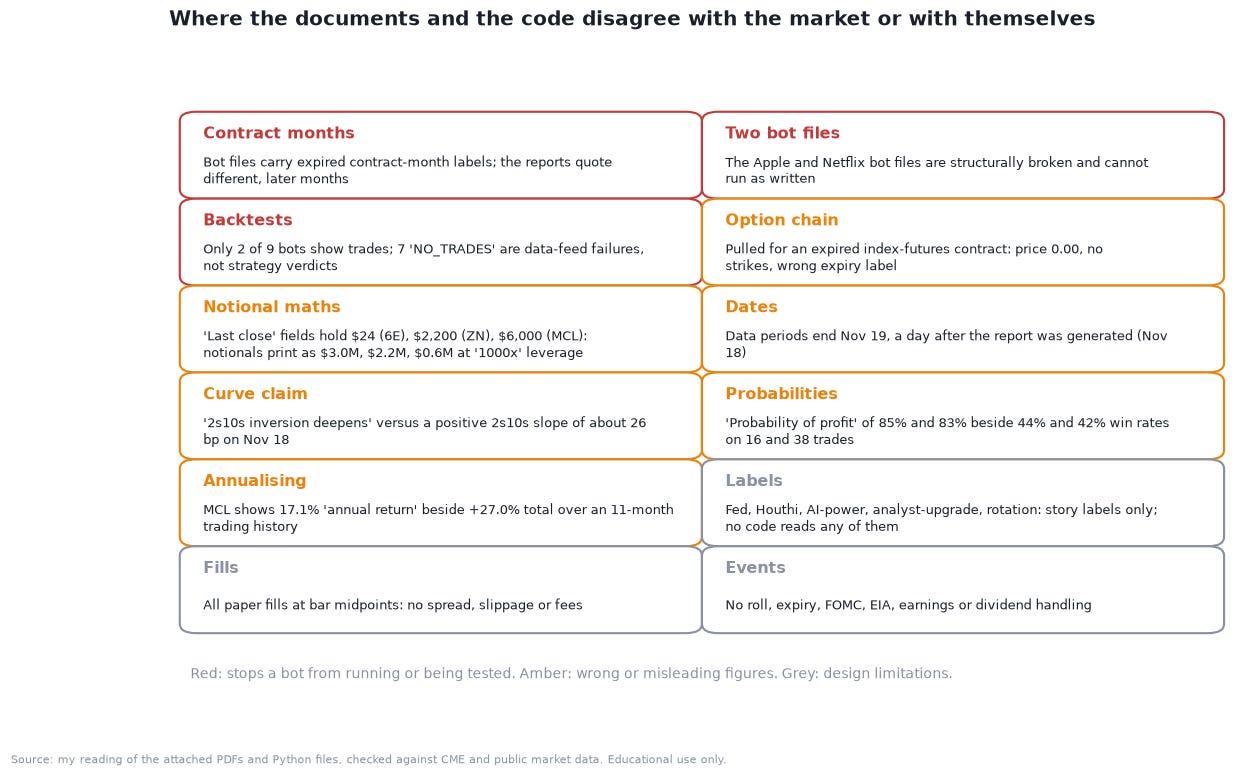
The red items first.
Six of the eight bot files carry a contract-month label that has already expired. By the ticker convention the files use, the euro is the June 2026 contract (6EM6), gold the August contract (GCQ6), Bitcoin the June contract (MBTM6), crude the July contract (MCLN6), natural gas the July contract (NGN26) and the note the September contract (ZNU6). The Apple and Netflix files name no month at all. The labels do not agree with one another either: natural gas uses a two-digit year and the others a single digit. The files register only root symbols (ZN on CBOT, NG on NYMEX and so on) for market data, so the contract actually traded is chosen outside them. I did not have the launcher, and the term sheet shows a front-by-volume lookup that names later months: ZNZ6, 6EZ6, MCLF7. The upshot is that the files and the documents describe different instruments, and nothing in any file pins down the contract or handles the roll.
The Apple and Netflix files are structurally broken, with the body of the class cut off after its constructor so that the methods that do the work sit outside it. I would not run them as shipped. The term sheet’s NO_TRADES verdict on all seven bots without backtests is a data failure, not a verdict: the pages show “permission denied” and “login failed” errors from the data feed, and the Nvidia contract was blocked because it was on a not-entitled list. A system that writes “entry conditions were never triggered” on a day when it received no data is reporting a hypothesis, not an observation.
The amber items are the figures I can show are wrong or misleading:
The “last close” fields on the contract pages show $24 for the euro, $2,200 for the note and $6,000 for crude, which are margin or capital amounts, not prices. The resulting “contract notional” of $3.0 million, $2.2 million and $0.6 million at “1,000x leverage” is meaningless. The real notional values are $137,000, $106,000 and $8,000, as the chart earlier showed.
The options document analyses ESM26, an expired S&P 500 futures contract, with a futures price of 0.00, zero strikes and a December expiry label, and then recommends using it “as a vol regime indicator” for the note.
The data periods end on November 19, a day after the documents were generated.
The “2s10s inversion deepens” line is contradicted by a positive 2s10s slope of about 26 basis points.
The 85% and 83% probabilities of profit, the “HIGH” confidence label and the Calmar and Sharpe definitions are discussed above.
The ZN page says the data connection failed and “plan metrics” were used, but reports “actual results” beneath it. I cannot tell where those 16 trades came from.
Allocations disagree: $132,000 of capital in the workbook, $50,000 in the rules reference.
The grey items are design limitations rather than errors: bar-midpoint fills, no reading of the Fed, inventories, storage, flows, ratings or earnings, and no handling of rolls, first-notice dates, scheduled events or single-stock-futures mechanics. And the report that generated the ideas was told to use institutional futures only and no single stocks, yet two of the eight bots are single-stock futures.
What would I change, in generic terms, before trusting any of this? A short list, in the form of rules rather than code:
IF the data feed is missing or stale, THEN report “data unavailable” and stop, never “no trades”.
Resolve the contract from the calendar, rather than hard-coding a month, and roll a set number of sessions before the first notice or last trade date.
On a scheduled event day for the bot’s market (a Fed decision, an inventory report, earnings), halve the size or stand aside.
Charge each fill half a spread plus a slippage allowance plus fees, and report results before and after.
Compute the Sharpe ratio from period returns, annualise it, and report a confidence interval, not a grade.
Require a few hundred trades or a walk-forward test on data the system never saw before calling anything “high confidence”.
If a macro thesis is stated, make it testable: attach it to one observable variable and test whether the bot’s edge disappears when that variable changes.
The calendar: what can break this book before year-end
Because the bots have no calendar, the reader needs one. The next six weeks contain more events than the bots’ backtest windows contained in total.
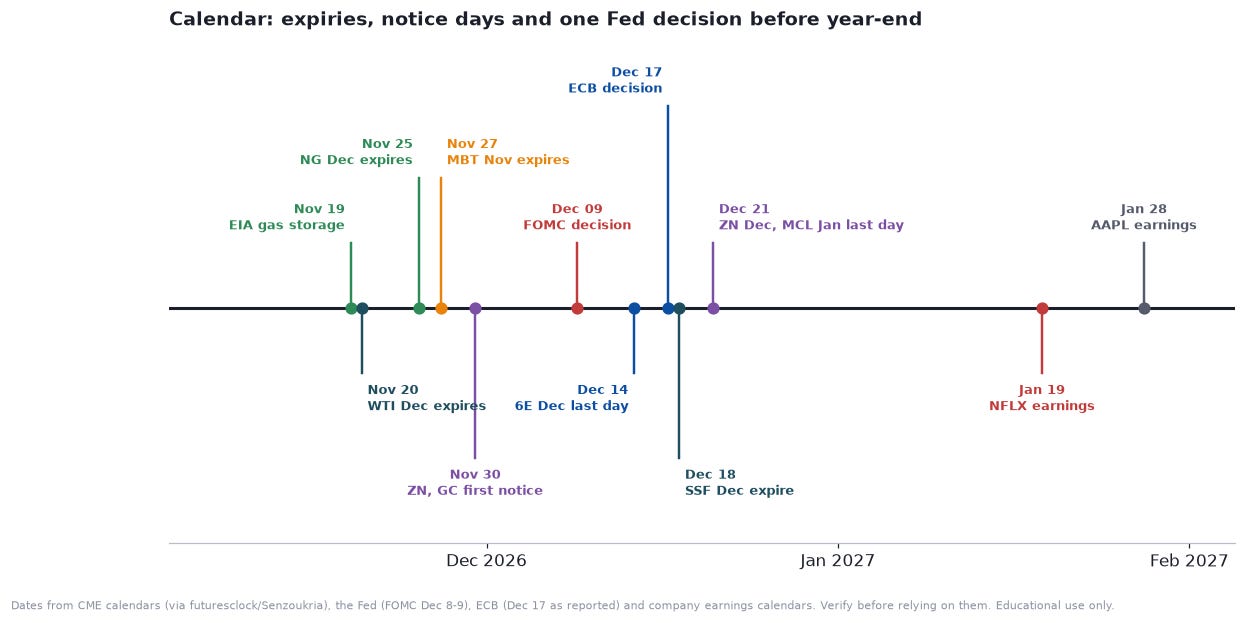
On Thursday, November 19 the EIA publishes natural gas storage, the number that matters most to the gas long this week. The December WTI contract expires on Friday, November 20 and December natural gas (NGZ26) on Wednesday, November 25. Thursday, November 26 is the US Thanksgiving holiday, with thin liquidity around it, and the November micro Bitcoin contract expires the next day. Monday, November 30 is first notice day for December 10-year note and gold futures, the day by which anyone who does not intend to take delivery should already have rolled. The FOMC decision is on Wednesday, December 9, with the Waller-flagged half-point hike as the tail. The December euro future’s last trading day is Monday, December 14 and the ECB decides on Thursday, December 17. The December single-stock futures expire on Friday, December 18, and on Monday, December 21 the December note and January micro crude contracts reach their last trading day. Netflix reports in January (estimated for the 19th) and Apple on or about January 28. Dates come from CME calendars, the Fed, the ECB and company calendars, and should be checked before anyone relies on them.
The mapping to the bots is uncomfortable. The euro and Bitcoin shorts are the two bots for which the hawkish tail is a gift. Gold and crude are long into a rate decision with the tape against them. The note short has a notice day before the decision, the gas long an expiry and a storage report before anything else, and the two single-stock bots expire before their earnings.
The verdict, in one paragraph per idea
Note short: the right instrument for the wrong version of the story. The yield explains 95% of the contract’s variance and the market has priced the small hike, not the large one. Mind November 30. Euro short: the cleanest tape, with one factor, the dollar, explaining 90% of it. Gold long: a thesis that contradicts itself, with the tape against it. Crude long: a premium that the physical balance stopped paying for. Gas long: right for the wrong reason, with a seasonal claim that 25 years of data reject. Bitcoin short: the winning trade, now oversold, with the highest correlation to equities in the book. Apple long: strong and expensive, with an earnings event worth about 5.5%. Netflix long: cheap on earnings, expensive on trust, with an event worth about 11.6%.
For the system as a whole, the most defensible statement is the plainest one: eight bots were written from one news feed, two of them have a short, small backtest whose own numbers cannot distinguish skill from luck, six cannot be tested at all in the form attached, and none of them knows what day it is. Parts of the thesis have been right this month. That is not the same as an edge.
Sources: price data from Yahoo Finance through the November 18, 2026 close (Bitcoin through November 17); market reports from CNBC, Investing.com, Kitco, FXStreet, FX Leaders, EBC Financial, CoinDesk, Cointelegraph, Euronext and AGBI, as cited in the text; contract specifications from CME Group. All figures not attributed to a source were computed by me. This is educational analysis, not investment advice. Simulated and hypothetical results from the documents are not evidence of future results.