


Educational analysis only. This is not financial advice, a recommendation or an offer to trade anything. Every price, probability and payoff below is either sourced to a named outlet or filing, computed by me from public Yahoo Finance data, or labelled illustrative. Stocks, futures and options can lose money, and futures and options can lose more than you put in.
Tuesday, November 17, 2026: a clean beat, a double-digit growth promise, and a stock that gave back its gains by the close
Walt Disney (NYSE: DIS) closed Tuesday at $116.94, according to Yahoo Finance, down 1.5% on the day it reported fiscal fourth-quarter results. The path matters more than the number. The stock opened at $118.26 and ran to $122.72, a new 52-week intraday high and 3.4% above Monday’s close. It then gave all of that back and closed within a dollar of the day’s low, on 20.3 million shares, about 2.4 times its recent average volume. A good print, a raised dividend, a promise of double-digit earnings growth, and the market’s answer was to sell the rally.
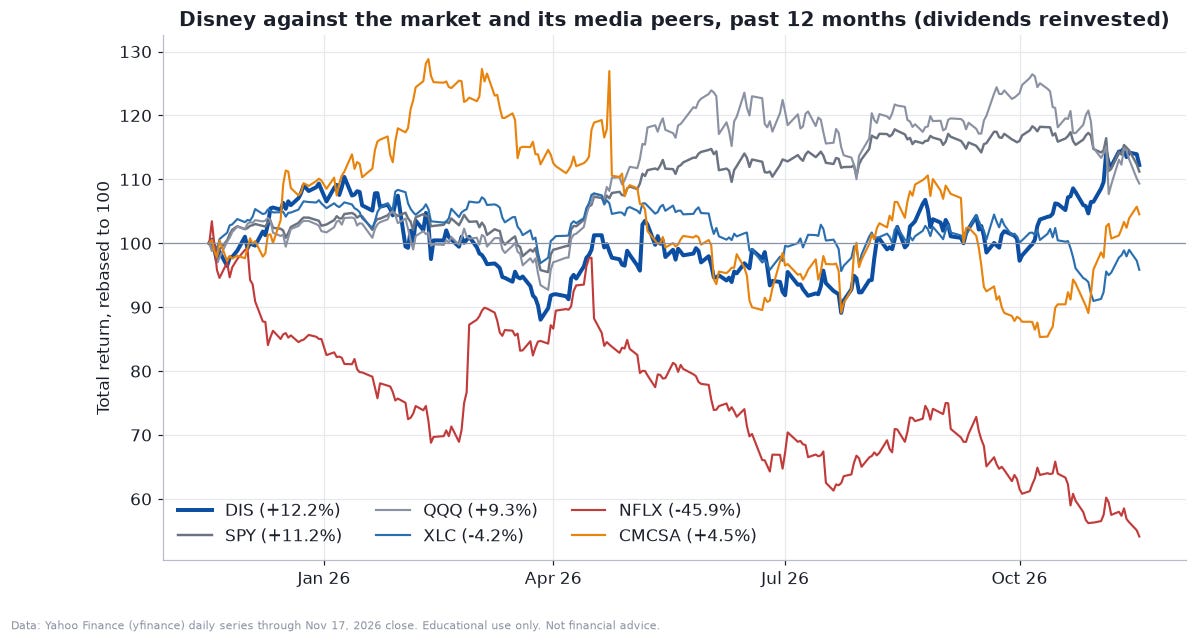
Here is where that leaves the stock. It is 2.3% below its 52-week closing high of $119.65 (November 11), 26.5% above its closing low of $92.42 (March 27), and 2.8% above where the year began ($113.77 on December 31, 2025). Counting reinvested dividends it is up 12.1% over twelve months, against 10.2% for the S&P 500 (SPY) and a loss of 4.3% for the communication services sector fund (XLC). Over the past month it has gained 6.7% while SPY fell 4.4% and the Nasdaq-100 (QQQ) fell 8.5%. That is a defensive pattern in a nervous tape: the VIX closed at 25.5 and the ten-year Treasury yield at 5.10%. And it is a stock that has still gone nowhere in the long run. Disney closed at $201.91 in March 2021, so today’s price is 42% below that peak, and five-year total return is minus 31%, against plus 68% for the S&P 500.
Three things collide in the next few weeks. First, the business: on Tuesday morning Disney reported fiscal fourth-quarter revenue up 16% to $25.9 billion, adjusted earnings per share of $1.77 against about $1.67 expected, and a record year for its parks and cruise business. It guided to double-digit adjusted earnings growth in fiscal 2027, roughly $11 billion of free cash flow, about $9 billion of buybacks, and a 33% increase in the dividend to $2.00 a share. Second, the quality of the quarter: a 53rd week flattered every comparison, Hong Kong and Shanghai are getting worse, streaming advertising prices fell, and Disney announced it will stop disclosing streaming operating income, the number bulls have leaned on for two years. Third, the calendar: a $1.00 dividend goes ex around December 16, Marvel’s “Avengers: Doomsday” opens on December 18, which is also the day the December futures contract stops trading, and the next report is expected in February.
This article does four jobs. It walks through the quarter and the businesses behind it. It values the stock three ways: a reverse discounted cash flow, a sum of the parts, and a multiples cross-check. It lays out the quant picture, meaning return distributions, volatility, betas, a Monte Carlo simulation, value at risk and what the options market is saying. And it reviews a trading bot that someone sent me, a long-only Disney futures script, which I describe in concept only. The bot’s settings are a trade secret, so you will not find a parameter, a threshold or a line of its code here, and nothing in this piece should be read as a hint at them. What I can say is where the bot’s idea fits Disney and where it does not, and there is one problem with it that comes before any of that.
What “XDIS0” actually is
Start with the name, because for Amazon last week the symbol checked out and here it does not. The bot trades the symbol XDIS0 on the CME exchange, and it registers itself with its trader’s bot registry as “XDIS0:CME”. The file’s name for the strategy is “Disney Margin Expansion Momentum Long (Paper).”
CME Group launched single stock futures on July 27, 2026. According to CME’s Special Executive Report 9974R (dated July 16, 2026), the launch included 55 standard single stock futures and 22 Micro single stock futures. Disney is on the first list. The standard contract’s code is SDIS0, with a companion block-trade contract coded TDIS0. It covers 100 shares and moves in 0.01-point steps worth $1.00. It is financially settled, lists two quarterly months at a time, and stops trading at 4:00 p.m. Eastern on the third Friday of the contract month, which makes the current December contract’s last day Friday, December 18, 2026.
Disney is not on the second list. The 22 Micro contracts, each covering 10 shares with a 0.01-point step worth $0.10, include Amazon (XAMZN), Netflix (XNFLX), Walmart (XWMT0), Tesla, Microsoft, Nvidia and a handful of others. There is no Micro Disney in CME’s report, and a second source, a futures broker’s contract list that mirrors CME’s, shows the same: Disney has a standard contract and no micro. The code XDIS0 follows the exchange’s naming pattern (an X for micro, the company’s letters, padded with a zero), which is probably how it came to be written, but it is not a listed product as of the report I read.
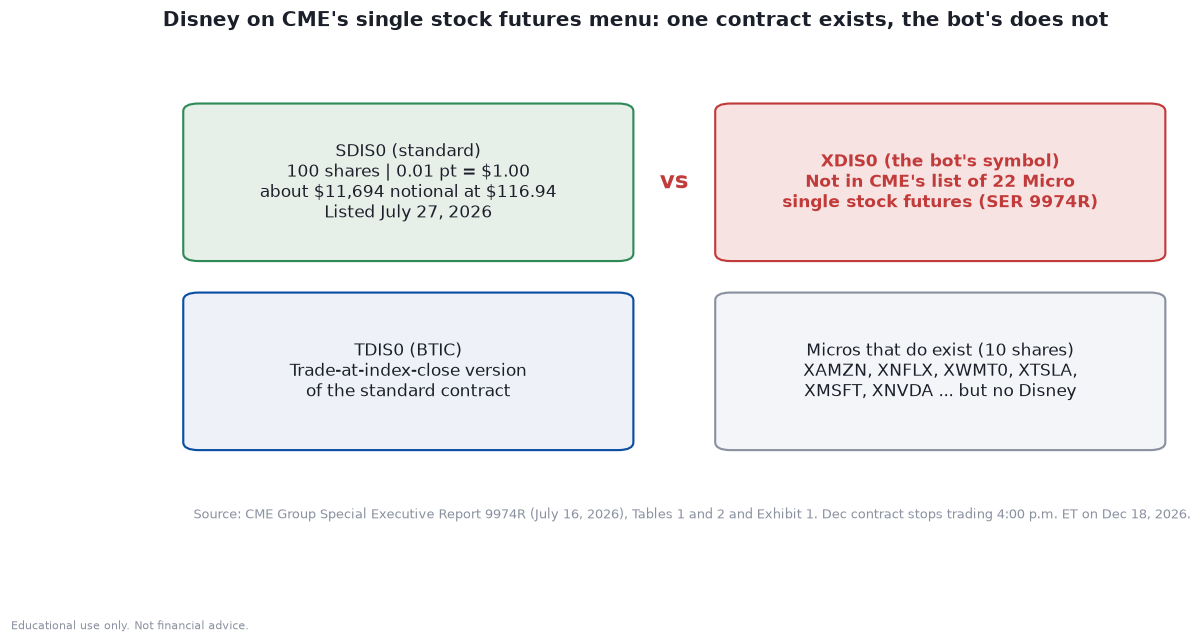
That is a practical problem, not a technicality. A bot that asks its data feed for a symbol that does not exist receives nothing, and a bot that receives nothing does nothing. Everything it does is gated on matching ticks. I cannot see the feed, so I cannot tell whether it is silent, whether the trader mapped the symbol to something else, or whether it is wired to the standard contract under a different name. I can say what the right contract would look like. At $116.94, one standard SDIS0 controls $11,694 of Disney stock, ten times the notional of a hypothetical micro, and each dollar of price movement is $100 per contract. The bot’s dollar-per-point assumption is the 10-share micro’s. If someone pointed it at the standard contract without changing that assumption, its idea of the dollar risk in every trade would be a tenth of the truth, and everything built on that idea, including position size, would be wrong by a factor of ten. I come back to this with numbers in the section on the contract’s arithmetic.
Disney also pays a dividend, which makes the futures price slightly more involved than it was for Amazon. Fair value for a dividend-paying stock is the spot price less the present value of the dividends before expiry, grown at the interest rate:
Here $S_0$ is the spot price, $D$ the dividend, $t_D$ the time to the ex-dividend date, $r$ the short-term interest rate and $T$ the time to expiry. With the 13-week Treasury bill at 4.14%, the $1.00 dividend whose record date is December 16 (under one-day settlement the ex-date should be the same day, though I have not confirmed it with Disney), and 31 days to the December 18 expiry, fair value comes to about $116.35, which is 59 cents below the spot price. Without the dividend it would be $117.35. The difference, $1.00 per share or $100 per standard contract, shows up as a mechanical drop in the futures price around the ex-date that has nothing to do with news. A bot that only sees prices will read it as a loss.
What the bot does, in plain words
I read the whole script. Here is what it is built to do, with no parameters.
Name and thesis. The bot is called “XDIS0 Micro SSF Disney Margin Expansion Long.” Its strategy label is “Disney Margin Expansion Momentum Long (Paper).” Read literally, the idea is to buy Disney while its profit margins are expanding, and to ride momentum. I come back to this label, because the margin half of it has no code behind it.
Direction. Long only. It never goes short and has no logic for it. Unlike the Amazon file I reviewed last week, this one is structurally sound: every method sits inside the class where it belongs, so there is no indentation problem to worry about.
Regime. There is no explicit market-regime detector. The closest thing is a volatility gauge, built from the bot’s own bars, that widens stops and trims size when ranges expand, and a set of gates that stand aside when conditions look poor. The gauge is described in the code as a stand-in for the VIX, but it does not read the VIX. It is computed from the bot’s own price bars.
Signals. On each completed bar, the bot turns a handful of standard trend, momentum, volume and breakout readings into one combined score. To enter, the score has to clear a bar that moves a little with recent volatility, and price has to sit above a slower trend line. The weights are a trade secret and I do not show them. The file also leans on helper functions supplied by the parent trading framework, for warm-up checks, spread and staleness gates, a momentum state and a size scale, and those are not in the file, so I cannot audit them.
Risk management. This is where most of the code lives. Before any entry the bot checks that the bid-ask spread is acceptable against its own recent history, that market data is fresh, that it is not in an exchange maintenance window, that daily and weekly loss limits, a losing-streak breaker and an account-level drawdown breaker have not tripped, and that it is not already in a position. If everything passes:
The stop distance is a volatility-based multiple of average true range (ATR), and the multiple widens when the volatility gauge says conditions are rough.
The profit target is a multiple of the stop distance, and that multiple adapts to the bot’s own recent record.
Position size is a risk budget divided by the dollar value of the stop distance, scaled down further when volatility is high or when the framework’s size scale says to, then capped by a margin-based ceiling and a hard maximum.
Once in a trade, a trailing stop only ever tightens, and profits are taken in stages at multiples of the initial risk.
Exits come from the stop, the trailing stop, the staged targets, a “thesis check” (the trend or momentum rolling over), or a time limit that scales with volatility.
It runs as a simulation. Entries and exits are logged at the midpoint of the latest bar’s range, and profit and loss are tracked internally. Here is the logic as concept-level pseudocode.
on each completed bar:
    technical = weighted_sum(trend, momentum, volume, breakout readings)
    bar       = adaptive_bar(recent_volatility)
    if flat and technical >= bar and price > slow_trend_line:
        if gates_pass(spread_ok, data_fresh, session_ok, loss_limits_ok, drawdown_ok):
            stop_distance = volatility_multiple * ATR
            target        = reward_ratio * stop_distance
            size          = min(size_ceiling, risk_budget / dollar_value(stop_distance) * stress_factors)
            buy(size, stop = entry - stop_distance)

while long, on each update:
    trailing_stop = tighten_only(trailing_stop, high_water_mark - scaled_ATR)
    take profits in stages at multiples of the initial risk
    exit on: stop | trailing_stop | staged_targets | thesis_check_fails | time_limit
on each tick while long:
    exit if price <= stop or price <= trailing_stop
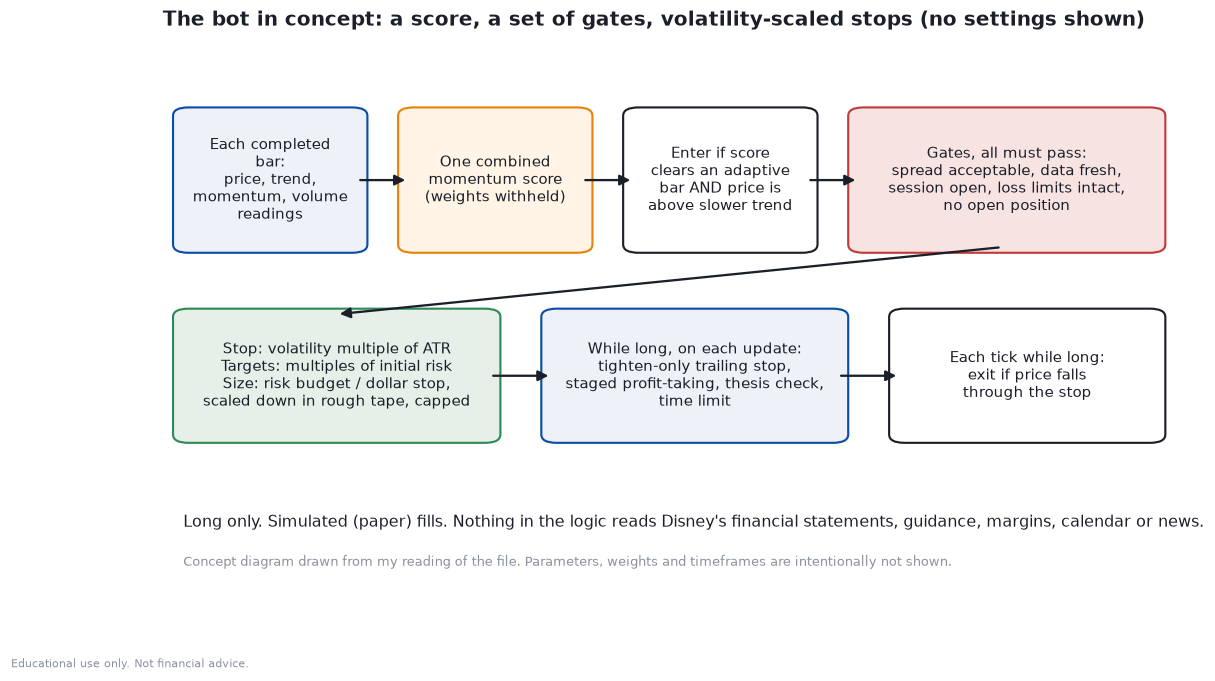
In one sentence: it is a tidy, long-only momentum bot that carries a margin-expansion label. Later I return to where it fits Disney and where it does not, and to a list of smaller issues in the file. First, the thing it never looks at: the company.
Fundamentals, part one: the fourth-quarter print
Disney’s fiscal year ends on the Saturday nearest September 30, so “fourth quarter” here means the thirteen-plus weeks ended October 3, 2026. This year had 53 weeks, and the extra week landed in the fourth quarter. That single fact colors every number below. All figures come from the company’s November 17 shareholder letter and earnings release unless I say otherwise.
The headline results were strong. Revenue rose 16% to $25.9 billion from $22.5 billion, ahead of the $25.2 billion that LSEG’s survey expected, as reported by CNBC. Total segment operating income, the profit measure management uses across its three businesses, rose 43% to $4.97 billion from $3.48 billion, ahead of the company’s own guidance of about $4.9 billion. Adjusted earnings per share were $1.77 against $1.11 a year earlier and about $1.67 expected. GAAP earnings per share, which include restructuring and impairment charges, were $1.51 against $0.73. For the full year, revenue was $102.3 billion (up 8%), segment operating income $19.7 billion (up 12%), adjusted EPS $7.02 (up 18%) and GAAP EPS $5.63 (down 18%, because the prior year had a large tax benefit).
Now strip out the extra week. Disney estimates it added about $1.63 billion of revenue, $490 million of segment operating income and $0.17 of adjusted EPS to the year, all of it in the fourth quarter. Growth excluding it is simply the reported figures with the extra week’s contribution $X_{53}$ removed from the current period:
Apply it to the fourth quarter. Revenue growth falls from 15.5% to 8.2%. Segment operating income growth falls from 43% to about 29%. Adjusted EPS of $1.77 becomes $1.60, still a 44% gain on $1.11, though that comparison is against an unusually weak prior-year quarter. For the full year, segment operating income grows about 10% and adjusted EPS about 16%, which is what management says: “approximately 10% total segment operating income growth and 16% adjusted EPS growth, excluding the 53rd week.” The company says it exceeded its own full-year adjusted EPS guidance, so the underlying beat is real. It is also smaller than the headline.
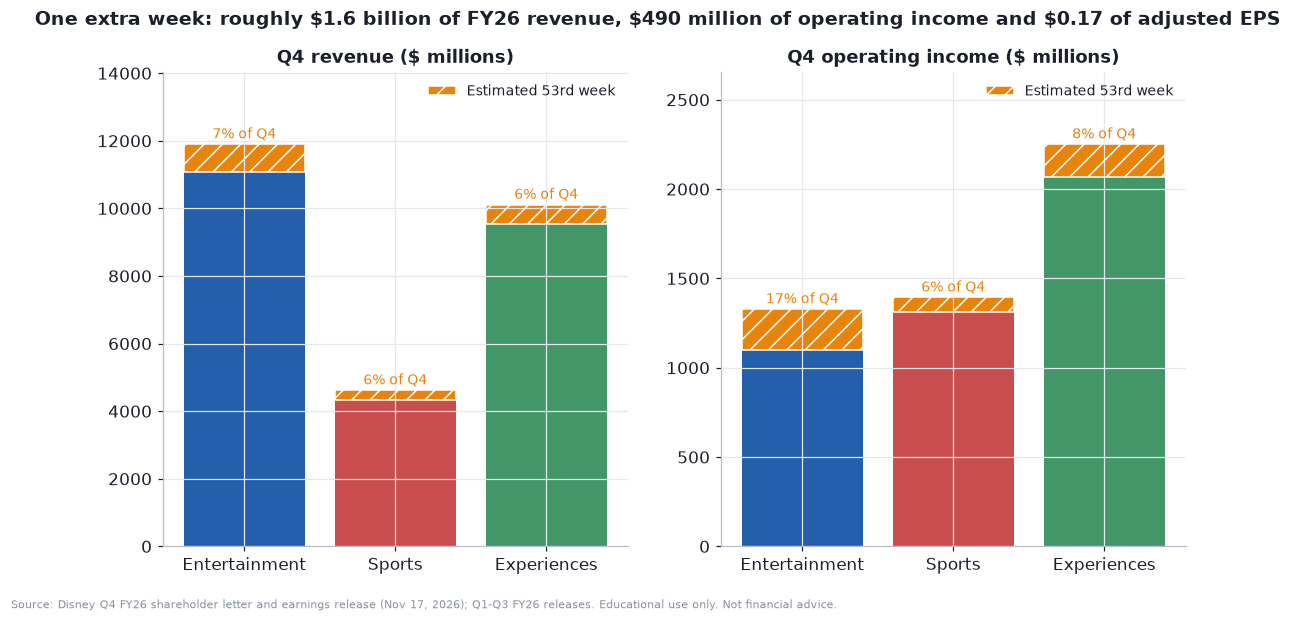
Here is how the pieces fit by segment. Disney reports three: Entertainment (the studios, broadcast and cable networks and streaming), Sports (ESPN) and Experiences (parks, cruises, resorts and, for now, consumer products). For the full fiscal year, Experiences earned $11.19 billion of the $19.73 billion total, or 57%, on $39.6 billion of revenue. Entertainment earned $5.44 billion on $46.6 billion of revenue and Sports $3.09 billion on $18.6 billion. A segment’s operating margin is its operating income over its revenue, and the share of the company’s profit it supplies is its weight in the total:
By that arithmetic Experiences has a full-year margin of 28.3% and a 57% weight, Sports a margin of 16.6% and a 16% weight, and Entertainment a margin of 11.7% and a 28% weight. A quarter in which the parks do well is a quarter in which Disney does well, and the market has priced the company accordingly.
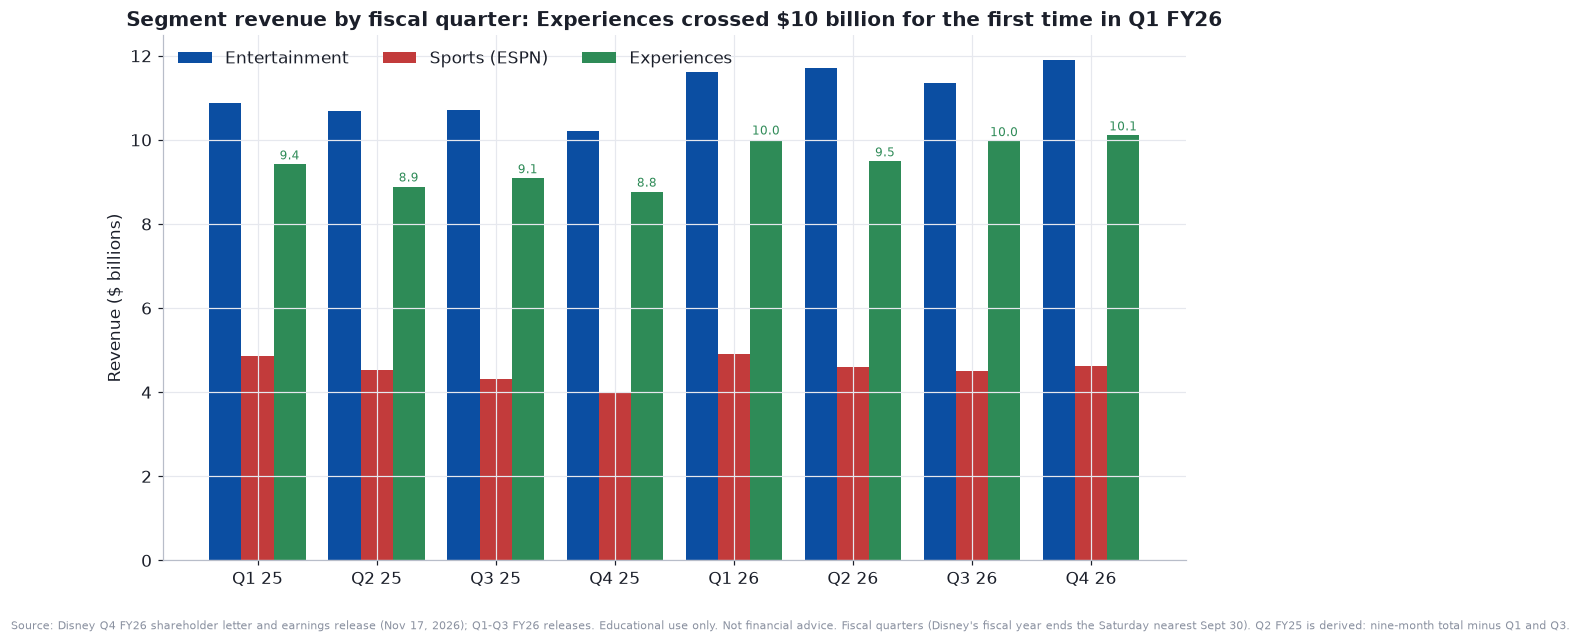
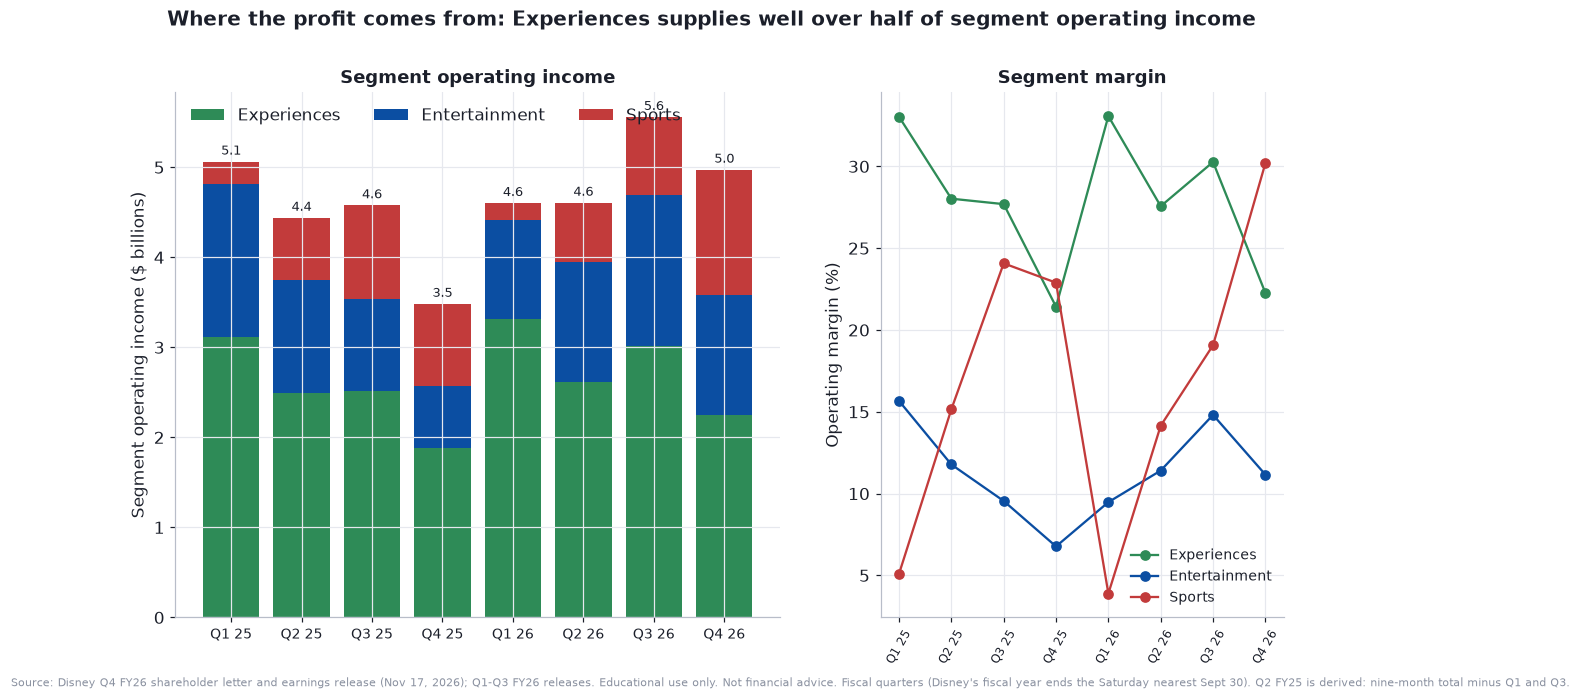
The eight-quarter view shows a pattern worth remembering. Experiences is steady and large. Entertainment is lumpy, because it absorbs the cost of film releases and programming in the quarters they land. Sports swings with the calendar and rights costs: it earned $191 million in the first quarter of fiscal 2026, when a two-week carriage dispute with YouTube TV cost it about $110 million, and $1.39 billion in the fourth quarter. A company with that much lumpiness reports numbers that look better or worse mostly depending on which quarter you compare. Management knows it, and said so in the letter: “we believe our business is best assessed on an annual basis.”
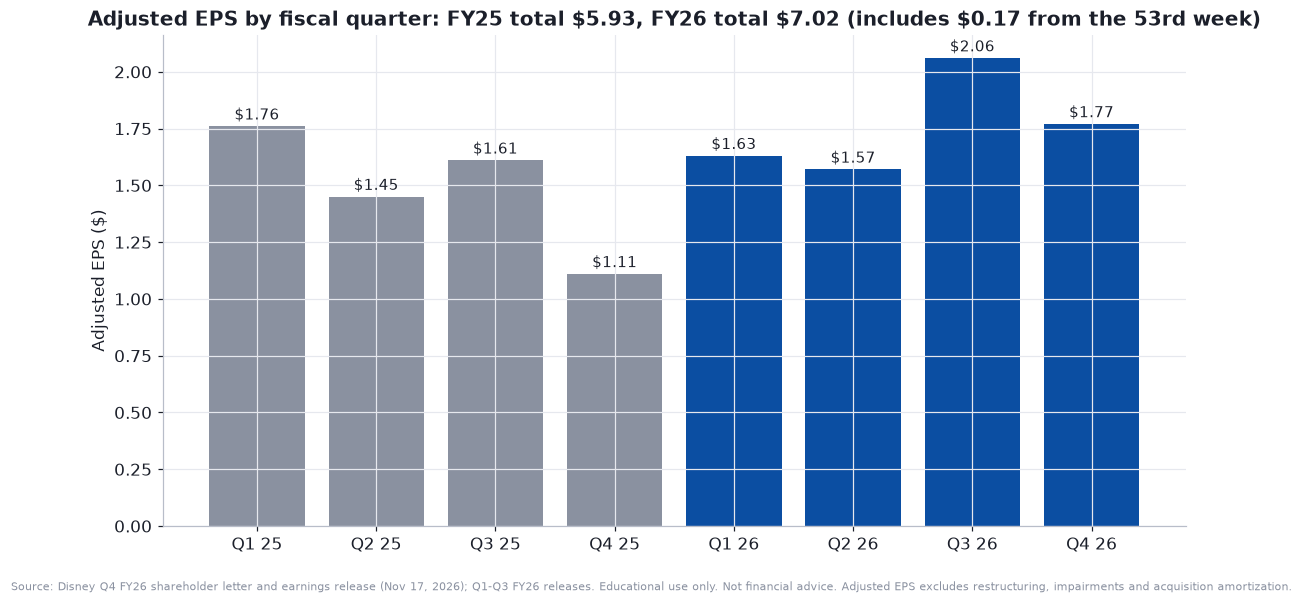
The adjusted EPS series tells the same story at the company level. The fiscal 2025 quarters were $1.76, $1.45, $1.61 and $1.11, a total of $5.93. The fiscal 2026 quarters were $1.63, $1.57, $2.06 and $1.77, a total of $7.02.
Fundamentals, part two: Experiences, the profit engine
Experiences posted record revenue of $10.1 billion in the quarter, up 15%, and record operating income of $2.25 billion, up 20%. The 53rd week supplied about 7 points of the revenue growth and 10 points of the profit growth, so the underlying numbers are roughly 8% and 10%. Global guests, a measure that adds theme park attendance to passenger cruise days, rose 11%, or 4% without the extra week. Fiscal 2026 set an all-time record for global guests, up 5% on the year (4% excluding the extra week).
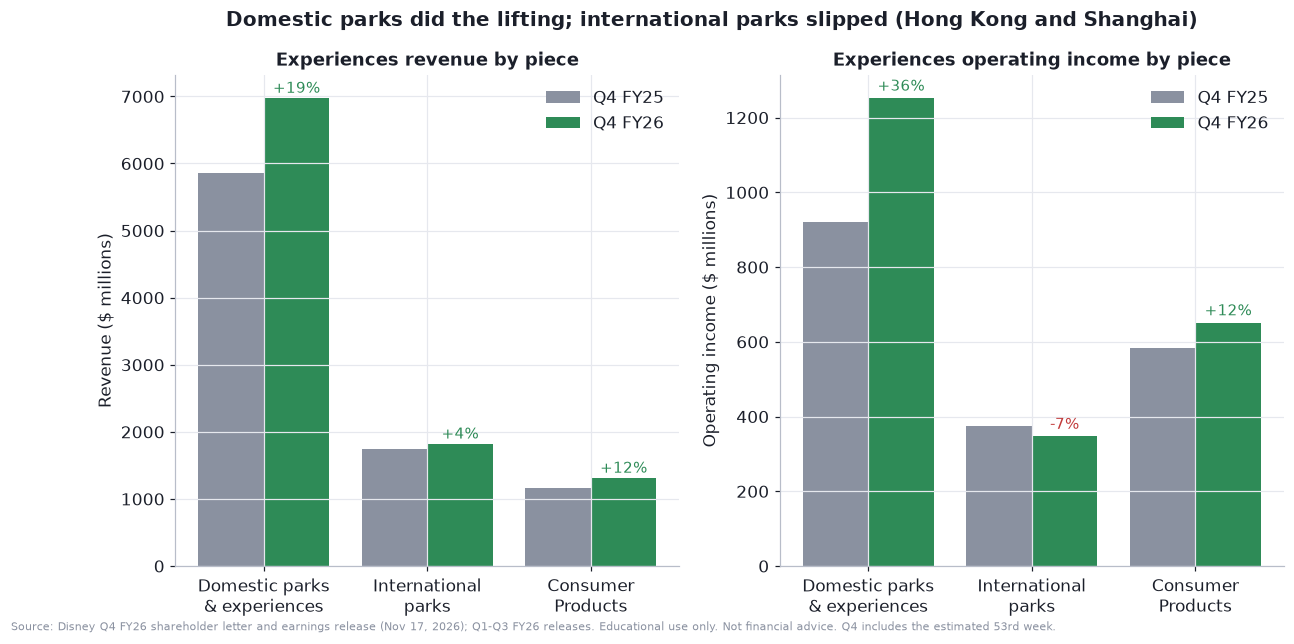
The details matter more than the totals. Domestic Parks and Experiences, which means Walt Disney World, Disneyland Resort and the domestic cruise and vacation businesses, grew revenue 19% to $6.97 billion and operating income 36% to $1.25 billion. Strip the extra week and those become roughly 11% and 21%. Domestic park attendance was up 11% (3% excluding the extra week), and per-person spending rose 4% at domestic parks and 5% at international parks. International parks went the other way. Revenue rose 4% to $1.82 billion but operating income fell 7% to $347 million, as Disneyland Paris grew on the back of its new World of Frozen area while Hong Kong and Shanghai, in management’s words, “worsened during the quarter and we expect this pressure to continue in fiscal 2027.” Consumer Products revenue rose 12% to $1.31 billion and operating income 12% to $651 million.
Cruises are now a visible contributor. The resorts and vacations line, which includes cruise and hotels, grew 24% to $2.80 billion: 11 points from additional passenger cruise days after the Disney Destiny launched in November 2025 and the Disney Adventure in March 2026, 8 points from the extra week and 3 points from higher hotel room rates. Theme park admissions grew 13% (7 points from the extra week, 5 from higher per-capita ticket revenue), and merchandise, food and beverage grew 11%.
Three cautions apply. First, much of the recent strength is capacity and calendar, not demand. New ships and the extra week explain about half the growth in the resorts line, and both lap in fiscal 2027. Management says so: it expects Experiences operating income to grow in the high single digits for fiscal 2027 excluding the extra week, with reported growth in the first half and “relatively flat” profit in the second half. Second, the foreign visitor problem is real. The CFO told CNBC that international attendance at the domestic parks continues to lag, offset by American visitors, and Disney has aimed its marketing at domestic guests. Third, the costs are growing too. Operating labor rose 13% in the quarter and depreciation 17% as new attractions and ships come into service, and Disney plans about $9 billion of capital spending in fiscal 2027, up from $8.7 billion.
The bullish reading is that this is the part of the company with real pricing power, a real moat in its intellectual property, and visible capacity growth: a Monsters, Inc. land at Walt Disney World in 2027, a doubled Avengers Campus at Disney California Adventure in 2028, and forward resort bookings at Walt Disney World that management says are pacing ahead of last year for the first quarter. The cautious reading is that fiscal 2027 growth is front-loaded and the second half looks flat, so the stock is being asked to look through a stretch of slower numbers.
Fundamentals, part three: Entertainment and the streaming question
Entertainment revenue grew 17% to $11.89 billion in the quarter and operating income nearly doubled to $1.33 billion from $691 million, a margin of 11.2%. Subscription and affiliate fees, the largest line, rose 19% to $8.08 billion. Management’s breakdown of that growth is unusually clear: 9 points from the extra week, 5 points from the Fubo transaction (Disney combined its Hulu Live TV business with Fubo and owns about 70% of the combined company), 4 points from more subscribers and 2 points from higher effective rates. Advertising rose 10% to $1.69 billion, again with 9 points from the extra week, 4 from more ad impressions and 2 from Fubo, offset by a 5-point drop from lower prices. Content sales, which include theatrical release, rose 21% to $1.48 billion on animated titles such as “Toy Story 5.”
The streaming numbers are the center of the debate. Entertainment SVOD, which means Disney+ and Hulu subscription video on demand, earned $824 million in the quarter on $6.05 billion of revenue, a margin of 13.6%, against $402 million a year earlier. Its subscription fees rose 22% to $5.13 billion (10 points from more subscribers, 9 from the extra week and 2 from rate), and its advertising revenue rose 6% to $931 million. The full-year SVOD margin was 11.5%. Quarter by quarter, streaming operating income has gone from $310 million in the second quarter of fiscal 2025 to $824 million now.
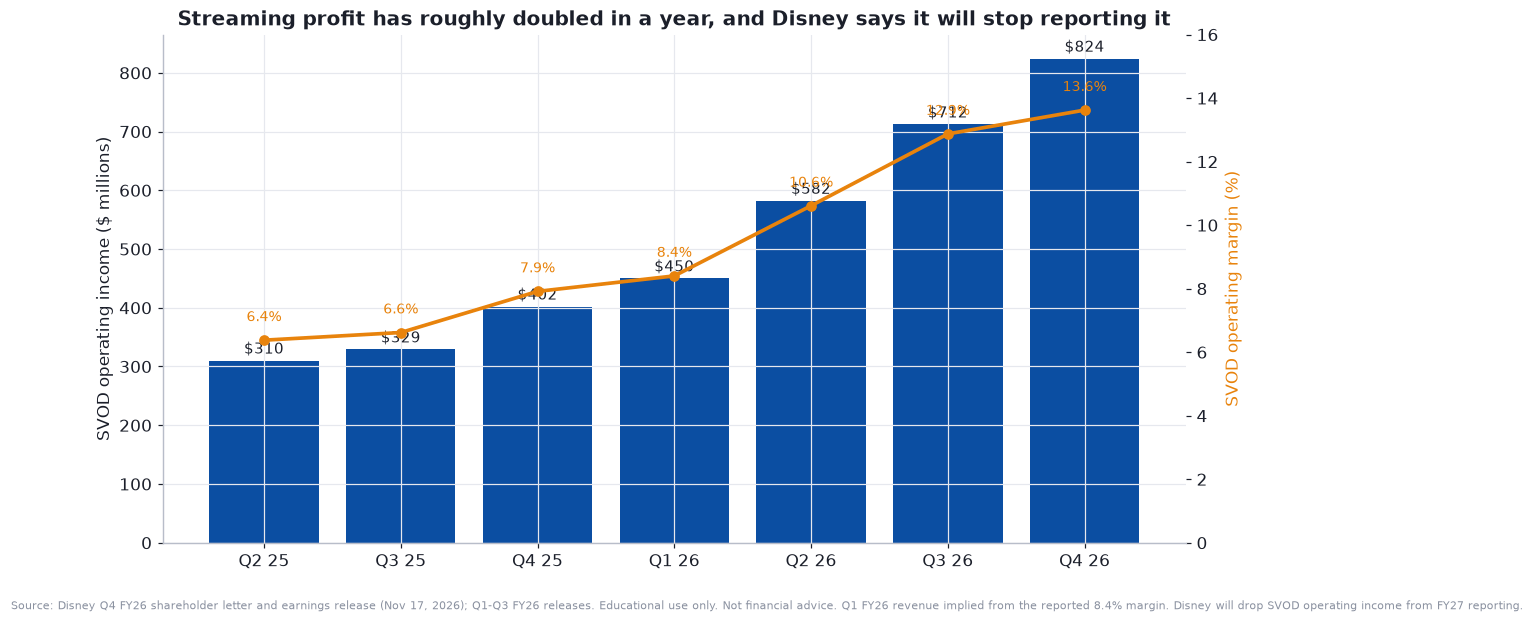
Two details temper the celebration. First, streaming ad prices fell: lower rates took 6 points off advertising growth in streaming and 5 points off the segment total, even as impressions rose. Ad-supported plans are where growth is meant to come from, and prices fell as supply rose. Second, and more important for analysts, Disney announced it will stop reporting SVOD operating income. From the first quarter of fiscal 2027 it will report a larger revenue breakdown for Entertainment, shift most of Consumer Products from Experiences into Entertainment, and remove equity income, mostly the A+E joint venture it just sold for about $1.3 billion, from segment results. Its explanation is that it no longer believes the streaming figure reflects a segment strategy built around maximizing the value of its intellectual property across every channel. Maybe. A company that has just shown its most-watched profit measure doubling is also a company that is choosing to stop showing it. Investors should hold both thoughts.
The strategic position is better than it was. The Disney+ and Hulu apps become one in December, with live television and premium add-ons inside. The company reported strong engagement in Europe, Latin America and Asia Pacific, a plan to roughly triple local originals over three years, and a TikTok agreement bringing creator content to Disney+ in December. It is also pushing into sports on the service: more college football and select NFL games are on Disney+ without an ESPN subscription. The competition is also better organized. Skydance closed its acquisition of Warner Bros. Discovery in October, creating a combined Paramount and HBO streaming group with about 203 million subscribers, according to TheWrap, roughly level with Disney and behind Netflix’s 325 million. Netflix announced a layoff of about 6% of staff the same month. The industry is consolidating around a few large services, which should help pricing over time and raises the cost of content in the short run.
Disney’s own plan is to spend about $26 billion on cash content in fiscal 2027, up roughly 9%, including more on sports rights, international programming and the timing of film production. That spending is paid for by the cost program. Disney now expects annual run-rate savings of about $3 billion by fiscal 2029, and CFO Hugh Johnston told CNBC the plan includes layoffs and cuts to administrative and other general expenses, and said more layoffs are expected. CNBC reported on November 3 that several thousand job cuts were planned. These cuts will partly fund growth and partly drop to profit. For readers building a model, that is a reason to treat restructuring charges as a recurring cost of doing business, not a one-time item, and I return to it in the cash flow discussion.