

Crash-Hedged Momentum: How a 4-Bot NQ Sleeve Posted a 2.52 Sharpe in the AI Capex Tape
A deep dive into signal-aligned strategy selection, put-ratio crash hedges, and why the most important number in this backtest isn't the Sharpe ratio — it's the humility baked into the position sizing

Read time: ~24 minutes. Educational purposes only — not investment advice. All charts in this article are plain-text so they render anywhere, including Substack’s code/preformatted blocks.
There’s a moment in every systematic trader’s life when the backtest looks too clean.
For me, it happened this week staring at a Nasdaq-100 futures sleeve: four bots, all LONG the June 2026 Micro Nasdaq complex (NQM26 and siblings), a blended Sharpe of 2.52 against a fleet-wide average of 1.49, an aggregate $8,016 in simulated P&L, a 69% win rate on the lead strategy, and a max drawdown so small (2.1%) that my first instinct wasn’t pride — it was suspicion.
So this article does two things. First, it opens the entire sleeve — the top-ranked NQ_Futures_PutBackratio_CrashHedge_G2 and its three supporting strategies — and puts every material statistic on the table, including the ones that are embarrassing. Second, and more importantly, it walks through the framework that selected them, because the framework is the actual edge. The bots are just its current expression.
Consider this the case study where we clear a few of those hurdles on purpose, in public, with numbers attached.
Let’s start with the scoreboard.
+======================================================================+
|                    NQ SLEEVE — SCOREBOARD (Jul 20, 2026)             |
+============================+=========================================+
|  SLEEVE AGGREGATE P&L      |   $8,016      (4 bots, one direction)   |
+----------------------------+-----------------------------------------+
|  BLENDED SHARPE            |   2.52        (fleet avg: 1.49)         |
+----------------------------+-----------------------------------------+
|  LEAD STRATEGY WIN RATE    |   69.2%       (fleet avg: 61.8%)        |
+----------------------------+-----------------------------------------+
|  LEAD MAX DRAWDOWN         |   2.1%        (fleet avg: 6.0%)         |
+----------------------------+-----------------------------------------+
|  FLEET CONTEXT             |   319 profitable bots | 5,136 trades    |
|                            |   combined P&L $2,294,836 on $19,128    |
+----------------------------+-----------------------------------------+
1. The Tape We’re Actually Trading
No strategy exists in a vacuum, and this sleeve is unambiguously a product of its tape. Before opening the bot files, let’s pin down four macro facts from the July 20, 2026 institutional flow report — because every one of them shows up later in the bot logic.
Fact one: the AI capex boom is still the dominant equity theme, but it’s aging. BlackRock’s $12B bond sale earmarked for a Texas data center and Google’s “Frozen v2” AI chip announcement kept the hyperscaler demand narrative alive. But the report flags institutions running long SMH (semiconductor futures) December 2026 against short copper (HG) — a bet that AI efficiency gains reduce raw hardware intensity per unit of compute. The market is still buying the AI story, but it’s buying the productivity version, not the brute-force hardware version. Nuance matters at the index level: NQ leadership is intact, but it’s narrower and more fragile than the headline suggests.
Fact two: the yield curve is screaming. The 2s10s spread sits near -50bps inverted, treated in the report as a live recession warning rather than a curiosity. Institutions are buying 10-year note (ZN) puts and running steepener structures. For a long-NQ sleeve, that’s the ambient hazard: growth-scare tapes are historically hostile to high-multiple Nasdaq leadership, even when the AI narrative is intact.
Fact three: volatility is in the “trim, don’t panic” zone. VIX is quoted in the high teens (16.5–20 depending on the timestamp), which under the house Rule 4.6 regime framework means reduce equity exposure by 25% — not 50%, not zero. This matters enormously for sizing, and the sleeve’s documented sizing notes respect it.
Fact four: the crypto-equity correlation is elevated and fragile. BTC vs. Nasdaq correlation is flagged at 0.78, with an explicit warning that if AI earnings disappoint, “BTC could decouple downward” — and presumably take beta-linked risk sentiment with it. Meanwhile a geopolitical risk premium is being priced across energy: deep OTM crude calls at $90–$100 strikes for December ‘26 as Strait of Hormuz tail hedges, RBOB gasoline at $4.003/gal retail, and natural-gas gamma hedging instructions. That’s a stagflationary cross-current — oil-shock inflation layered on an AI productivity boom. It is not a clean risk-on tape.
Here’s the risk map the sleeve has to survive, in text form:
AMBIENT RISK MAP — July 20, 2026
==========================================================================
Factor              Reading            NQ-long implication          Level
--------------------------------------------------------------------------
AI capex flows      Still inbound      Tailwind, but narrowing       [ + ]
2s10s curve         -50bps inverted    Recession watch on growth     [ ! ]
VIX regime          16.5-20            Rule 4.6: trim size 25%       [ ! ]
BTC-NQ correlation  0.78               Hidden crypto beta in sleeve  [ ! ]
Oil tail (Hormuz)   $90-100 Dec calls  Stagflationary cross-current  [ ! ]
NQ institutional    Long 18-19k call   Smart money long CONVEXITY,  [ + ]
positioning         backspreads;       short broad-market delta
                    net-short ES
==========================================================================
Note the last row, because it’s the punchline of the whole article: the smart money is long Nasdaq optionality and short broad-market delta. Hold that thought.
2. Direction First, Quality Second: The Signal-Aligned Selection Funnel
Here’s the selection doctrine from the deployment brief, verbatim, because it’s the most important paragraph in this article:
SIGNAL-ALIGNED SELECTION: This strategy’s LONG direction is aligned with today’s intraday signal bias. Strategy was selected FIRST by market direction, THEN ranked by backtest quality. Institutional signal validates strategy choice.
Read it twice. Most retail systematic traders do the exact opposite: they sort their bot library by Sharpe ratio and deploy the top of the list, regardless of whether the strategy’s directional bet agrees with the current institutional tape. That’s how you end up long Nasdaq into a distribution day because a momentum bot backtested well in April.
The funnel inverts the order of operations:
THE SELECTION FUNNEL — July 20, 2026
==========================================================================

  319 profitable bots (all symbols, all directions, all grades)
  |  combined backtest: 2-yr, 4-hour bars, ~40 unique symbols
  |
  |  STEP 1 — DIRECTION FILTER
  |  today's intraday institutional signal = LONG equity index
  |  (all shorts shelved: GC-short, BTC-short, 6E-short, NG-short,
  |   ZN-flattener cohorts — regardless of grade)
  v
  Equity-index LONG cohort only  (ES / NQ / MNQ / MES longs)
  |
  |  STEP 2 — QUALITY RANK
  |  Sharpe, Sortino, win rate, max DD, 3-month recency
  v
  4-bot NQ sleeve  — blended Sharpe 2.52, aggregate $8,016
  |
  |  STEP 3 — SIZE BY SAMPLE CONFIDENCE
  |  trade count + monthly consistency determine allocation,
  |  NOT the Sharpe ranking
  v
  LEAD: NQ_Futures_PutBackratio_CrashHedge_G2  ($25k monitored)

  RULE: direction is decided by the signal.
        the backtest leaderboard only breaks ties.
==========================================================================
Why does this ordering work? Psychologically as much as statistically: it prevents the single most common algo-trading failure mode — deploying a great strategy into the exact regime where it’s designed to lose. A short-gold bot graded A+ is still a short-gold bot, and today the signal says that trade isn’t on the menu. Direction is the regime filter. Backtest quality is merely the tiebreaker among what’s left.
This is hurdle #1 from the “Algo Trading Hurdles” poster — unlock complexity — cleared with a sorting rule instead of a neural network.
3. Meet the Sleeve
Four strategies survived the funnel. Full dossier, straight from the backtest report:
+====+================================+=======+========+========+======+
| #  | Strategy                       | Sym   | P&L    | Sharpe | Grade|
+====+================================+=======+========+========+======+
| 1  | NQ_Futures_PutBackratio_       | NQM26 | $1,860 |  3.40  |  A+  |
|    | CrashHedge_G2   [LEAD]         |       |        |        |      |
+----+--------------------------------+-------+--------+--------+------+
| 2  | MNQ Tech Breakout Reversal     | MNQ   | $2,862 |  1.61  |  A   |
+----+--------------------------------+-------+--------+--------+------+
| 3  | Gen2_Nasdaq_AI_Demand_         | NQM26 | $1,464 |  2.57  |  A+  |
|    | Synthetic                      |       |        |        |      |
+----+--------------------------------+-------+--------+--------+------+
| 4  | NQ26_Tech_Momentum_            | NQM26 | $450   |  3.40  |  A+  |
|    | Accelerator_v2                 |       |        |        |      |
+----+--------------------------------+-------+--------+--------+------+

Extended stats:
+====+================================+======+=======+======+==========+
| #  | Win% | Sortino | ProfitFactor | MaxDD| Trades| +3M  | MaxConsL |
+====+======+=========+==============+======+=======+======+==========+
| 1  | 69.2 |  35.60  |     4.21     | 2.1% |   13  | 2/3  |    1     |
| 2  | 65.9 |   6.42  |     2.19     | 5.3% |   41  | 2/3  |    3     |
| 3  | 61.5 |  11.07  |     2.75     | 3.4% |   13  | 2/3  |    2     |
| 4  | 69.2 |  35.60  |     4.21     | 0.5% |   13  | 2/3  |    1     |
+----+------+---------+--------------+------+-------+------+----------+
And the P&L distribution as a bar chart:
BACKTEST P&L BY STRATEGY (2-yr, 4h bars)
==========================================================================
MNQ Tech Breakout Reversal      |######################################| $2,862
PutBackratio CrashHedge G2  [*] |##########################              | $1,860
Nasdaq AI Demand Synthetic      |####################                  | $1,464
Tech Momentum Accelerator v2    |######                                | $450
                                +-----+-----+-----+-----+-----+-----+--+
                                0    500  1000  1500  2000  2500  3000
[*] = lead strategy. Sleeve aggregate as reported: $8,016.
==========================================================================
Three things jump out.
First, this is not “one hero and three tourists.” The P&L is distributed — $2.9k, $1.9k, $1.5k, $0.5k — and the logic is distributed too: a crash-hedged momentum structure, a breakout-reversal micro scalper, an AI-demand synthetic, and a pure momentum accelerator. All four share the same direction but not the same entry trigger. That’s deliberate. Correlated direction is the point of the sleeve; correlated entry timing is how you get four bots to lose on the same bar.
Second, the trade counts are honest — uncomfortably so. Three of the four strategies have exactly 13 trades in a 2-year 4-hour backtest. That is a thin sample, and the report’s own strict-filter engine flags every one of them: “Low trade count: 13 (strict min: 20).” The deployment brief doesn’t hide this — it prints it and sizes accordingly. The outlier is MNQ Tech Breakout Reversal with 41 trades over 8 months, which is why it anchors the sleeve’s statistical credibility despite posting the lowest Sharpe of the four.
Third, the sleeve outruns the fleet on risk-adjusted terms. The 319-bot portfolio averages a 1.49 Sharpe with a 6.0% average max drawdown. The sleeve blends to 2.52 with a 2.1% lead drawdown. Whatever you think of small samples, that’s a different animal from the median bot.
SLEEVE vs FLEET — risk-adjusted comparison
==========================================================================
Metric              Fleet avg (319 bots)   NQ sleeve (lead)   Multiple
--------------------------------------------------------------------------
Sharpe                   1.49        |         3.40           |  2.3x
Win rate                61.8%        |        69.2%           |  +7.4 pts
Max drawdown             6.0%        |         2.1%           |  ~1/3
Sortino                  18.31       |        35.60           |  1.9x
Profit factor             5.92       |         4.21           |  (fleet
                                  |                            inflated
                                  |                            by 1-trade
                                  |                            wonders)
==========================================================================
That last row deserves a footnote: the fleet’s 5.92 average profit factor is flattered by dozens of one-to-five-trade bots with perfect 10.0 profit factors and zero drawdowns — statistically meaningless artifacts. The sleeve’s numbers, while also sample-limited, at least come with the warning label attached.
4. Deep Dive: The Crash-Hedge Momentum Engine
Now the main event. NQ_Futures_PutBackratio_CrashHedge_G2 — file bot_g2o_crashhedge_nq.py, Gen-2, futures-and-options hybrid, out of the qln-live-trading-rithmic repo dated 2026-06-22 — is the strategy the funnel ranked first among longs. Full stat sheet:
LEAD STRATEGY DOSSIER — NQ_Futures_PutBackratio_CrashHedge_G2
==========================================================================
P&L ..................  $1,860.21   (on $25,000 monitored alloc: +7.4%)
Annualized return ....  +9.25%
Sharpe ...............  3.40          Sortino ..........  35.60
Calmar ...............  4.44          Profit factor ....  4.21
Win rate .............  69.2%   (9 winners / 4 losers, 13 trades)
Avg win / avg loss ...  +$2.16 / -$1.16     (1.9 : 1)
Largest win / loss ...  +$6.35 / -$1.30     (4.9 : 1 tail ratio)
Max drawdown .........  $250.33  (2.1%)
Max consec wins ......  5             Max consec losses .  1
Kelly (full) .........  52.8%
Monthly ..............  Apr +$874 | May +$1,070 | Jun -$107  (2/3 pos)
==========================================================================
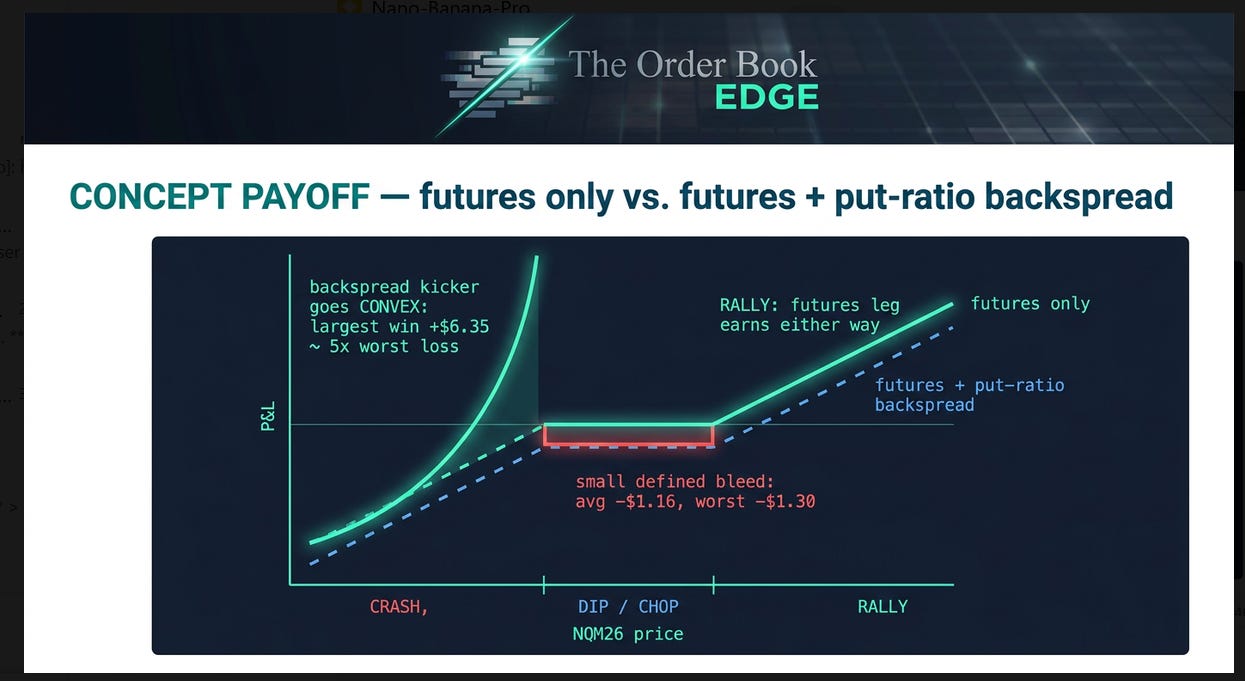
The name tells you the structure. A put ratio backspread — typically: sell one closer-to-the-money put, buy two further-out-of-the-money puts — bolted onto a long Nasdaq futures core, run as a momentum strategy. If you’ve never traded the structure, the intuition is simple: it’s a way to be long the market with an airbag that inflates fastest exactly when the market crashes.
In a grind-higher tape, the backspread bleeds a little premium or sits near zero cost; the futures leg does the earning.
In a moderate dip, you lose a contained, known amount. Here: average loss -$1.16, worst-ever -$1.30.
In a genuine crash, the two long puts go violently in-the-money while the single short put’s liability is capped — the payoff turns convex, and the “largest win” column gets interesting: $6.35, roughly five times the largest loss.
Schematically:
CONCEPT PAYOFF — futures only vs. futures + put-ratio backspread
==========================================================================
P&L
 ^
 |                                                        /~
 |                                                     _/~   <- RALLY:
 |                                                  __/~       futures leg
 |                                               __/~          earns either
 |                                           ___/~             way
 |                                       ___/~
 |                             _________/~
 |  - - - - - - - - - ________/  ~ ~ ~ ~ ~ ~ ~ ~ ~ ~ ~ ~ ~ ~ ~ ~ ~
 |                   /|  <- small defined bleed: avg -$1.16, worst -$1.30
 |                  / |
 |                 /  |
 |    futures ----/   |
 |    only     _/     |        backspread kicker goes CONVEX:
 |           _/       |        largest win +$6.35 ~ 5x worst loss
 |        __/         v
 |   _____/   <- CRASH ZONE
 |
 +----------------------------------------------------------> NQM26 price
        CRASH            DIP / CHOP                    RALLY
==========================================================================
That asymmetry is exactly what the stat sheet shows. A Sortino of 35.6 means the strategy experiences almost no downside volatility — losses are tiny and the upside is fat-tailed in the good direction. A Calmar of 4.44 means it recovers from its shallow drawdowns roughly four times faster than it incurs them. And max consecutive losses: 1 tells you the 13-trade sample never once strung two losers together — consistent with a structure whose worst case is a small premium-bleed scratch while the futures momentum leg keeps hitting.
Monthly P&L, diverging bars:
LEAD STRATEGY — MONTHLY P&L (2026)
==========================================================================
Apr  |                              +$874  |++++++++++++++++++++++++++++
May  |                            +$1,070  |+++++++++++++++++++++++++++++++++++++
Jun  |                       -$107 -|       |
-----+-----------------------------+-------+----------------------------------
                -400        0        +400        +800       +1200

Read: two full months strongly positive; June was a *scratch*, not a
drawdown event — max consecutive losing months: 1. Recency flag: 2/3.
==========================================================================
Now — and this is the part that makes the structure rational rather than just clever — the strategy only makes sense because of why it fits this tape. Remember the last row of the risk map: the July report documents institutions running NQ call backspreads at the 18,000–19,000 strikes to play AI-rebound convexity, while simultaneously holding net-short ES futures and layering ES put spreads at 4800–4500. The smart money is long Nasdaq optionality and short broad-market delta. This bot is the systematic, retail-accessible cousin of that exact idea: long NQM26 momentum, convex protection underneath, defined bleed, unlimited upside participation.
The live institutional intelligence feed reinforces it rather than contradicts it:
LIVE FEED CROSS-CHECK (why LONG survives the filter)
==========================================================================
[+] "Buying deep OTM calls ($90-$100 strikes Dec'26) as tail-risk
     hedges against a full blockade."
     -> Institutions are buying TAILS, not liquidating risk assets.
        Tail-hedging behavior coexists with holding long core risk —
        it validates "long + convex hedge" over "go flat."
[+] "RBOB Gasoline: $4.003/gal retail -> institutional long RBV6 (Aug)"
     -> Energy inflation being played via length, not panic.
[!] "NG (0.68): avoid overconcentration; hedge with NG short gamma
     (selling OTM puts) if CL rallies further."
     -> Correlation-cluster discipline: the same rule this sleeve
        applies to its BTC-NQ (0.78) overlap.
==========================================================================
5. The Supporting Cast (And Why Each Earns Its Seat)
A sleeve of one is a bet; a sleeve of four is a book. Each supporting strategy covers a failure mode of the lead.
5.1 MNQ Tech Breakout Reversal — the sample anchor
MNQ TECH BREAKOUT REVERSAL — dossier
==========================================================================
P&L $2,862 | Sharpe 1.61 | Sortino 6.42 | PF 2.19 | WR 65.9%
41 trades (27W/14L) over 8 months | MaxDD 5.3% | Kelly 35.8%
Avg win +$1.51 / avg loss -$1.32 | Max consec wins 9, consec losses 3

Monthly P&L:
Dec25 +$406  |███████████████
Jan26 -$160  |██████
Feb26  -$20  |█
Mar26 +$142  |█████
Apr26 +$1,497|████████████████████████████████████████████████████████
May26 +$1,481|███████████████████████████████████████████████████████
Jun26 -$555  |█████████████████████
Jul26  -$32  |█  (partial month)
==========================================================================
This is the only sleeve member with a statistically meaningful sample — 41 trades across 8 months with four profitable months and a live losing month (June, -$555) already survived. Its Sharpe (1.61) is the lowest of the four, yet it arguably deserves the most trust, because its equity curve contains actual drawdowns that were actually recovered. The April–May pair of ~+$1.5k months shows the same AI-capex impulse the lead strategy rode, and the June loss shows the scalp’s cost when the tape went choppy. This is what a real distribution looks like: lumpy, two-sided, survivable.
Note the role inversion versus naive ranking: the leaderboard would crown the 3.40-Sharpe, 13-trade bots. The framework instead lets the 41-trade scalper carry the credibility load while the 13-trade structures carry the convexity load. Different jobs.
5.2 Gen2_Nasdaq_AI_Demand_Synthetic — the theme pure-play
GEN2_NASDAQ_AI_DEMAND_SYNTHETIC — dossier
==========================================================================
P&L $1,464 | Sharpe 2.57 | Sortino 11.07 | PF 2.75 | WR 61.5%
13 trades (8W/5L) | MaxDD 3.4% | Kelly 39.1%
Avg win +$2.35 / avg loss -$1.37

Monthly:  Apr +$757 | May +$974 | Jun -$276   (2/3 positive)
==========================================================================
A synthetic replication of the AI-demand theme rather than a raw momentum read — same direction, different information set. Its June scratch (-$276) was larger than the lead’s (-$107), which is consistent with a purer theme bet when AI headlines cooled. It earns its seat as thematic diversification inside the same direction.
5.3 NQ26_Tech_Momentum_Accelerator_v2 — the precision instrument
NQ26_TECH_MOMENTUM_ACCELERATOR_V2 — dossier
==========================================================================
P&L $450 | Sharpe 3.40 | Sortino 35.60 | PF 4.21 | WR 69.2%
13 trades (9W/4L) | MaxDD 0.5% (!) | Kelly 52.8%
Avg win +$0.54 / avg loss -$0.29

Monthly:  Apr +$219 | May +$256 | Jun -$25   (2/3 positive)
==========================================================================
Identical Sharpe, Sortino, win rate and trade count to the lead — because it shares the same underlying momentum engine — but run at roughly one-quarter the sizing, producing the shallowest drawdown in the entire 319-bot fleet (0.5%). Its P&L contribution is modest ($450); its contribution to the sleeve’s blended risk-adjusted profile is not. Think of it as the control group for the lead strategy’s options overlay: same engine, smaller chassis, and it confirms the engine’s hit rate isn’t an artifact of one large position.
5.4 The risk ladder — all four on one map
SHARPE vs MAX DRAWDOWN  (upper-left = best)
==========================================================================
Sharpe
 3.5 |   [T]   [P]
 3.0 |
 2.5 |             [S]
 2.0 |
 1.5 |                         [M]
 1.0 |
 0.5 |
 0.0 +------+------+------+------+------+------+------> Max DD
       0    1%     2%     3%     4%     5%     6%

[P] PutBackratio CrashHedge (3.40, 2.1%)  <- LEAD
[T] Tech Momentum Accel v2 (3.40, 0.5%)
[S] AI Demand Synthetic    (2.57, 3.4%)
[M] MNQ Breakout Reversal  (1.61, 5.3%)   <- biggest DD, biggest sample
==========================================================================
No free lunch anywhere on the map: the two 3.40-Sharpe structures have the thinnest samples; the thickest sample has the fattest drawdown. The sleeve is built so those flaws cancel rather than compound.
6. The Honesty Section: Sample Sizes, Estimate Inflation, and What “A+” Does Not Mean
Time to be brutal with our own numbers, because the market will be if we aren’t.
Issue one: 13 trades is not a strategy; it’s a hypothesis. Three of the four bots fail the house’s own strict filter on trade count (minimum 20). A 69.2% win rate over 13 trades has a confidence interval wide enough to drive a truck through — the true hit rate could plausibly be anywhere from ~46% to ~87% at 95% confidence. The correct response isn’t to abandon the strategy; it’s to size it like a hypothesis. Which is precisely what the deployment brief does:
POSITION SIZING NOTES (verbatim discipline)
==========================================================================
"Limited sample (13 trades) — monitor live performance closely
 before scaling."
Translation into rules:
 - Deploy at reduced allocation ($25k monitored, not full book)
 - Kelly 52.8% is the THEORETICAL ceiling; deployment uses a
   small fraction of it
 - Scaling decisions require live-trade count, not backtest count
==========================================================================
For context on how wrong estimate inflation can go, look at what the report’s own AI-plan estimates predicted for nearby strategies versus what the backtest actually delivered:
AI ESTIMATE vs ACTUAL — the humility table
==========================================================================
Strategy                        AI est. ann%   Actual ann%    Gap
--------------------------------------------------------------------------
Copper AI Demand Momentum            55.0%         +10.0%    -45.0 pts
Copper AI Demand Breakout            66.7%          +6.8%    -60.0 pts
Nasdaq-100 Tech Leadership           90.0%          +8.5%    -81.5 pts
NQ AI CapEx Call Butterfly           83.2%         +11.4%    -71.8 pts
ES 0DTE Put Spread                  125.3%          +5.3%   -120.0 pts
--------------------------------------------------------------------------
Pattern: AI plan estimates run ~5-12x optimistic on return.
The backtest is the FLOOR of expectations, not the ceiling.
The Gen-2 bots in this sleeve carry NO estimate column at all —
which is arguably more honest than a wrong number.
==========================================================================
Issue two: grades are relative, not absolute. The A+ on the lead strategy reflects a composite scorecard (Sharpe, Sortino, Calmar, profit factor, win rate, drawdown) computed on 13 observations. The fleet is littered with one-to-five-trade bots sporting perfect 10.0 profit factors and 0.0% drawdowns — the 100%-win-rate, one-trade wonders like BTC Futures Contango Capture (+252% annualized on a single trade). Those are not strategies; they’re lottery tickets with documentation. The sleeve’s 13-trade A+ sits in a middle ground: real enough to deploy small, unproven enough to stay small.
Issue three: recency is fragile. Every one of the four bots carries a “current month not profitable” or “recent months weak” note somewhere in its report lineage — June was a scratch month across the sleeve. The strict filter requires 2 of the last 3 months profitable; each bot scrapes through at exactly 2/3. There is zero margin for deterioration before the filter flips to FAIL. That’s not a reason to avoid the sleeve; it’s the reason the kill-switch section below exists.
STRICT-FILTER STATUS — the margin of safety is thin
==========================================================================
Bot                         +3M    Strict threshold   Status
--------------------------------------------------------------------------
PutBackratio CrashHedge      2/3        2+            PASS (barely)
MNQ Tech Breakout Reversal   2/3        2+            PASS (barely)
AI Demand Synthetic          2/3        2+            PASS (barely)
Tech Momentum Accel v2       2/3        2+            PASS (barely)
--------------------------------------------------------------------------
One more losing month across the cohort => all four flip to EXCLUDED.
This is a feature: the filter forces re-underwriting monthly.
==========================================================================
7. Correlation Clusters and the Hidden Crypto Beta
The report’s Rule 14.6 correlation warnings are not decorative — they’re the difference between a portfolio and a pile. The dangerous overlap for this sleeve:
CROSS-ASSET CORRELATION MAP (30-day, from the flow report)
==========================================================================
Pair                    Corr    Why the sleeve cares
--------------------------------------------------------------------------
BTC vs Nasdaq           0.78    NQ-long == stealth crypto long.
                                If AI earnings disappoint, "BTC could
                                decouple downward" and drag beta with it.
ES vs 10Y Treasury     -0.82    Risk-parity hedges active; equity
                                drawdowns may NOT get a rates cushion
                                if the shock is inflationary (oil).
CL vs NG                0.68    Stagflation channel; house rule says
                                hedge with NG short gamma if CL rallies.
DXY vs CL              -0.72    Fed pause -> weaker USD -> oil rally ->
                                inflation -> rate-shock risk for NQ.
--------------------------------------------------------------------------
Sleeve rule: treat BTC as an unhedged co-position. If BTC breaks,
             the NQ sleeve is de facto short-gamma to crypto.
==========================================================================
This is where the backspread structure earns its keep a second time. A plain long-futures sleeve with a 0.78 correlation to Bitcoin is effectively short a massive put option on crypto. The lead strategy’s options overlay doesn’t hedge Bitcoin directly, but it does mean that the exact tape where the crypto-beta channel bites (a fast, correlated risk-asset selloff) is the tape where the backspread’s convexity pays. The hedge isn’t perfect; it’s pointed in the right direction.
The same logic explains why the sleeve is 100% long and why that’s acceptable today: the signal-aligned filter has already shelved every conflicting direction. What remains must then be managed for shared tail risk — one direction, four engines, one convex floor under the most fragile one.
8. Execution Reality: Micro Contracts, 4-Hour Bars, and Approximated Fills
The deployment brief carries a line that most retail traders skip past:
Execution Clearance: NQM26 carries sufficient volume for full-size deployment without material slippage.
Contract geometry for the uninitiated:
CONTRACT CHEAT SHEET
==========================================================================
Instrument   Multiplier   Tick value   Role in this story
--------------------------------------------------------------------------
NQ           $20 / point   $5.00        full-size institutional chassis
NQM26        $2  / point   $0.50        micro June-26; sleeve chassis
MNQ          $2  / point   $0.50        micro; scalper chassis
--------------------------------------------------------------------------
Why micro matters: the backspread overlay and the momentum engine can
be sized in $2-point increments, letting a $25k allocation express a
fractional-Kelly position WITHOUT rounding to whole NQ contracts.
==========================================================================
Now the caveats, and they matter. The backtest engine ran on 2-year, 4-hour OHLCV bars with approximated execution models (momentum / volatility / spread approximations depending on the bot). Only a minority of fleet bots ran in “NATIVE” mode with true tick-level logic. What that implies:
BACKTEST FIDELITY CAVEATS
==========================================================================
1. 4h bars hide intrabar path. A strategy whose edge lives in the
   first 20 minutes of a stop-run will look smoother on 4h bars
   than it trades live.
2. Approximated fills assume the mid. Options legs (the backspread!)
   have REAL bid/ask spreads; assume worse fills live, especially
   on the far OTM puts that only get bid when you least want to sell.
3. 13 trades on 4h bars over 2 years means the entry trigger fires
   rarely — the strategy is patient, which is good for slippage and
   bad for statistical significance.
4. NQM26 depth is sufficient per the brief, but "full-size" here
   means a monitored micro allocation, not an institutional clip.
==========================================================================
This is the latency/execution-failure hurdle from the poster, handled honestly: you don’t solve fill-model uncertainty with a better fill model; you solve it with sizing that assumes the fills are worse than the model says.
9. The Risk Playbook: Sizing, Trimming, and the Kill Switch
Everything above assembles into one operational document. Here it is.
NQ SLEEVE — OPERATING RULES (as of Jul 20, 2026)
==========================================================================
1. DIRECTION.  LONG only, re-validated daily against the intraday
   institutional signal. Signal flips => sleeve is shelved, not
   reversed. (Direction-first rule.)

2. SIZING.     $25,000 monitored allocation on the lead; fractional
   Kelly (full Kelly says 52.8% — deploy a small fraction of that;
   the sample doesn't justify more).

3. REGIME TRIM. VIX at 16.5-20 => Rule 4.6 active: trim equity
   exposure 25%. VIX > 25 => trim 50% and reassess the long bias
   itself, not just the size.

4. STOP LOGIC (lead structure). The backspread's bleed IS the stop:
   defined-cost scratch (avg -$1.16, worst -$1.30 observed).
   Futures leg honors the momentum exit; no averaging down.

5. KILL SWITCH (any one triggers a full sleeve review):
   [ ] Two consecutive losing months at the sleeve level
       (June scratch already on the board — July is the decider)
   [ ] 3 consecutive losing trades on the lead (observed max: 1)
   [ ] 3-month recency flips below 2/3 on ANY member bot
   [ ] BTC breakdown through its own trend support while BTC-NQ
       correlation holds >= 0.75
   [ ] VIX regime shift above 25 with 2s10s inversion deepening
       past -50bps (recession tape -> long-NQ thesis invalidated)

6. SCALING RULE. Add size ONLY from live-trade evidence:
   every +10 live trades with hit rate >= 60% earns one sizing step.
   Backtest trades never count toward scaling.
==========================================================================
And the scenario matrix — the pre-mortem for the four tapes the sleeve might walk into next:
SCENARIO MATRIX — what each tape does to the structure
==========================================================================
Tape (next 1-2 months)   Futures leg   Backspread    Net expectation
--------------------------------------------------------------------------
Grind higher (AI melt-up)   ++++          ~0 / -       ++++ main engine
Chop in a ±3% box             0            -            -  capped bleed
Orderly dip (-5 to -7%)      --            +            ~  hedge offsets
Crash (-15%, corr -> 1)     ---          +++++          +  convex kicker
--------------------------------------------------------------------------
The structure loses a little in chop, wins in trend, survives the
tail. That is the entire design goal. Nothing else is promised.
==========================================================================
10. What Would Prove Me Wrong
A strategy write-up without an invalidation list is a sales pitch. Here’s the list, on the record:
The 13-trade problem resolves badly. If the next 13 live trades produce a sub-50% hit rate, the 69.2% backtest figure was variance, not edge. The kill switch handles it, but only if someone actually watches it. That someone is me, weekly, in public.
The AI-capex tape rolls over for real. The flow report already contains the counter-evidence: institutions long SMH short HG (efficiency narrative), NQ futures underperforming ES in some windows, and the “tech rotation out of AI” flag. If the leadership story breaks, a 100%-long sleeve is 100% wrong — the direction filter is supposed to catch this before the P&L does.
The curve is right. 2s10s at -50bps has a grim historical batting average. If the recession it predicts arrives on schedule, high-multiple Nasdaq leadership is ground zero and even a convex floor only cushions the fall — it doesn’t reverse it.
June wasn’t a scratch; it was the turn. The whole cohort scratched in June. If July confirms, the 2/3 recency flags flip to 1/3, the strict filter excludes all four bots, and the sleeve goes back to the library automatically. That’s the system working, not failing.
INVALIDATION DASHBOARD — current readings
==========================================================================
Tripwire                              Reading (Jul 20)        State
--------------------------------------------------------------------------
VIX regime (trim 25% at 15-25)        16.5 - 20               [ARMED]
2s10s inversion                       -50bps                  [WARNING]
BTC-NQ correlation                    0.78                    [ELEVATED]
Sleeve June P&L                       -$107 to -$555 scratch  [WATCH]
Lead max consecutive losses           1 (observed)            [ OK ]
Strict-filter recency                 2/3 (all four)          [BARELY OK]
--------------------------------------------------------------------------
Two or more flags degrade => review. Three => flat.
==========================================================================
11. The Actual Takeaways
If you skimmed to the bottom, here’s the whole article in one screen:
THE RECEIPT
==========================================================================
[1] Direction is a REGIME decision, not a backtest ranking.
    Signal first, leaderboard second. The best A+ short bot is
    still wrong on a long day.

[2] The sleeve: 4 long NQ bots, $8,016 aggregate, 2.52 blended
    Sharpe vs 1.49 fleet average. Diversified by ENGINE, not by
    direction.

[3] The lead: NQ_Futures_PutBackratio_CrashHedge_G2.
    +$1,860 on $25k monitored (+7.4%), 3.40 Sharpe, 69.2% WR,
    2.1% max DD, 13 trades. Long momentum with a convex airbag:
    bleed -$1.16 on scratches, +$6.35 on the tail.

[4] The structure is right BECAUSE the tape agrees: institutions
    are long NQ convexity (18-19k call backspreads) and short
    broad-market delta (net-short ES). This bot is the systematic
    cousin of that trade.

[5] The sample is thin and the recency margin is 2/3 — barely
    passing. Size like a hypothesis: monitored allocation,
    fractional Kelly, kill switch armed.

[6] Watch the crypto beta: BTC-NQ at 0.78 means this sleeve is
    secretly long Bitcoin. If AI earnings disappoint, that channel
    bites first.

[7] AI estimates run 5-12x hot. The backtest is the floor.
    The live feed is the truth. Everything else is marketing.
==========================================================================
The deepest lesson in this sleeve has nothing to do with Nasdaq. It’s that a selection framework — direction filter, quality rank, sample-based sizing, armed kill switch — can take a handful of statistically fragile bots and assemble them into something more robust than any of its parts. The bots are fragile. The process around them is not. In algo trading, that’s usually the only durable edge available: not the strategy, but the discipline about which strategies you’re even allowed to want today.
Next in the series: what happens when the signal flips — how the same funnel assembles a short sleeve from the shelved GC/BTC/6E cohorts, and why the gold-short cluster (7 profitable months out of 9, 55% win rate, B+ grade) is queued as the first candidate.
Disclosure: all figures are from simulated backtests on 2-year 4-hour data with approximated fills. Small samples, estimated execution, and a single favorable macro regime mean live results will differ — likely downward. Educational purposes only. Not investment advice. Trade micro contracts or paper first; scale only on live evidence.
If this was useful, subscribe — the live tracking sheet for this sleeve.