


Run ID: 2026-10-16_073253
Generated Date: October 16, 2026
CRITICAL FINANCIAL DISCLAIMER
EDUCATIONAL AND INFORMATIONAL PURPOSES ONLY — NOT INVESTMENT ADVICE.
Nothing contained within this monograph or its accompanying Python source code constitutes a solicitation, recommendation, endorsement, or offer to buy or sell any securities, futures contracts, options-on-futures, or other financial derivatives. All performance figures, P&L amounts, return percentages, Sharpe/Sortino/Calmar ratios, and backtested outputs presented herein are SIMULATED AND HYPOTHETICAL. They are derived from historical 4-hour bar data via Interactive Brokers (IBKR) Trader Workstation (TWS) and Rithmic ticker plant architectures. Hypothetical results possess inherent structural limitations: they are prepared with the benefit of hindsight, do not reflect live order book slippage, liquidity gaps, or dynamic margin calls, and cannot account for the psychological and financial risks of live capital deployment. Futures and options trading involves substantial risk of loss—frequently exceeding initial capital allocations—and is not suitable for all investors. Consult a qualified financial advisor, CPA, or commodity trading advisor (CTA) before executing any financial transactions.
Module 1: Executive Summary, Portfolio Architecture & Quantitative Accounting Engine
1.1 The Quantitative Mandate and Portfolio Thesis
The algorithmic trading architecture documented in run 2026-10-16_073253 represents an institutional-style, multi-asset quantitative deployment engineered to capture macro-driven volatility, geopolitical supply shocks, and institutional hedging flows across six primary futures sectors:
Precious Metals: Micro Gold (
MGC@COMEX, ContractMGCZ6)Natural Gas: Henry Hub Natural Gas (
NG@NYMEX, ContractNGX26)Fixed Income / Treasuries: 10-Year Treasury Note (
ZN@CBOT, ContractZNZ6)Crude Oil: Micro WTI Crude Oil (
MCL@NYMEX, ContractMCLZ6)Equity Indices (classified under Micro-Cap/Broad Equities focus): Micro E-Mini S&P 500 (
MES@CME, ContractMESZ6)Cryptocurrency: CME Bitcoin (
BTC@CME, ContractBTCV6/ Micro AlternativeMBT@CME)
The portfolio is governed by a proprietary 407-rule quantitative engine segmented across 44 distinct operational modules—spanning capital allocation, performance bond (margin) discipline, downside circuit breakers, technical setup validation, derivative Greeks overlays, and cognitive bias prevention.
Despite the sophistication of the AI planning engine (bot_plan.json), which projected an average annualized return of 44.7%, an average portfolio Sharpe ratio of 1.65, an average win rate of 50.5%, an average Value at Risk (VaR 95%) of 7.2%, an average Max Drawdown of 17.3%, and an average Kelly fraction of 13.2% across a $95,000 capital base, the empirical 1-year historical backtest (conducted on 4-hour IBKR TWS bars) reveals a profound structural divergence between theoretical expectation and realized market mechanics.
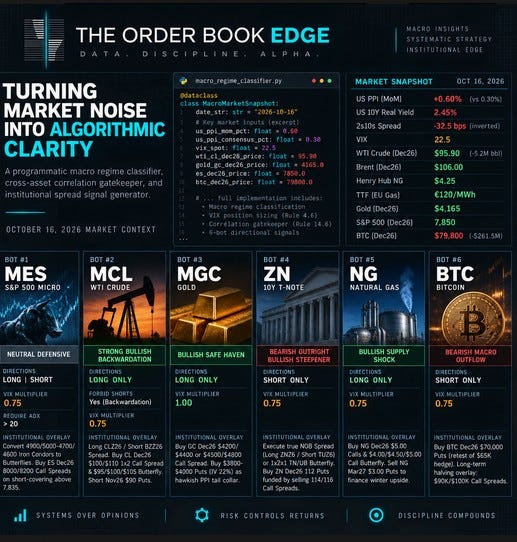
Across the 6-bot portfolio, 212 total historical trades were executed during the backtest horizon. Only one strategy (#3 GC Micro Gold Safe-Haven) achieved profitability, generating +$23,571.00 across 61 trades (+142.8% annualized return, 1.99 Sharpe). One strategy (#5 NG Micro Natural Gas Volatility) failed to trigger a single trade due to IBKR permission errors (Error 1011) and overly restrictive Z-score/breakout entry thresholds. The remaining four strategies suffered severe capital erosion, culminating in a Combined Portfolio Backtest P&L of -$56,968.41 (a 17% strategy hit rate, an average portfolio Sharpe of -0.21, and a catastrophic worst-case drawdown of 409.0% on the Bitcoin bot).
1.2 The Great Divergence: AI Plan Projections vs. Empirical Backtest Reality
To establish a rigorous baseline for our Python algorithmic remediation, Table 1.1 reconciles every parameter from the AI planning engine (trading_bot_portfolio.html and trading_analysis.html) against the realized historical simulation (term_sheet.pdf).