


Every trading operation eventually searches for the same instrument.
It should protect the portfolio when markets fall, participate when markets rise, cost little to hold, and remain liquid when everything else is breaking. Ideally, it should do all of this automatically, without demanding perfect forecasts or constant supervision.
It is the financial equivalent of a perpetual-motion machine.
The latest paper-trading session makes that dream unusually tempting. Across 89 automated strategies monitoring 12 futures symbols, the ZN Treasury yield-curve steepener family emerged as the clear leader. Its top instance closed 14 trades with 10 wins and four losses, producing a 71.4% win rate. The wider fleet recorded 40 closed wins against 50 losses, for a 44.4% session win rate, while aggregate simulated realized P&L reached $496.17.
Meanwhile, gold strategies were sharply inconsistent, an AI-momentum Nasdaq strategy went 0-for-6, approximately 60 bots generated no trades, and parts of the infrastructure suffered stale data, runtime errors, and interface failures.
The apparent conclusion writes itself:
Treasury curves worked. Much of the remaining fleet struggled. Perhaps ZN is the universal portfolio answer.
But that conclusion confuses three very different things:
An instrument, such as 10-Year Treasury Note futures;
A strategy, such as a parameterized curve-steepening algorithm; and
A portfolio hedge, which must be judged by what it does to the entire portfolio during specific adverse events.
The session provides encouraging evidence about the first two. It provides almost no direct evidence about the third.
So, will ZN become the ultimate instrument that universally protects against downswings while preserving upside?
No—not on this evidence, and probably not in that universal form. ZN is not a new instrument, Treasury prices do not respond identically to every market decline, and a 24-hour simulation cannot establish crisis protection.
The stronger and more useful conclusion is narrower:
One ZN configuration performed exceptionally well in one simulated session and has earned a much harder, portfolio-level examination.
That may sound less exciting. It is also how promising strategies survive contact with reality.
1. What the session actually demonstrated
The top ZN instance—bot_zn_micro_steepener, PID 13672—was the session’s undisputed leader by closed winning trades. Unlike the numerous bots posting perfect records on one or two positions, it completed enough trades to become a meaningful research priority.
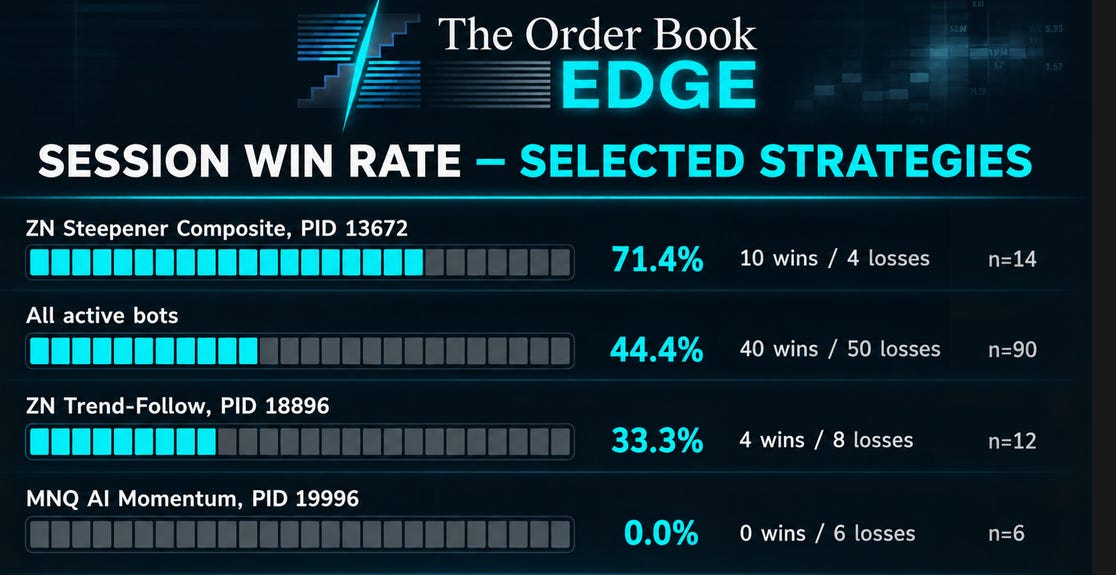
Visualization 1: The leader was clear, but the evidence was mixed
SESSION WIN RATE — SELECTED STRATEGIES

ZN Steepener Composite, PID 13672
█████████████████████████████░  71.4%   10 wins / 4 losses   n=14

All active bots
██████████████████░░░░░░░░░░░░  44.4%   40 wins / 50 losses  n=90

ZN Trend-Follow, PID 18896
█████████████░░░░░░░░░░░░░░░░░  33.3%    4 wins / 8 losses   n=12

MNQ AI Momentum, PID 19996
░░░░░░░░░░░░░░░░░░░░░░░░░░░░░░   0.0%    0 wins / 6 losses   n=6
Source: supplied Redis Gateway paper-trading report. Bars illustrate the reported percentages.
The chart supports a real observation: the leading ZN configuration substantially outperformed the session average.
But the second ZN entry may be more important than the first.
A related strategy, described as “Yield Curve Steepener Trend-Follow,” produced four wins and eight losses. Another bear-steepener instance went 0-for-2, while other ZN variants landed between 50% and 66.7%.
In other words, the ZN label did not guarantee success. Results depended heavily on implementation.
That is simultaneously encouraging and warning.
It is encouraging because a specific configuration may have detected something the other strategies missed. It is warning because relatively small changes in trend confirmation, entry logic, or execution parameters appear to separate a strong performer from a losing one.
The report itself identifies parameter sensitivity as the likely differentiator. Until that sensitivity is mapped, we cannot know whether PID 13672 discovered durable market structure or simply occupied a fortunate point in parameter space.
There is also a selection problem. When 89 strategies are monitored, the top performer should not be treated as though it were the only hypothesis tested. A tournament with many entrants will produce a leader even when much of the variation is noise.
The more strategies, parameters, contracts, and variants examined, the greater the risk of crowning a winner whose apparent edge does not survive the next sample.
This is often called the winner’s curse: the strategy that looks best in a large search may be benefiting from both genuine skill and favorable selection.
None of this erases the result. It changes what the result means.
The session answered:
“Which configuration performed best during these particular 24 hours?”
It did not answer:
“Which configuration will remain profitable after costs, across regimes, and during the portfolio’s worst moments?”
Those are radically different questions.
Even the session’s headline figures require reconciliation. The executive summary describes 20 ZN wins across four instances, while the detailed leaderboard contains additional ZN instances and a larger total when its rows are summed. That does not invalidate the leading bot’s individual record, but it does mean the family-level narrative should not be used for allocation decisions until the underlying trade ledger is reconciled.
Likewise, aggregate simulated P&L of $496.17 is not, by itself, a return. Without capital, margin, notional exposure, and strategy-level attribution, it cannot tell us whether the fleet used risk efficiently—or how much of the gain came from ZN.
The session was useful. It was not conclusive.
2. ZN is not new, and a ZN position is not automatically a steepener
Before discussing portfolio protection, we need to be precise about the instrument.
ZN conventionally refers to CBOT 10-Year U.S. Treasury Note futures. It is an established futures market, not a newly invented financial instrument. What may be new here is the fleet’s particular implementation of a ZN-based strategy.
ZN’s price is sensitive to changes in Treasury yields. Broadly speaking, when the relevant yield falls, the futures price tends to rise; when the yield rises, the futures price tends to fall.
That relationship explains why Treasury duration can sometimes help during equity downturns. A growth scare or disinflationary shock may cause investors to expect easier monetary policy or seek high-quality government exposure. Falling yields can then produce gains in Treasury futures that offset losses elsewhere.
But “sometimes” is doing enormous work in that sentence.
A long ZN position is fundamentally an interest-rate exposure. It is not a contractual promise to rise whenever an equity portfolio falls. If stocks decline because inflation expectations, term premia, or real yields are rising, Treasury futures can decline too. A portfolio can then experience losses in both sleeves.
There is a second distinction: a single ZN position is not, by itself, a complete yield-curve steepener.
A steepener concerns relative movements between different parts of the yield curve. It is generally implemented using exposures at two or more maturities, with position sizes adjusted for their sensitivity to yield changes. The objective is to benefit from one segment moving relative to another—not simply from all yields moving up or down.
The supplied report includes labels such as “Yield Curve Steepener Composite,” “ZN leg,” and “Micro 10Y Steepener.” Those labels do not disclose enough to reconstruct the actual exposures.
We do not know from the summary:
Which other contracts, if any, formed the curve position;
Whether the strategy was long or short duration at entry;
How the legs were weighted;
Whether the position was approximately neutral to parallel yield movements;
How carry and contract rolls were treated;
Whether “micro” described the implementation, position size, or strategy name;
Whether the reported ZN trades represented complete curve trades or only one leg; or
How the strategy behaved when one leg filled and the other did not.
That matters because two trades can both be called steepeners and respond very differently to the same market move.
A bull steepener generally involves shorter-maturity yields falling relative to longer-maturity yields. A bear steepener is associated with longer-maturity yields rising relative to shorter-maturity yields. A ZN leg may benefit in one environment and lose in another—even if the curve steepens in both cases.
The word “composite” adds another layer of uncertainty. It could describe a genuine multi-signal curve model, or simply a collection of entry filters. Without the position ledger, there is no way to determine which risks actually generated the returns.
The durable insight is therefore not “ZN always protects.”
It is:
Rates and curve exposures offer a different source of returns from equity momentum or gold safe-haven logic. That difference may be valuable.
Valuable diversification is a realistic research objective. Universal protection is not.
3. The downside-protection test is harder than a win-rate test
A desirable hedge does not merely make money on average. It must improve the portfolio under the conditions that motivated the hedge.
Imagine two strategies.
Strategy A makes small gains frequently during calm markets but suffers large losses during equity crises. Strategy B loses modest amounts in normal conditions but produces substantial gains during a small number of severe downturns.
Strategy A could have the higher standalone win rate. Strategy B could still be the better hedge.
That is why the ZN result cannot establish hedge quality without portfolio-level data. The report contains no hedged portfolio returns aligned with the ZN trades, no conditional crisis performance, no hedge ratios, and no measurement of drawdown reduction.
It tells us how selected strategies performed. It does not tell us what they protected.
Visualization 2: Why no single Treasury exposure works in every downturn
Market environment Risk assets Treasury-yield behavior Possible ZN response Curve-strategy implication Growth scare or disinflationary flight to quality Often fall Yields often fall Long ZN exposure may provide an offset Depends on relative movement across maturities Inflation or term-premium shock May fall Yields often rise Long ZN exposure can lose alongside equities A bear-steepening position may behave very differently Fed-easing or bull-steepening episode Mixed Yields often fall unevenly Directional ZN exposure may help Relative-value positioning may be more important than direction Risk-on recovery with rising yields Often rise Yields often rise Long ZN exposure may decline The overlay may create drag during the recovery Liquidity or margin crisis Volatile Relationships can become unstable Futures P&L may diverge from expectations Leg execution, basis, liquidity, and margin become critical
These are scenario tendencies, not forecasts or guaranteed relationships.
The table reveals the central problem with the universal-hedge claim: “market downswing” is not one event.
A downturn caused by weakening growth is different from one caused by an inflation shock. A banking scare is different from a valuation reset. A slow earnings decline is different from a forced deleveraging event.
The same Treasury position can be helpful in one and harmful in another.
The upside requirement creates another complication.
If an investor owns equities and adds a Treasury futures overlay, the investor still owns the equities and can participate in their rally. But total portfolio performance includes both components. If equities rise while yields also rise, losses on the Treasury overlay can reduce some of that participation.
The net result may still be acceptable. It is not free upside capture.
A dynamically managed strategy may reduce that drag by changing exposure. Yet dynamic management introduces its own risks:
Whipsaw from repeated entries and exits;
Delayed reactions to overnight gaps;
Parameter instability;
Increased transaction costs;
Leverage and margin requirements;
Incomplete fills between curve legs; and
Model failure precisely when market relationships change.
Futures have linear payoffs. A strategy can trade them dynamically to pursue a more attractive return distribution, but it cannot guarantee permanent, costless convexity.
Claims of universal downside protection with full upside participation should therefore be treated as extraordinary claims requiring extraordinary evidence.
Fourteen closed trades are not that evidence.
4. The most dangerous number in the report is 71.4%
The 71.4% win rate is memorable, intuitive, and easy to circulate. It is also insufficient to determine whether the strategy has positive expected value.
Expected performance depends on both frequency and magnitude. A strategy can win frequently and still lose money if its occasional losses are large enough. Conversely, a strategy can lose most of its trades and remain profitable if its winners are substantially larger than its losers.
The supplied report does not provide the ZN strategy’s average winner, average loser, profit factor, per-trade return, maximum adverse excursion, or drawdown. We therefore cannot reconstruct its expectancy from the win rate alone.
A proper evaluation would look more like the following pseudocode:
FUNCTION evaluate_strategy(closed_trades, estimated_costs):

    winning_trades = SELECT trades WHERE net_pnl > 0
    losing_trades  = SELECT trades WHERE net_pnl < 0

    gross_profit = SUM pnl FROM winning_trades
    gross_loss   = SUM absolute_pnl FROM losing_trades

    average_win  = AVERAGE pnl OF winning_trades
    average_loss = AVERAGE absolute_pnl OF losing_trades

    net_pnl = SUM pnl FROM all closed trades
    net_pnl = net_pnl MINUS commissions, slippage, fees, and financing

    RETURN:
        net_pnl
        average_win
        average_loss
        largest_loss
        profit_factor
        maximum_drawdown
        return_on_margin
        return_on_notional_exposure
        performance_after_costs

END FUNCTION
This is not bureaucratic detail. It is the difference between an attractive leaderboard and an investable result.
The one historical ES bar trade illustrates the problem. It was classified as a win despite realized P&L of negative $2.58. That could reflect commissions, slippage, a breakeven classification, or an accounting error. Whatever the cause, it demonstrates that “win” and “profitable after costs” are not necessarily interchangeable in the current reporting system.
Sample size compounds the uncertainty.
Ten wins in 14 trials is more informative than two wins in two trials, but it still leaves substantial uncertainty about the underlying process. More importantly, the observations all came from the same short session. They may share market conditions, volatility, liquidity, and signal correlation.
Fourteen trades are not necessarily fourteen independent regime tests.
For a hedge, sample composition matters even more than trade count. The essential observations are rare by definition. A strategy could trade successfully for weeks without encountering the event it is supposed to protect against.
A quiet 24-hour session is particularly unlikely to contain a severe growth shock, inflation accident, forced liquidation, or rapid policy repricing.
The report’s observation that the strategy succeeded despite relatively tight ZNZ6 price action is interesting. It suggests the bot may have identified small opportunities without requiring a large directional move. But calm-market profitability is not evidence of crisis-market protection.
Extending the test to 72 hours or seven days would improve execution evidence. It would not magically create regime diversity.
The calendar length of a test matters less than the variety of market conditions it contains.
5. Parameter sensitivity is now the central research question
The ZN family did not produce one uniform result. It produced a spectrum.
Visualization 3: ZN performance varied sharply by implementation
ZN STRATEGY VARIANTS

PID 38988   ZN Micro Treasury Steepener
████████████████████████████████████████  100.0%   n=4

PID 13672   Steepener Composite
█████████████████████████████░░░░░░░░░░░   71.4%   n=14

PID 35116   Micro 10Y Steepener
███████████████████████████░░░░░░░░░░░░░   66.7%   n=3

PID 25976   Steepener, ZN leg
████████████████████████░░░░░░░░░░░░░░░░   60.0%   n=10*

PID 33192   Yield Curve Steepener
████████████████████░░░░░░░░░░░░░░░░░░░░   50.0%   n=4

PID 18896   Steepener Trend-Follow
█████████████░░░░░░░░░░░░░░░░░░░░░░░░░░░   33.3%   n=12

PID 20492   Yield Curve Bear Steepener
░░░░░░░░░░░░░░░░░░░░░░░░░░░░░░░░░░░░░░░░    0.0%   n=2*
Sample sizes and footnotes are taken from the supplied report. Small samples should not be compared as though they carry equal evidentiary weight.
This dispersion gives researchers a valuable clue.
If every ZN variant had performed similarly, the session might have supported a broad claim about the instrument or market environment. Instead, the results point toward configuration-specific behavior.
The report highlights trend-confirmation thresholds as a possible source of the difference. That hypothesis deserves testing, but it should not become a convenient post-hoc story.
Perhaps the winning instance used superior signal logic. Perhaps its exits were better. Perhaps it traded at more favorable times. Perhaps its winners happened to cluster in the session. Perhaps the simulated fills favored one execution pattern over another.
The research team should decompose the result before optimizing anything.
Useful questions include:
Did the top instance make money on both long and short exposures?
Were profits concentrated in a small number of trades?
Did entries cluster around particular times of day?
Did performance depend on holding period?
How often did the signal reverse shortly after entry?
Did exits create the high win rate by taking small profits quickly?
Were losses allowed to grow larger than winners?
Did the strategy benefit from favorable assumptions about forming bars?
Would the same signals have been available using only fully completed data?
How did performance change when parameters were moved slightly?
That final question is especially important.
A robust strategy usually has a neighborhood of reasonable parameter settings that produce broadly acceptable results. A fragile strategy often has one narrow peak surrounded by poor performance.
The objective should not be to find the single best threshold from the session. It should be to discover whether the strategy remains coherent when the threshold is imperfect.
The difference between PID 13672 and PID 18896 is therefore not an embarrassment to the ZN thesis. It is the most useful diagnostic information in the report.
6. The rest of the fleet warns against reading too much into labels
The gold and Nasdaq results reinforce the same lesson: strategy names are not sources of alpha.
Two Micro Gold safe-haven instances finished 2-for-2. Several others finished 0-for-2. A mean-reversion rotation instance went 1-for-2, while multiple trend, inflation, volatility-control, and institutional-flow variants failed to record a win.
The report reasonably suggests regime sensitivity, configuration drift, inappropriate triggers, or stops that were too tight relative to spreads and short-term volatility.
But the larger issue is conceptual.
Six bots with “safe haven” in their names do not necessarily provide six independent sources of protection. If they respond to similar price, dollar, or real-yield proxies, they may be variations of the same underlying bet.
The same warning applies to diversification across ZN instances. Running several parameterizations is operational diversification. It is not necessarily economic diversification.
The Nasdaq failure was more concentrated. PID 19996 went 0-for-6 despite high reported tick volume. That is sufficient reason to pause and investigate, but not enough to prove that its alpha has permanently decayed.
High activity does not validate a signal. A market can be active and still range-bound, noisy, or hostile to a particular momentum model.
Approximately 60 bots generated no trades at all. Their silence should also be interpreted carefully. It could indicate disciplined filtering, broken subscriptions, missing data, excessive thresholds, or simple lack of opportunity.
A no-trade bot is not automatically safe or healthy.
Visualization 4: A leaderboard is not an operational health report
Surface observation Possible interpretation Required verification Perfect 2-for-2 record Promising start or small-sample luck More independent observations and cost-adjusted P&L Zero wins in six trades Weak signal, bad regime, or execution defect Signal replay and adverse-excursion analysis No trades Discipline or no data Feed, subscription, and filter audit READY status Process is running Confirm that risk checks and data handlers actually execute Positive fleet P&L Profitable simulation Attribute P&L and measure capital and exposure Negative log age Recent activity or clock problem Synchronize clocks and validate timestamps
That last distinction is crucial because the session revealed significant technical debt.
At least eight bots logged an interface error involving an unexpected keyword argument in gate_check(). This suggests a breaking change in the gateway signature. The affected historical-bar bots may have been running without executing their intended risk checks.
Other defects included a slicing-related TypeError, missing market-data handlers, and failures in bar-close processing.
Multiple equity-index bots showed data ages exceeding 61,000 seconds—more than 17 hours—with stale bar status. Signals produced under those conditions should be treated as suspect.
Several bots also reported negative log ages, suggesting clock-synchronization problems between processes and the gateway.
These are not cosmetic issues. They undermine the reliability of the experiment itself.
Before any strategy is promoted, operational eligibility should be enforced independently of recent P&L:
FUNCTION permit_strategy_to_trade(bot, market_data, risk_gateway, clocks):

    IF market_data is stale beyond the strategy's approved limit:
        BLOCK new entries
        FLAG the data feed
        RETURN "stale data"

    IF the latest risk-check interface test failed:
        BLOCK new entries
        RETURN "risk gateway failure"

    IF position sizing or stop validation did not complete:
        BLOCK new entries
        RETURN "risk controls unavailable"

    IF clock offsets exceed the approved tolerance:
        BLOCK signal generation
        RETURN "clock synchronization failure"

    IF required bar-close or market-data handlers are unavailable:
        BLOCK new entries
        RETURN "handler failure"

    IF recent simulated profit is being used to bypass any control:
        REJECT the override

    OTHERWISE:
        PERMIT trading within approved exposure limits

END FUNCTION
A winning strategy running on unreliable infrastructure is not yet a winning system.
The report’s suggestion to consider reduced-size live deployment should therefore be treated as conditional, not automatic. Operational integrity, cost modeling, exposure reconstruction, and portfolio testing must come first.
7. What a serious ZN validation program would look like
The correct response to the session is neither blind promotion nor dismissal. It is a staged research program designed to falsify the strongest claims.
Stage one: Reconcile the data
Before extending the test, reconcile the executive summary, leaderboard, and underlying trade ledger.
The family-level ZN win count should be explained. Open, breakeven, and closed trades should be separated consistently. The ES trade classified as a win despite negative realized P&L should be investigated. Realized and unrealized results should not be mixed.
Every reported trade should be traceable to:
Its signal timestamp;
The market data available at that timestamp;
The intended order;
The simulated fill;
Commissions and slippage;
The complete position, including any curve legs;
Its exit reason; and
Its realized and unrealized P&L.
This is also the time to verify that no strategy used information from a forming bar that would not have been available at the simulated decision point.
If those records cannot be reconstructed, the result remains an interesting operational observation—not reliable performance evidence.
Stage two: Define the exposure
The team should document what the steepener actually owns.
Is it a directional Treasury trade with a curve-themed entry signal, or a relative-value position designed to isolate changes in curve slope? Does it have residual duration risk? How large is that risk? Does the exposure change through the trade?
Without this step, researchers cannot know which scenarios the strategy should survive.
A long-duration position, a curve-neutral position, and a dynamic mixture of the two require different stress tests.
Stage three: Measure economics, not just wins
Simulation should include conservative commissions, bid-ask spread, slippage, and leg-execution assumptions. Results should be reported in terms of net P&L, drawdown, exposure, and return on risk.
The average winner should be compared with the average loser. Tail losses should be examined individually. Profit concentration should be measured.
The strategy should also be tested with intentionally worse fills. If a small execution penalty eliminates the apparent edge, the strategy may be harvesting simulated microstructure rather than durable market behavior.
Stage four: Expand the regime sample
A seven-day paper-trading marathon is a reasonable next step for execution monitoring. It is not enough to establish universal protection.
Historical replay and out-of-sample testing should include, where data quality permits:
Growth scares;
Inflation shocks;
Rapid central-bank repricing;
Bull and bear steepening;
Bull and bear flattening;
Equity rallies accompanied by rising yields;
Equity declines accompanied by rising yields;
Quiet, range-bound Treasury markets;
High-volatility rate markets;
Contract rolls;
Liquidity deterioration; and
Periods when one curve leg cannot be filled as expected.
The objective is not to make the strategy profitable in every historical episode. No genuine strategy will be.
The objective is to identify when it loses, how much it loses, and whether those losses overlap with the portfolio risks it is supposed to offset.
Stage five: Test the combined portfolio
This is the stage most leaderboard-driven processes skip.
The ZN overlay should be evaluated alongside the actual portfolio it is intended to protect. Researchers should compare the portfolio with and without the overlay under matched scenarios.
FUNCTION evaluate_portfolio_hedge(base_portfolio, zn_overlay, scenarios):

    FOR each scenario IN scenarios:

        standalone_result = CALCULATE base_portfolio outcome
        overlay_result    = CALCULATE zn_overlay outcome
        combined_result   = COMBINE both outcomes
        combined_result   = INCLUDE margin, financing, and trading costs

        RECORD:
            change_in_total_return
            change_in_maximum_drawdown
            change_in_worst_period_loss
            behavior_during_recovery
            additional_margin_required
            cost_of_maintaining_the_overlay

    IF protection appears only during growth shocks:
        CLASSIFY overlay as "regime-specific crisis diversifier"

    IF overlay repeatedly loses during equity downturns:
        REJECT the claim that it is a dependable equity hedge

    IF overlay reduces drawdowns but creates substantial recovery drag:
        REPORT the tradeoff rather than calling it free protection

    IF results depend on one optimized parameter setting:
        CLASSIFY evidence as fragile

    RETURN scenario-level evidence, not a universal protection label

END FUNCTION
Only after these stages should small live deployment even enter the discussion—and then as an execution experiment with predefined loss limits, not as validation of a universal hedge.
Visualization 5: The evidence funnel
ONE GOOD SIMULATED SESSION
            │
            ▼
RECONCILED TRADE LEDGER
            │
            ▼
VERIFIED OPERATIONAL CONTROLS
            │
            ▼
COST-ADJUSTED STRATEGY ECONOMICS
            │
            ▼
OUT-OF-SAMPLE AND MULTI-REGIME TESTING
            │
            ▼
PORTFOLIO-LEVEL DOWNSIDE AND RECOVERY ANALYSIS
            │
            ▼
LIMITED, PRE-SPECIFIED DEPLOYMENT DECISION

The session has completed the first step.
It has not completed the funnel.
8. The hedge scorecard should measure tradeoffs, not perfection
A credible ZN research report should replace the question “Did it win?” with a broader scorecard.
Dimension Question that must be answered Downside protection Did the overlay reduce losses during the specific events it targets? Upside participation How much portfolio return did it sacrifice during strong recoveries? Tail behavior What happened during its worst trades and worst combined-portfolio periods? Regime dependence Which rate and curve environments helped or hurt? Cost Did the edge survive commissions, spread, slippage, financing, and roll? Liquidity Could both exposure and curve legs be adjusted under stress? Margin Did the overlay create additional funding needs during adverse markets? Robustness Did reasonable parameter changes preserve coherent behavior? Operational reliability Were signals, timestamps, risk checks, and fills trustworthy? Portfolio contribution Did it improve the combined portfolio after all tradeoffs?
This framework makes room for a genuinely valuable result that is less glamorous than the original claim.
Perhaps the ZN strategy proves to be a strong calm-market trading system but a poor crisis hedge. That would still be useful, provided its economics and risks are understood.
Perhaps it proves to be a modest standalone performer that materially improves a growth-sensitive portfolio during disinflationary shocks. That could be extremely valuable, even without a spectacular win rate.
Perhaps it works only as a tactical relative-value strategy and should never be described as portfolio insurance.
All three outcomes would be legitimate research findings.
The worst outcome would be to force the evidence into a universal-hedge narrative because the leaderboard makes that narrative emotionally appealing.
9. What role could ZN realistically play?
The strongest plausible role is regime-aware diversification.
Rates strategies can respond to economic forces that differ from those driving equity momentum, technology inflows, or gold accumulation. That makes them potentially useful components of a broader research and portfolio framework.
But diversification should be evaluated by economic exposure, not by the number of bots or the variety of their names.
A portfolio containing ten highly correlated safe-haven gold variants may be less diversified than one containing a smaller number of genuinely distinct exposures. Similarly, several ZN parameterizations may represent one shared rates thesis rather than independent protection.
The size of any overlay also matters. A useful diversifier can become a new source of risk if its leverage, duration, or curve exposure is too large. Futures make efficient exposure possible; they also make underestimating notional risk easy.
The hedge horizon must be specified as well. Protection against a one-day risk event is different from protection against a prolonged drawdown. A strategy optimized for five-minute bars should not automatically be credited with solving a six-month portfolio problem.
Finally, the hedge must be defined relative to what is actually owned. ZN’s relationship with a Nasdaq-heavy portfolio may differ from its relationship with small-cap equities, credit, commodities, or another fixed-income allocation.
Before calling the steepener a hedge, the research team should be able to complete this sentence:
“This overlay is intended to reduce a defined loss measure in a defined portfolio during defined market events, over a defined horizon, while accepting a specified cost and risk budget.”
Until that sentence exists, “universal protection” is not a testable proposition. It is marketing language.
Conclusion: Promote the research, not the myth
The paper-trading session accomplished something valuable.
It identified a clear leader, exposed substantial parameter sensitivity, revealed extreme dispersion among gold strategies, and surfaced operational defects that a P&L report alone might have hidden. The top ZN instance deserves extended investigation because its 10-win, four-loss record is more interesting than the fleet’s many tiny perfect samples.
But the session did not demonstrate that ZN can universally protect against downswings while preserving upside.
It did not establish positive expectancy after costs. It did not measure drawdowns or tail losses. It did not reconstruct the complete curve exposure. It did not test the strategy across distinct rate regimes. And it did not show how the strategy would change the performance of an actual portfolio during a crisis.
Most importantly, it did not overturn the fundamental economic problem: different downturns require different protections, and upside participation usually involves a cost, a risk, or both.
The rational next step is therefore to extend the experiment, repair the infrastructure, reconcile the trade ledger, and evaluate the strategy at the portfolio level.
Not to crown a new universal instrument.
The best possible outcome is not that ZN becomes a magical hedge. It is that the team discovers exactly where the strategy works, where it fails, what it costs, and which portfolio problem it genuinely solves.
That knowledge would be far more durable than a 71.4% headline.
All results discussed are from simulated or paper trading. Simulated performance has limitations and does not guarantee future results. Futures involve leverage and substantial risk. This article is a research evaluation, not a recommendation to trade or deploy capital.