


Educational analysis only. This is not financial advice, a recommendation or an offer to trade anything. Every price, strike and probability below is either sourced to a named outlet or labelled illustrative. Trading futures and options can lose more than you put in.
Monday, November 16, 2026: three markets, three different stories
Three markets are telling three different stories today, and each one lines up with a rules-based micro-futures bot that I have been studying.
Bitcoin is in a six-week slide. It fell to about $62,100 on Sunday, its lowest level since July 14, after roughly $2 billion of mostly long liquidations over the weekend, according to CoinDesk. By Monday afternoon it had recovered to around $64,000 to $65,400, depending on the venue and the minute you check. US spot bitcoin ETFs have lost about $1.91 billion over seven straight sessions, and perpetual-futures funding is negative for most coins, which is the footprint of bearish positioning rather than euphoria.
Gold is in the middle of a very different kind of drawdown. Spot gold touched about $3,830 on Monday, its lowest since October 2025, and is roughly 31% below the record of about $5,590 set on January 28. The cause is not a lack of fear in the world. It is the bond market. The 10-year Treasury yield sits near 5.15% after a 29.5 basis point weekly surge, the dollar index is near a 19-month high around 103.5, and futures price a December Fed hike at roughly 92% to 95%, according to Investing.com, CNBC and Reuters.
Crude oil is stuck between a war and a spreadsheet. The war is the US-Israeli conflict with Iran, now in its ninth month, with fresh tanker mine incidents in the Strait of Hormuz and an Iranian strike on a base in Bahrain over the weekend. The spreadsheet is the International Energy Agency, which on Friday flipped its fourth-quarter view from deficit to surplus: supply of about 105 million barrels per day against demand 1.7 million barrels per day lower. WTI settled around $85.72 and Brent around $92.44 on Monday, per Newsquawk, extending a slide that Reuters said had already taken 13% off WTI and 16% off Brent in a single earlier week.
I came to these markets through three Python trading bots and seven PDF reports a trader generated on the morning of November 16. One bot shorts micro Bitcoin futures, one buys micro gold futures, and one buys micro WTI crude futures. The PDFs contain a long macro news-flow analysis, a “term sheet” of backtest results, an options-chain study, a trading-rules reference and a handful of summaries.
This article is not a review of those bots, and it is certainly not a promotion of their results. As I will show in the data-quality section, the backtest numbers in the PDFs are broken in ways that make them unusable. Instead, I use the bots as a lens. Each bot encodes a thesis about one instrument. My job here is to ask the harder questions the bot cannot ask of itself:
What do the fundamentals say about that thesis today?
What does the technical picture say about where price is relative to the thesis?
What does the volatility market imply about the range of outcomes?
Which futures, options and crypto instruments could express the view, with what payoff, breakeven and risk?
What happens when you hold all three at once?
You will find 34 charts, 25 numbered equations and a lot of plain-language explanation. If you only want the punchline, here it is:
Bitcoin: the short thesis is aligned with the tape, but the options market has already priced a lot of fear, so the best expression may be defined-risk spreads rather than naked short futures.
Gold: the long thesis is currently fighting the dominant driver, which is real rates and the dollar. Whether it works depends on what Fed Chair Kevin Warsh and the October FOMC minutes say this week.
Crude: the long thesis is a bet on a risk premium that the market is actively discounting. The volatility is large and the distribution is two-sided, so convexity matters more than direction.
The book: gold is the biggest risk contributor by far, even though the Bitcoin position gets the headlines.
What the three bots are, conceptually
The owner’s trading rules are proprietary, so I am deliberately not reproducing thresholds, weights, parameters or code. What I can describe is the architecture, which is common to a lot of systematic futures trading.
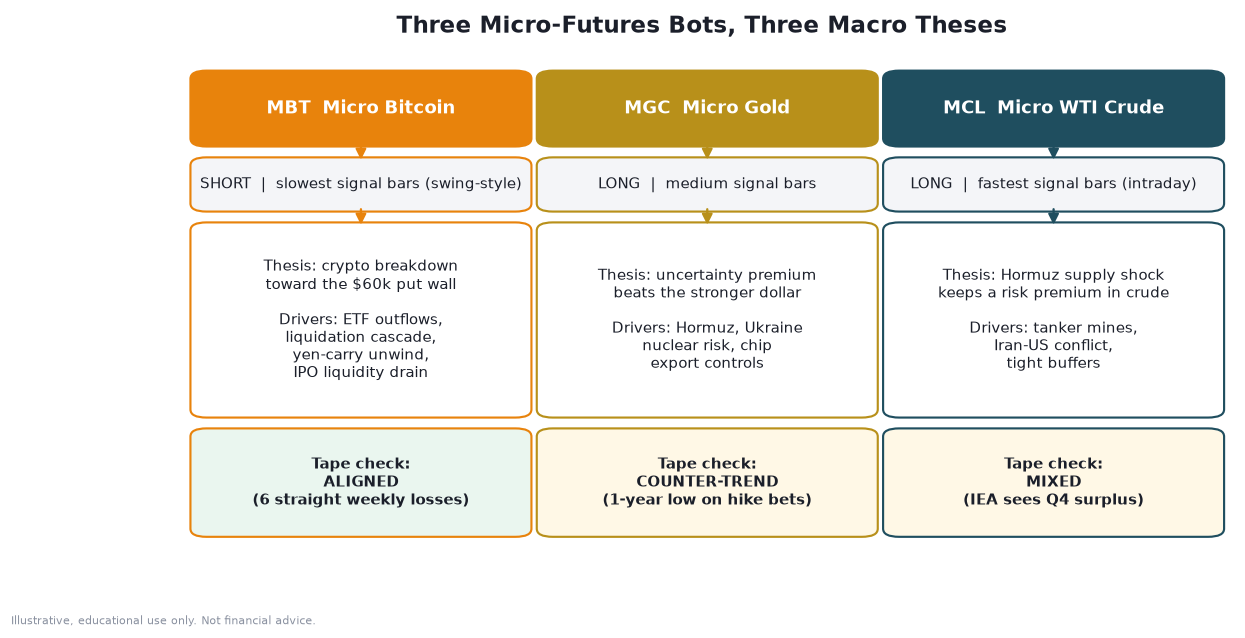
The Bitcoin bot (MBT, CME Micro Bitcoin futures) is a short-only breakdown strategy. Each contract is 0.1 BTC. Its thesis, taken from the accompanying report, is that crypto is breaking down toward the $60,000 area on a combination of ETF outflows, a collapse in total crypto market capitalization to roughly $2.16 trillion, a 28% two-week drop in Ether, an unwinding of yen-funded carry trades, and a liquidity drain from the November 18 Anthropic IPO. It works on the slowest bars of the three bots, which makes it the most swing-like. The signal is a composite of trend, momentum, breakout and volume, and it only trades when price is below a slower trend measure. Position size scales down when its volatility estimate rises.
The gold bot (MGC, COMEX Micro Gold futures) is a long-only strategy built on what the report calls the “uncertainty premium”: the idea that geopolitical risk (the Iran blockade, rising nuclear-accident warnings in Ukraine, and US export controls on AI chips) will push gold higher even against a stronger dollar. Each contract is 10 ounces. It uses medium-speed bars, and its composite score includes an explicit macro bias term that rises with realized volatility and positive trend persistence. That is an unusual feature: part of the entry decision is the author’s narrative, encoded as a number.
The crude bot (MCL, NYMEX Micro WTI futures) is a long-only “supply-shock momentum” strategy. Each contract is 100 barrels. It runs on the fastest bars of the three, blending its own strategy score with a shared momentum module. The thesis is the Hormuz disruption and the redirection of Chinese refiners toward Iraqi barrels.
What all three have in common is a skeleton you can see in the diagram below. Market data becomes a handful of features, those features are blended into a score, the score passes through a series of gates (stale quotes, wide spreads, volatility, session and maintenance windows), and a volatility-scaled position size is chosen under a hard contract cap. Exits come from a volatility-based stop, a one-way trailing stop, a reward-to-risk target and a time stop. Wrapped around everything are circuit breakers that stop trading after losses.
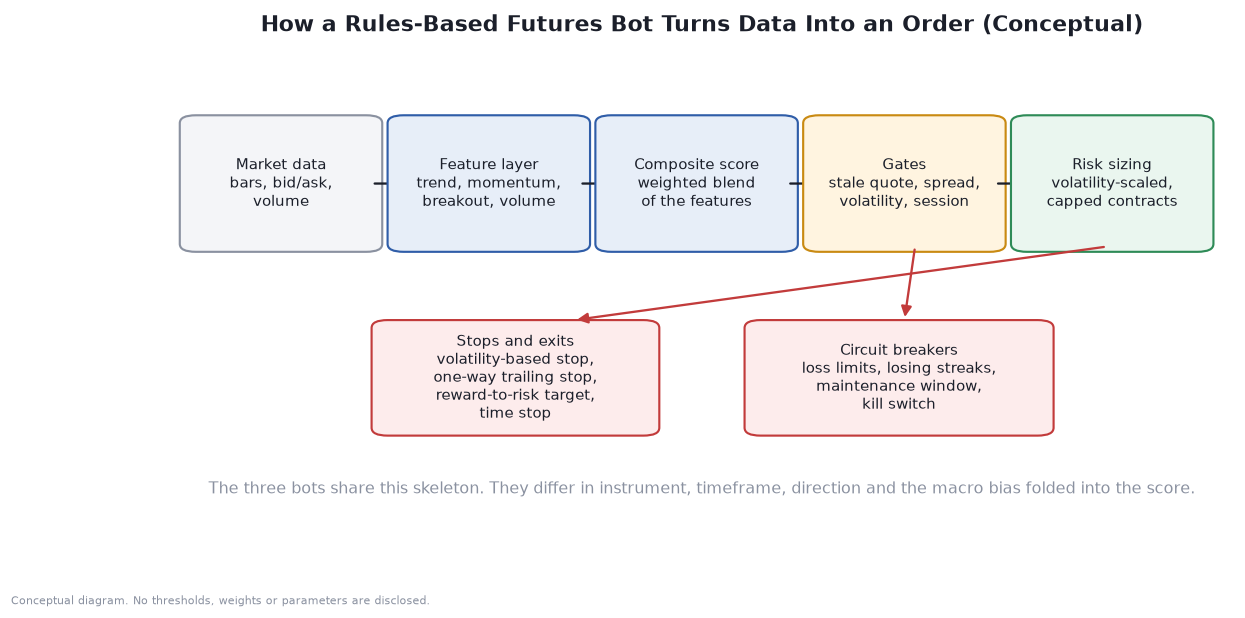
Two observations matter for everything that follows.
First, the three theses are not equally supported by the tape today. The Bitcoin short is aligned with price action. The gold long is counter-trend, because gold just made a one-year low. The crude long is in the middle: oil is falling on a Monday of active Gulf escalation, which Newsquawk called the more informative pattern because supply-risk headlines failed to lift prices. Because these bots demand trend alignment before they act, a counter-trend thesis is not the same as a counter-trend trade. A trend filter is precisely the mechanism that keeps a “bullish gold” narrative bot flat while gold is falling.
Second, the source report was generated by an AI model and includes its own “thinking” notes, some of which are muddled. For example, the model wrestles at length with which CME ticker belongs to the offshore yuan contract. I treat that report as a list of themes and claims to check, not as a source of truth.
The quant toolkit in one page
Before the instruments, the math. I will keep it light and tie every formula to a number you can verify.
Price as a random walk with volatility
The workhorse model for a futures or spot price is geometric Brownian motion (GBM). It says that the percentage change in price over a tiny time step has an average drift and a random shock whose size is set by volatility.
Here S is the price, μ is the drift, σ is annualized volatility and W is a Wiener process, the mathematical name for the random shock. Solving this equation gives the price at a future time T as a lognormal variable, so prices cannot go negative and percentage moves are symmetric in log terms.
The term minus one half σ squared is the convexity correction: it is why the median outcome is below the mean. For Bitcoin at 44% volatility over 30 days, σ²T/2 is about 0.8%, which is small, but at 50% volatility over a year it is 12.5%. Remember this when someone says “the average return is X”.
GBM is wrong in every market we discuss, because real returns have fat tails and volatility clusters. It is nonetheless the language of options pricing, so we use it as a baseline and then correct for its flaws using skew and scenario analysis.
Realized versus implied volatility
Volatility comes in two flavors. Realized volatility is what happened. You compute it from log returns.
N is the number of periods per year (365 for crypto’s daily closes, 252 for most traditional daily data), n is the number of returns in the window, and r-bar is their average. Using the 31 daily Bitcoin closes from October 16 to November 16 published by ChainRegistry, I get a daily standard deviation of 2.26% and an annualized realized volatility of about 43.3%. Implied volatility is what the options market charges for the future, and it is quoted in the same annualized units. Deribit’s DVOL index for Bitcoin reads 44.0 today. That means Bitcoin options are priced almost exactly at the volatility Bitcoin just delivered. Notice what that implies: after a 22.6% peak-to-trough fall in 26 days, the market is not paying a panic premium for the at-the-money options, though it is paying one for puts, which we will see below.
The expected move
The most useful single number in options is the one-standard-deviation expected move. If volatility is annualized, the distribution of log price changes over a horizon of T years has standard deviation σ√T, so:
T is measured in years, so seven calendar days is 7/365. For Bitcoin at $64,500 and 44% implied volatility, the one-week expected move is $64,500 × 0.44 × √(7/365) ≈ $3,930, or ±6.1%. For 30 days it is about ±$8,140, or ±12.6%. Roughly two thirds of outcomes should land inside one standard deviation and about 95% inside two, if the model is right. It is a yardstick, not a forecast.
Z-scores: how unusual is a move?
A z-score converts any observation into “how many standard deviations from normal”.
Here x is today’s value, and μ_L and σ_L are the mean and standard deviation over a lookback window. Bitcoin’s worst daily drop in the 31-day window was −6.1%. Against a daily standard deviation of 2.26% that is roughly a −2.7 z-score move, which would be a 1-in-300 event if returns were normal and is, in crypto, merely a Thursday. This is the first hint that fat tails matter.
Range and momentum features
Most systematic bots use a handful of standard technical features. Three of them are worth writing down because I will use them in the technical sections.
The average true range, or ATR, measures how far an instrument typically travels in one bar, including gaps:
H, L and C are the high, low and close of a bar. ATR is the natural unit for stop distances because it adapts to the instrument and to the volatility regime.
The relative strength index, RSI, compares average gains to average losses over a window:
An RSI near 70 or above is commonly read as stretched upward and near 30 or below as stretched downward, though in strong trends it can stay pinned for weeks.
Finally, many systems blend several such features into one number. A composite score is simply a weighted average of individual component scores, each scaled to a common range:
The weights w are the designer’s judgement, and I am not disclosing the owner’s. The principle is what matters: no single feature decides, and a threshold on the blended score gates the entry.
Sizing and expectancy
Position size should come from the risk you are willing to lose, not from conviction. A volatility-scaled sizing rule looks like this:
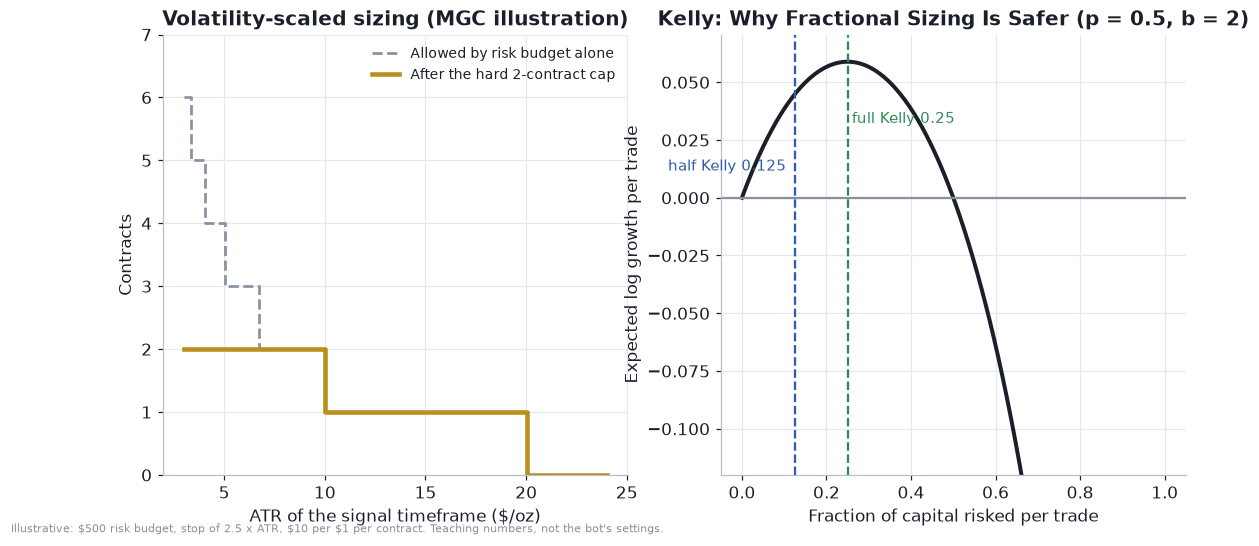
C is account capital, ρ is the fraction of capital risked on one trade, k is the stop distance in ATR multiples, M is the contract multiplier in dollars per point, and a_vol is a scaling factor that cuts size when volatility is elevated. The floor function rounds down, which means you trade fewer contracts when in doubt, and N_max is a hard cap. When volatility doubles, ATR doubles, the stop widens, and the number of contracts you can afford halves. That is the entire point.
Whether a strategy deserves to trade at all depends on its expectancy, the average profit per trade measured in units of initial risk, which traders call R.
p is the win rate, W-bar is the average winner in R, and L-bar is the average loser in R. A 40% win rate with a 2.5R average winner and 1R average loser has an expectancy of 0.4 × 2.5 − 0.6 × 1 = +0.4R per trade. A 60% win rate with a 0.5R average winner has −0.1R. The win rate alone says nothing.
Bitcoin: the short that the tape already agrees with
Fundamentals: why the market is bleeding
Start with what is verifiable. CoinDesk reported on Monday morning that Bitcoin had rebounded from a Sunday low of $62,100, the lowest since July 14, and was trading near $64,300. It had fallen for six consecutive weeks, the longest losing streak since the end of February. Roughly $2 billion of leveraged positions were liquidated over a 24-hour weekend window, the large majority of them longs. US spot ETFs have bled about $1.91 billion across seven straight sessions according to Farside Investors data cited by CoinDesk. Futures trading has cooled after the flush, with funding rates negative on most coins.
Volmex founder Cole Kennelly attributed the nervousness to a run of negative headlines: exchange security worries, AI-related market uncertainty and a tougher regulatory outlook. Volmex’s 30-day Bitcoin implied volatility index, BVIV, jumped to 57.13 on Sunday, its highest since June, and then eased back to 44.
The source report that feeds the bot adds a longer list of themes. It cites a crypto total market capitalization collapse to about $2.16 trillion, Ether falling roughly 28% in two weeks to around $1,824 (Fortune had it near $1,796 on Monday morning), the unwinding of yen-funded carry trades after Japan’s economy stalled, a feud between large exchanges, credit products backed by crypto collateral in Latin America, and the pending November 18 Anthropic IPO, which it argues could drain liquidity from speculative assets. It also notes continued buying by corporate “treasury” holders, which matters because those buyers have, until now, been an offsetting bid. I cannot independently verify every item on that list, so I treat the report as a map of narratives rather than a measurement.
Three mechanisms connect those headlines to price, and they are worth separating:
Flow. ETF redemptions mean authorized participants sell spot Bitcoin to meet outflows. Seven straight days of outflows is a persistent, price-insensitive seller.
Leverage. Liquidations are forced selling. After a flush, open interest falls and funding turns negative, which resets the positioning that fuels further cascades. That is bullish for short-term rebounds and bearish for the thesis of an orderly grind lower.
Macro liquidity. A hawkish Fed with a 10-year yield above 5% raises the discount rate on every long-duration asset, and Bitcoin trades like one. If the December hike happens, real-rate pressure on crypto continues. Tech sentiment matters too: the Nasdaq-100 volatility index is at the 98th percentile of its one-year range, and Bitcoin has been moving with growth equities.
Technical picture
The daily path tells a clear story. Bitcoin peaked at about $84,100 on October 21, then stair-stepped down. It lost 5.8% on November 5, broke through $75,000, lost another 3.5% and 4.5% on November 12 and 13, and then dropped 6% on November 14 to close near $64,200. It has chopped between $64,000 and $65,500 since.
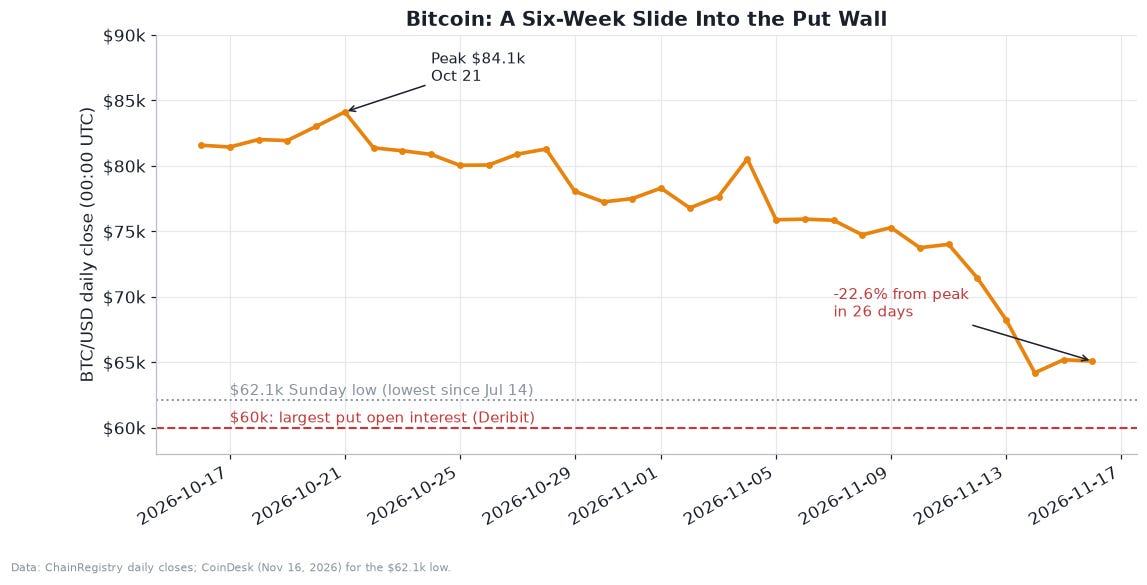
From peak to trough that is a 22.6% decline in 26 days. For a short, the key question is where the next decision point lies. The options market answers it directly: the largest single options position on Deribit is now a put at the $60,000 strike, with about 12,900 BTC of open interest, worth roughly $833 million to $900 million in notional depending on the source. Above the market, large call open interest sits at $80,000 and $90,000, and the maximum-pain strike for the $6.4 billion November 27 expiry is $75,000. Maximum pain is the price at which option holders collectively lose the most. I would not trade on it, but it tells you where the expiry gravitational pull is supposed to be, and it is $10,000 above spot.
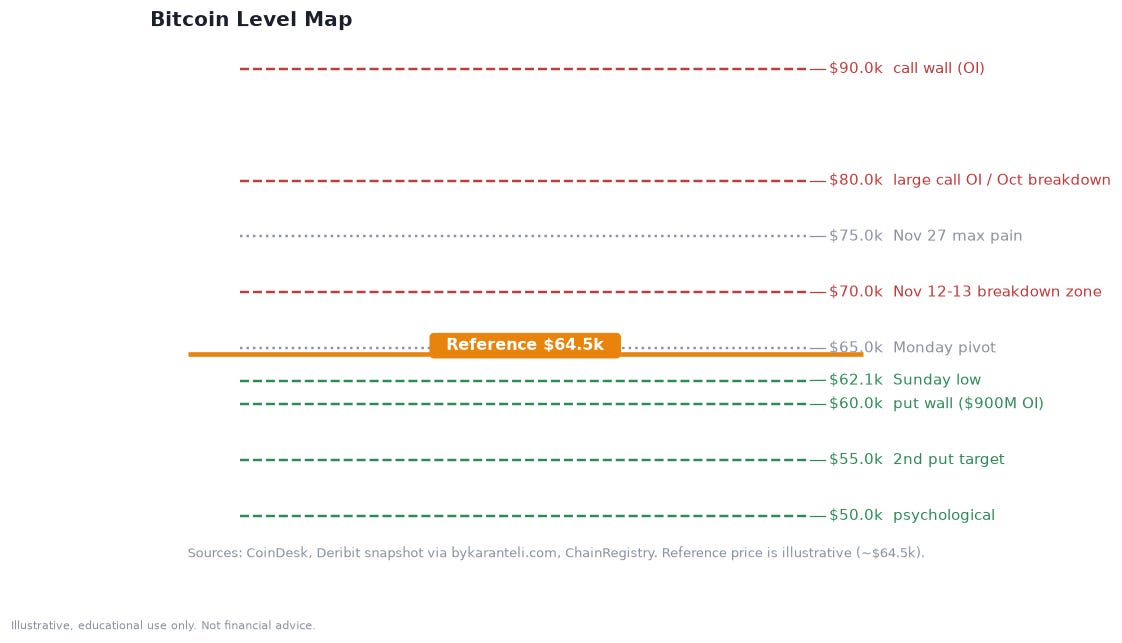
My technical read is as follows.
Trend: down. Lower highs and lower lows on the daily chart, with every bounce since October 21 failing below the previous breakdown level.
Support: $62,100 (Sunday’s low) first, then the $60,000 put wall, then $55,000 and $50,000 as round-number downside targets.
Resistance: $65,000 to $65,500 (Monday’s pivot), then the breakdown zone from $70,000 to $72,000, then $75,000.
Momentum: after a 22% drop in under four weeks, oscillators such as RSI are oversold, and that is a warning for fresh shorts. A bot that sells breakdowns will usually do best in the first leg of a move and worst in the snap-back. Oversold does not mean “buy”, but it does mean “do not chase”.
Volatility regime: elevated but not panicked. Realized 31-day volatility was about 43%, DVOL is 44, and BVIV has retreated from 57.
The volatility surface: fear lives in the front and in the puts
Here is where Bitcoin differs from most assets. Its options market is deep, global and open 24 hours a day, so you can read sentiment directly from the implied volatility surface.
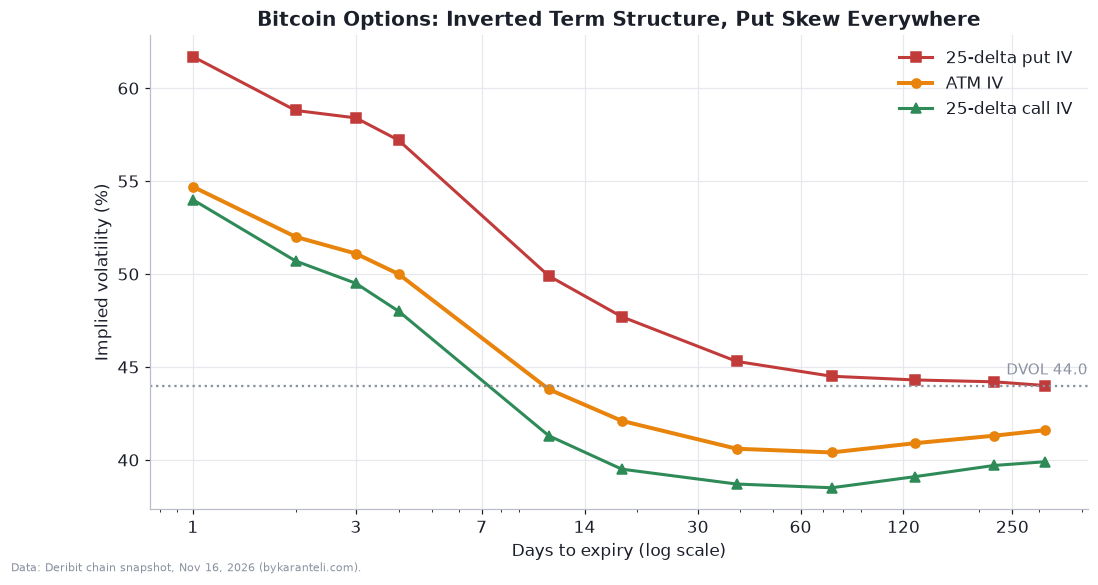
The term structure is inverted. A one-day at-the-money option trades near 54.7% implied volatility, a four-day option near 50%, the November 27 option near 43.8%, and options six months and longer sit near 41%. When short-dated implied volatility is higher than long-dated, the market expects turbulence soon that will normalize. In practice that is the weekend flush, Nvidia’s earnings on November 17, the Anthropic IPO and the FOMC minutes on November 18, and the weekly expiries. At the front, the market prices Bitcoin to move about ±4.9%, or ±$3,200, by the November 20 expiry.
Skew is the second feature. The 25-delta risk reversal, the call volatility minus the put volatility at the same delta, is negative everywhere:
For the November 20 expiry, the 25-delta put trades near 57.2% against 48.0% for the call, a 9.1 volatility point premium for downside protection. For November 27, the $60,000 put trades at 50.2% implied volatility against 40.6% for the $70,000 call. Derivasys noted that the 25-delta risk-reversal premium for puts narrowed across the curve over the weekend, which is a sign that the most acute demand for protection is easing.
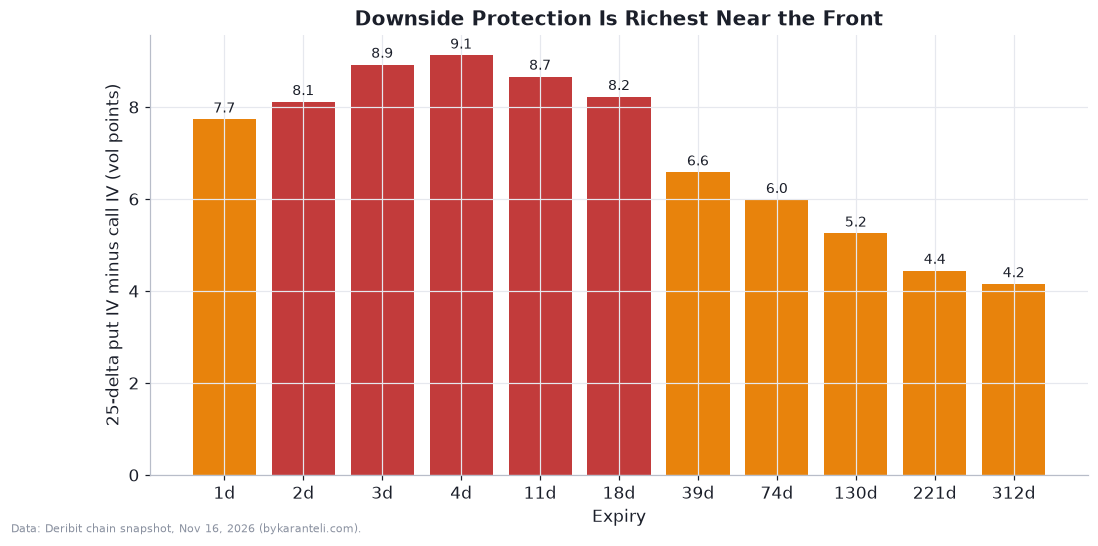
What does that tell a short seller? Two things. First, puts are expensive, so buying outright puts to express a bearish view costs more than the at-the-money volatility suggests. Second, the market has already paid for protection against exactly the scenario a short futures position profits from. The incremental surprise has to be bigger than what the skew has priced.
Quant: ranges, probabilities and the touch problem
At 44% implied volatility, the expected move calculation from the toolkit gives a clean cone. The shaded bands are one and two standard deviations of the lognormal distribution implied by equation 4 and the solution to the GBM equation.
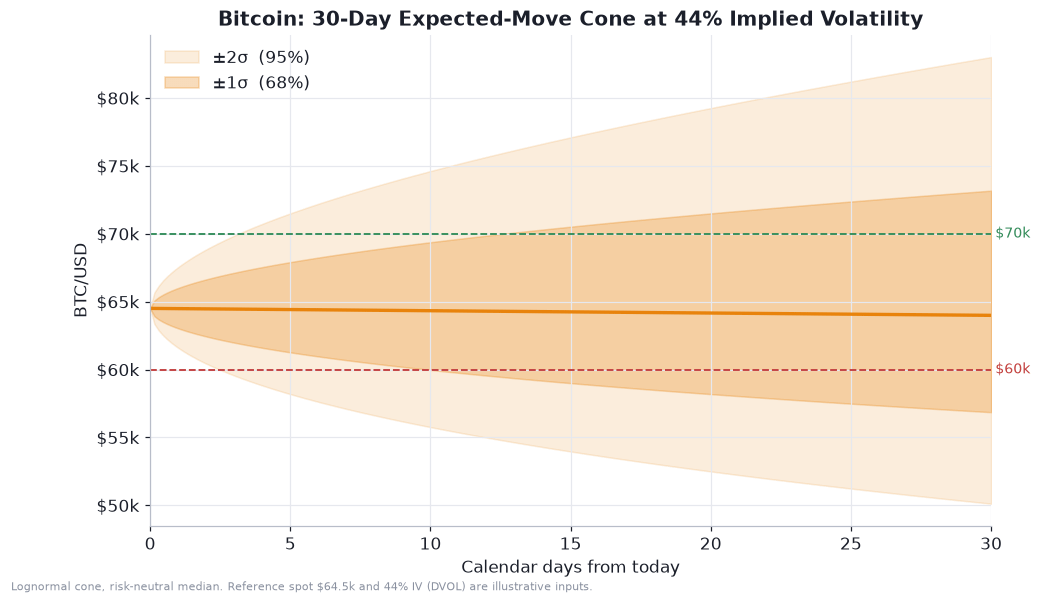
After 30 days the one-standard-deviation band runs from roughly $57,000 to $73,000 and the two-standard-deviation band from roughly $50,000 to $83,000. Using the lognormal distribution, I can attach probabilities to key levels. Under the risk-neutral measure, the probability that the price at expiry is below a strike K is:
where N is the standard normal cumulative distribution function. For K = $60,000, σ = 44% and T = 30/365, d₂ is 0.51 and the probability is 30.5%. If I use the 50.2% volatility the market charges at that strike instead, d₂ falls to 0.43 and the probability becomes 33.3%. The probability of finishing above $70,000 is about 23.8%. And the probability of finishing below $50,000 is only about 2.5%, or 2.5 × 10⁻² in scientific notation. A fall to $40,000 would be a 9.8 × 10⁻⁵ event under this model, which is exactly the kind of statement that real crypto history makes you suspicious of. The normal distribution of log returns underprices tail events, which is why the skew exists.
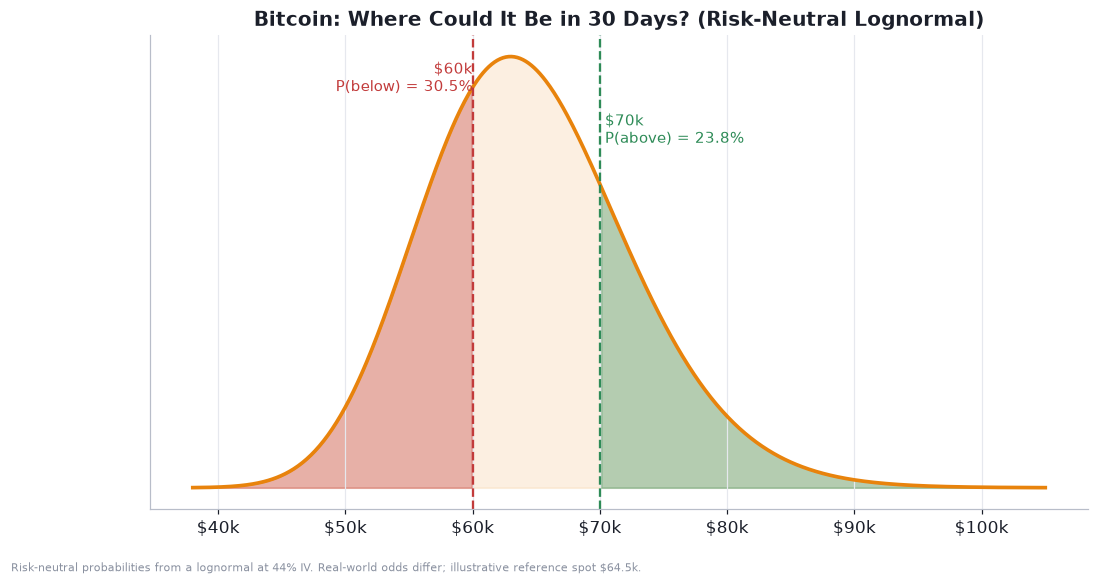
An important caveat applies to those numbers: they are risk-neutral probabilities implied by option prices, not real-world forecasts. They embed a risk premium, and they are most useful for comparing structures rather than for predicting outcomes.
A short seller also needs to understand barrier behavior, because a stop or a target is a barrier, not an expiry. The probability that price touches a level B at any time before T is approximately twice the probability of finishing beyond it:
With the same inputs, the probability of touching $60,000 in the next 30 days is about 57%, even though the probability of finishing below it is only about 30%. The probability of touching $70,000 is about 52%. Both sides of the range are more likely to be visited than settled in, which is why tight stops on a high-volatility asset get hit so often and why trailing a stop that only moves in your favor is common.
The position: what 2 micro contracts really are
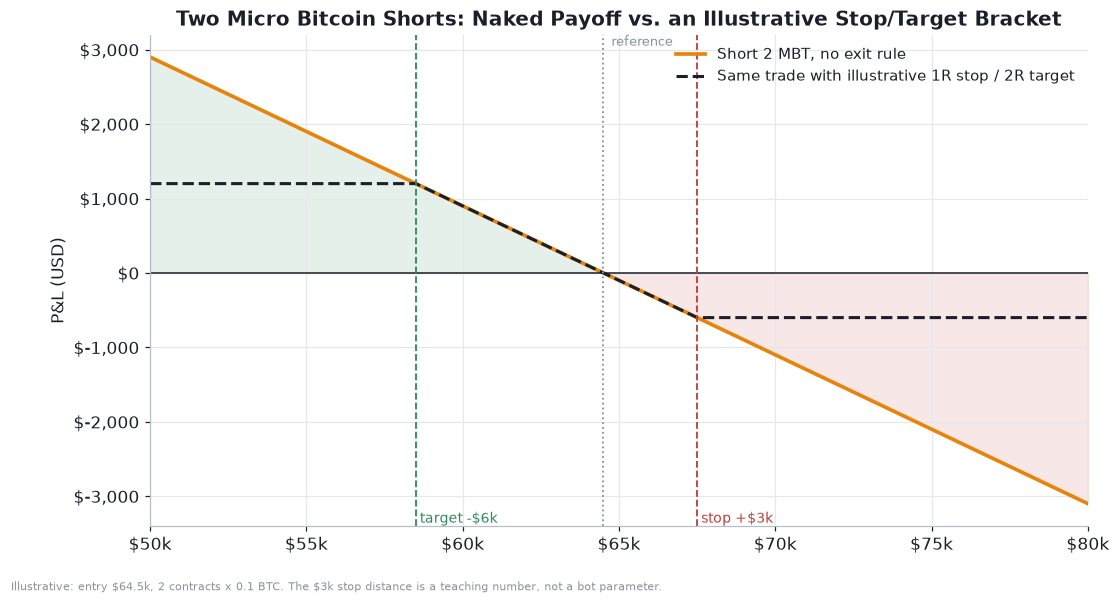
The bot’s cap is two micro contracts. Each is 0.1 BTC, so the position is 0.2 BTC, or about $12,900 of notional at $64,500. The tick size is $5 per bitcoin, or $0.50 per contract. A $1,000 move in Bitcoin changes the position’s value by $200. The one-week one-standard-deviation move, $3,930 per coin, translates to roughly ±$786 on the position. That is small for a $9,000 to $25,000 account, depending on which PDF you believe. A sizing rule such as the one in equation 9 is not the binding constraint here. The contract cap is.
The illustrative payoff below shows the position unmanaged and with an example stop and target bracket.
How to express a bearish Bitcoin view: crypto, futures and options
Spot and exchange-traded products. You cannot short spot Bitcoin directly without borrowing it. The accessible alternatives are inverse or put-based ETF strategies, put options on spot Bitcoin ETFs where you have access, and simply holding less. For someone who owns Bitcoin, the question is whether to cut exposure or hedge it.
Perpetual futures. Offshore perpetual swaps are the deepest liquidity pool and let you short with leverage and no expiry. The cost is the funding rate. With funding negative on most coins today, shorts pay longs. That is a real carry cost for a short held for weeks, and it is a crowding signal: when shorts are paying to stay short, a squeeze is cheap to ignite. The other risks are exchange risk, the headlines mention exchange security worries, and liquidation mechanics that can close you out before your thesis plays out.
CME futures. A futures contract’s fair price reflects the cost of carry, which for a non-yielding asset with storage costs is:
Here r is the financing rate, u is storage or other holding costs (essentially zero for Bitcoin) and y is any convenience yield (zero). The annualized basis is (F/S − 1)/T. For a pure directional short, a futures price above spot (contango) is a small tailwind, because that premium decays to zero as expiry approaches. Check the live basis on your broker’s screen, since I could not source a reliable current figure. CME’s micro contract (0.1 BTC) is the right size for a small account and avoids the exchange-counterparty risk of perps. The standard CME contract (5 BTC) is the vehicle for options on futures.
Options. This is where structure matters. Pricing options on a futures contract uses the Black-76 model, which is Black-Scholes with the futures price in place of the spot:
The sensitivities of those prices, the Greeks, are what you actually manage. For a call, with φ the standard normal density:
Delta is the change in option value per dollar move in the underlying. Gamma is how fast delta changes. Vega is the change per one unit of volatility, which I quote per volatility point. Theta is the daily time decay. A put’s values follow from put-call parity.
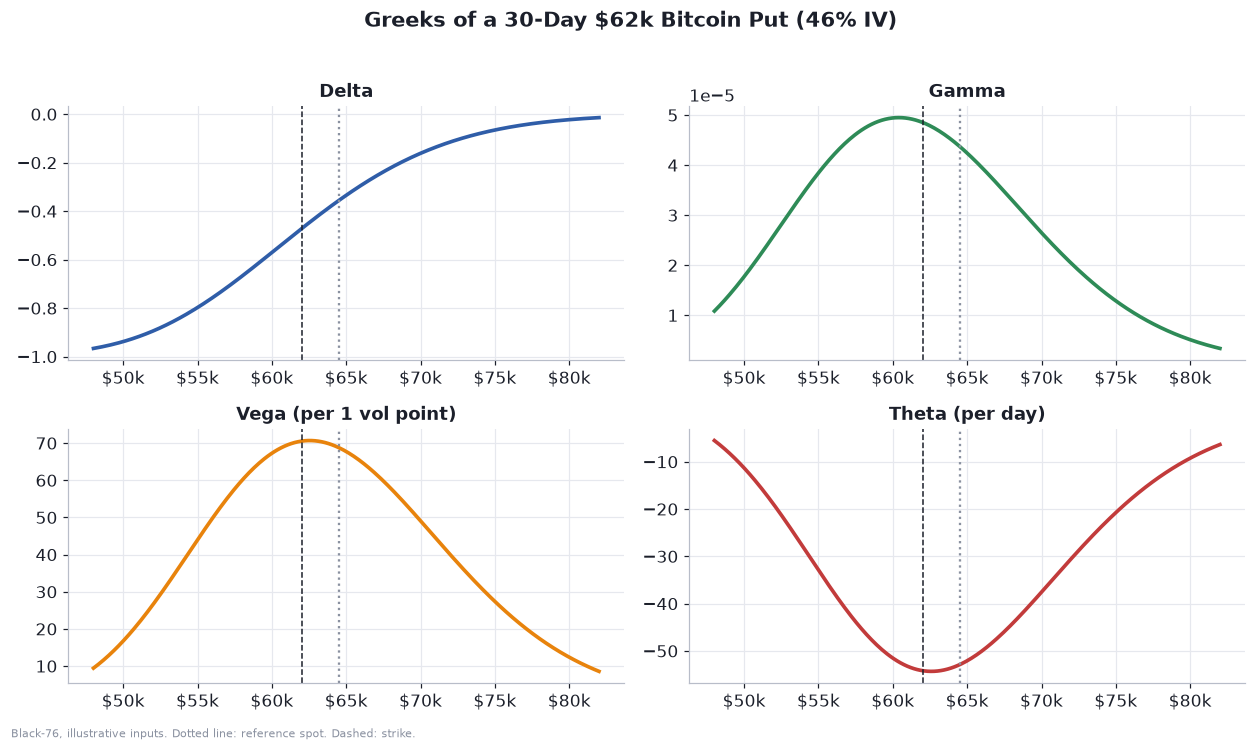
For a 30-day $62,000 put on one bitcoin at 46% implied volatility, with a 4% rate and spot of $64,500, the model gives a delta of about −0.356, a gamma of about 4.4 × 10⁻⁵ per dollar, a vega of about $68.8 per volatility point and a theta of about −$52.9 per day. Those numbers say: this put behaves like a 0.36 short in Bitcoin today, gets more bearish quickly as price falls, gains about $69 if volatility rises one point, and loses about $53 a day if nothing happens. To mirror the delta of a 0.2 BTC short, you would need about 0.56 BTC of those puts.
I rank the structures like this, for someone who shares the bot’s bearish view.
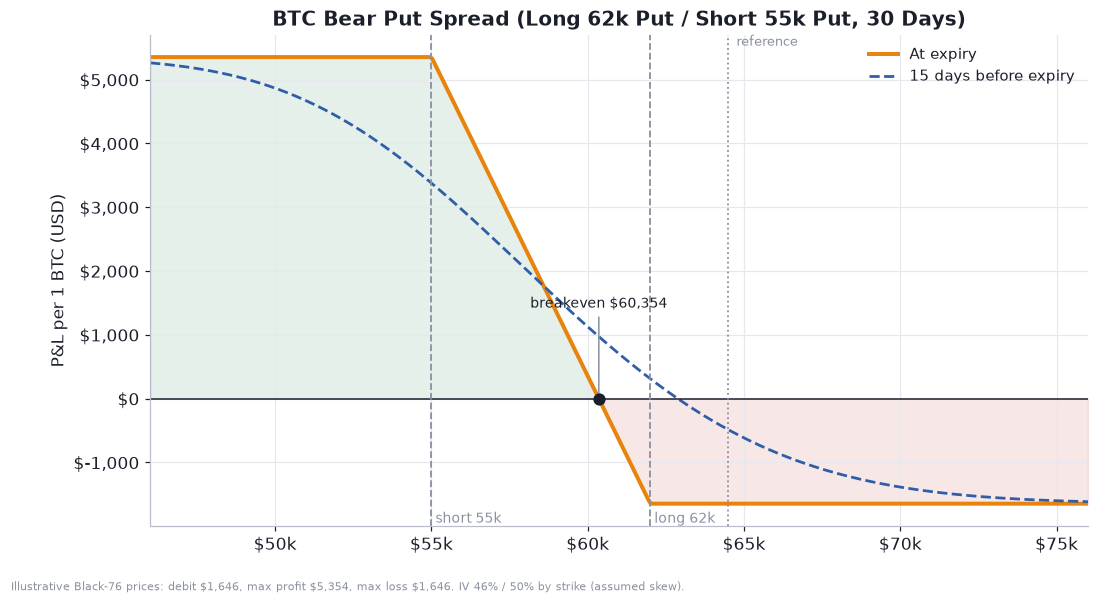
The bear put spread. Buy the $62,000 put and sell the $55,000 put, 30 days out. With my assumed skew of 46% and 50% implied volatility at the two strikes, the debit is about $1,646 per bitcoin. Breakeven at expiry is the long strike minus the debit, $62,000 − $1,646 = $60,354. Maximum profit is the strike width minus the debit, $7,000 − $1,646 = $5,354, which is about 3.25 times the maximum loss. The structure wins if Bitcoin is anywhere below $60,354 at expiry, caps your gain below $55,000, and gives you a known worst case. Selling the lower-strike put finances part of the expensive skew you are buying.
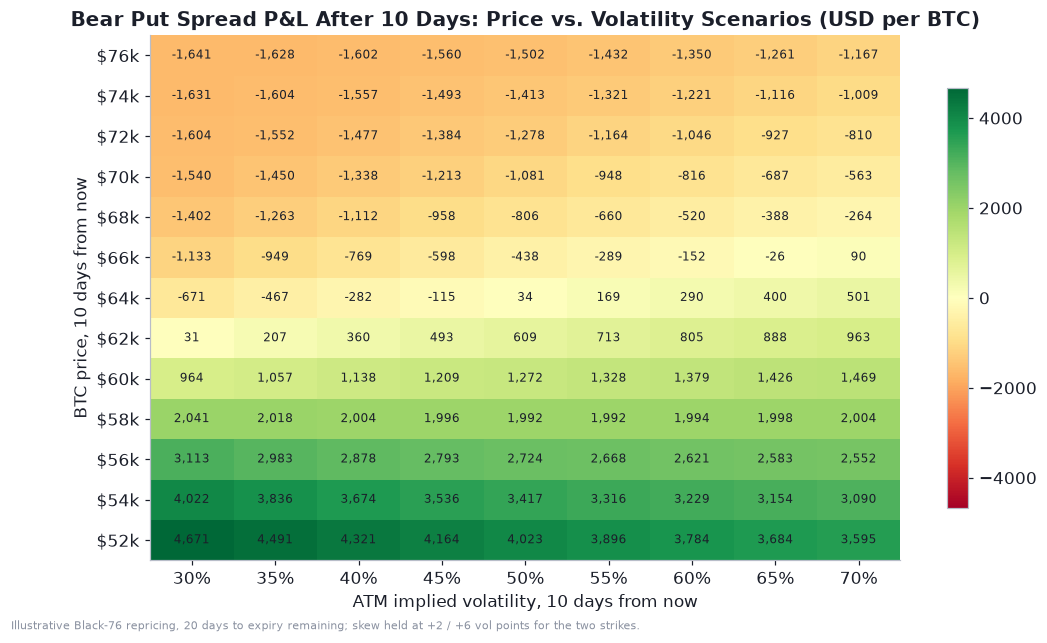
The heatmap shows how the spread behaves before expiry. After 10 days, with 20 days remaining, the position is worth the most when Bitcoin has already dropped toward $55,000 to $58,000 and volatility has not collapsed. It loses when price rallies back toward $66,000 to $76,000, and a volatility drop adds a little to the pain. A short-covering bounce is the scenario that hurts this structure.
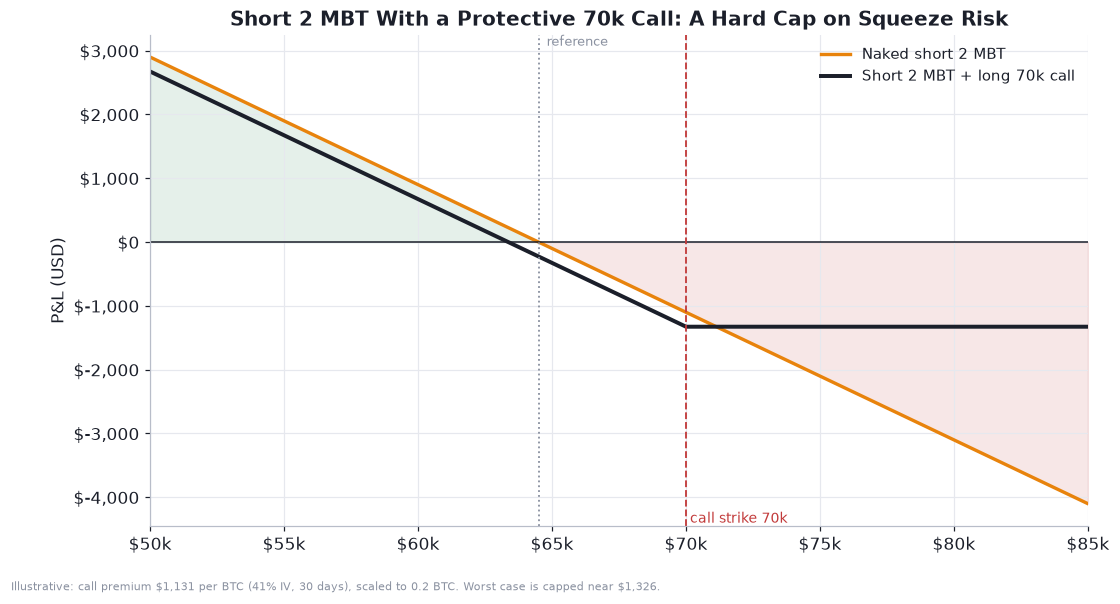
The protective call on a short future. If you keep the short micro futures position, buy a $70,000 call as insurance. At 41% implied volatility the 30-day call costs about $1,131 per bitcoin, or about $226 for 0.2 BTC. The payoff caps the worst case. Between today’s price and $70,000 you lose as the short moves against you, above $70,000 the call offsets the loss, and the worst case for the combined position is about −$1,326 for 0.2 BTC, plus nothing more however high Bitcoin goes. With funding negative and short positioning crowded, a squeeze is the principal risk to a short thesis, and this structure pays a known premium to remove the tail.
A front-end straddle for the event cluster. If you do not trust direction but expect November 17 and 18 to matter, a short-dated straddle is a pure bet that realized volatility will exceed the roughly ±4.9% implied through November 20. I would only trade that if my own estimate of event volatility is meaningfully higher than the market’s, and I would size it as a premium I am happy to lose.
The simplest summary: the bot’s naked short is the right directional thesis in the wrong risk wrapper if you cannot watch it. A defined-risk structure is a better wrapper when implied volatility is high and the thesis has a catalyst calendar.
What would make the thesis wrong
A weekly close back above $70,000 to $72,000 would invalidate the breakdown. Other warning signs would be ETF flows turning positive for several consecutive sessions, funding rates rising while price stalls, or a dovish surprise from the Fed that pulls real yields down. Remember the equation-4 yardstick: a ±$3,930 weekly move is the market’s own estimate of ordinary noise. A $5,000 bounce is not a regime change.
Gold: a safe-haven thesis colliding with a 5% Treasury yield
Fundamentals: the bond market is the boss this week
If you only read the geopolitical headlines you would expect gold to be soaring. There is a war in the Gulf, warnings about nuclear risk in Ukraine, and tightening technology export controls. Gold, instead, is at a one-year low. That tension is the entire story, and it is the one the bot’s thesis has to resolve.
The data from Monday’s coverage is consistent across Reuters, CNBC, Investing.com and Newsquawk. Spot gold touched about $3,830 and was trading near $3,853 to $3,865, its lowest since early October 2025 and roughly 31% below the January record. December COMEX futures settled around $3,853. Last week it fell 4.5% to 4.6%, from a weekly high of $4,148.95 to a Friday close of $3,883.40. Reuters notes it is on course for its worst calendar year since 2015.
The drivers are rates and the dollar:
The 10-year Treasury yield rose every session last week, from 4.859% to 5.154%, touching 5.17%. The 2-year closed at 4.88%, the 5-year at 4.98% and the 30-year reached 5.48%.
The dollar index is near 103.4 to 103.5, a 19-month high.
Fed funds futures assign roughly 92% to 95% to a 25 basis point hike at the December 8 to 9 meeting and a small probability to 50 basis points. Investing.com describes the market as pricing about 75 basis points of total tightening from here. The Fed raised in September and held at 3.75% to 4.00% in October, according to that account.
Fed speakers are uniformly hawkish: Waller backs a December hike, Logan said at least two more 25 basis point increases are needed, and Daly, Schmid, Jefferson and Collins all leaned toward further tightening. October core inflation printed at 0.3%, and producer prices posted their largest annual increase in four years.
Fed Chair Kevin Warsh was due to speak on Monday, and the minutes of the October 27 to 28 meeting are due on Wednesday, November 18.
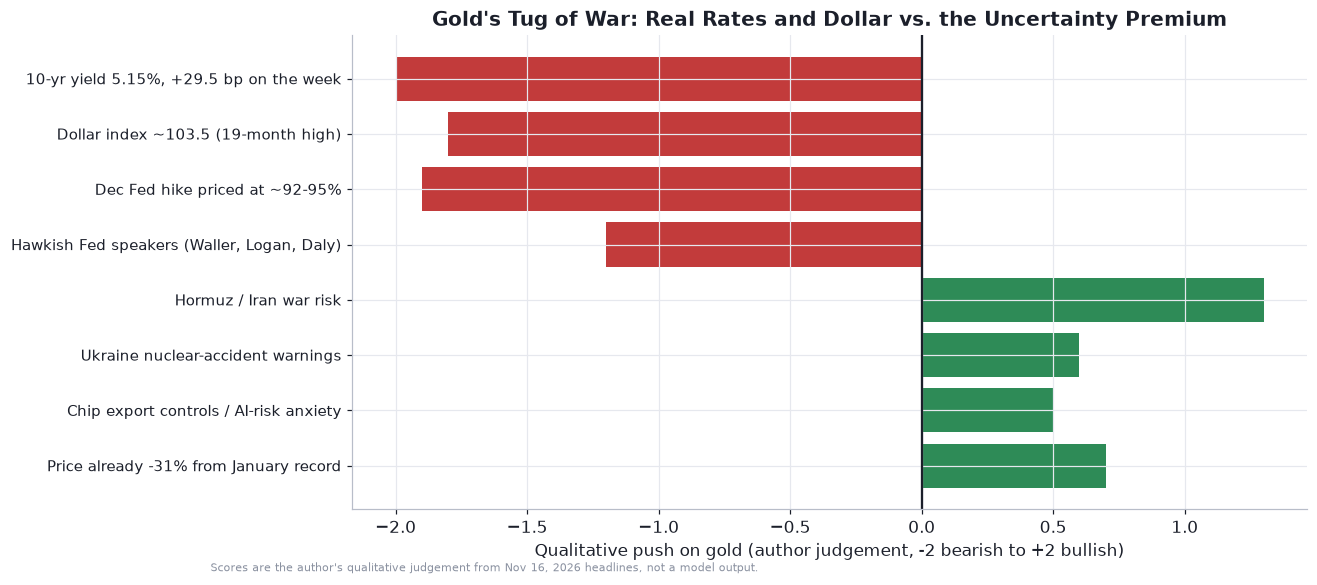
The chart above sorts the forces. The scores are my qualitative judgement, not a model output, but the imbalance is the point: the bearish forces are larger and, importantly, more measurable than the bullish ones.
Holding gold costs the opportunity of a risk-free yield above 5%, and gold carries no coupon. The mechanism is the real yield: when yields rise faster than inflation expectations, gold’s relative appeal drops. Investing.com’s analysis made the point crisply: this is the opposite of the January environment that took gold to its $5,589 record, which was built on expected easing and falling real yields. Gold can rally during hiking cycles, as it did in parts of 2022 and 2023, but only once the market believes the peak rate is in sight.
The gold bot’s thesis, “uncertainty premium overwhelms dollar strength”, is currently being tested and failing. The most honest framing is that the premium is real but is being outbid by the discount-rate effect. It is worth noting that the same set of PDFs that gave the bot its thesis also contains a day-of analysis that says the opposite for futures positioning. That report’s gold section is titled “Short Futures, Long Call Convexity” and argues that rates are winning for now. In other words, the bot’s long thesis and the report’s tactical view disagree. A bot with a trend filter resolves that disagreement automatically by staying out until price confirms.
Technical picture
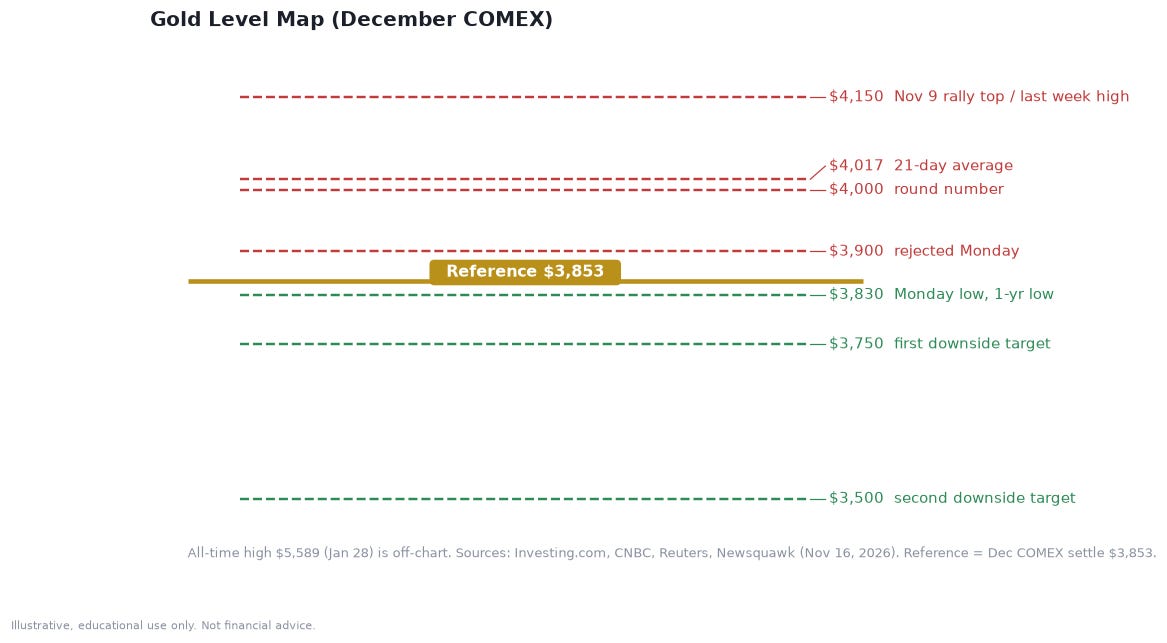
The picture is clear and unfriendly to longs.
Trend: down on every timeframe above intraday. Gold sits well beneath its 21-day average near $4,017.
Resistance: $3,900 (rejected Monday), $4,000, then the 21-day average around $4,017, then $4,150, last Monday’s rally high.
Support: $3,830 (Monday’s low and the one-year low), then $3,750 and $3,500, which is where Investing.com projects the path of least resistance if the 10-year holds above 5% and the dollar stays above 103.
Momentum: deeply negative. UBS, however, noted that “gold is approaching the year’s lows, making further downside less attractive as a trade”. That is a sentiment signal, not a technical one, but it hints at how stretched positioning may be.
Volatility regime: the CBOE Gold Volatility Index, GVZ, closed at 26.42, up 4.2% on the day, in the 56th percentile of its one-year range of 19.58 to 46.02. That is elevated but not extreme.
Silver tells the same story with more leverage: it dropped 3.7% to about $46.94, its lowest since late October 2025. Platinum and palladium each fell about 3.2%.
A simple factor view: what drove last week?
Gold’s price over a short horizon can be described as a function of the things we have just listed. A common quant shorthand is a factor model:
where y is a Treasury yield (ideally the real yield), D is the dollar index, the betas are sensitivities, and the error term epsilon captures everything else, including the geopolitical premium. I will not pretend to have estimated this regression from daily data here. But last week’s raw numbers give an order of magnitude: the 10-year yield rose 29.5 basis points and gold fell 4.6%. That is a loss of about 1.6% for every 10 basis points of yield increase, with the dollar’s contribution mixed in. Treat that as one week’s observation, not a stable beta.
That means the Fed’s reaction function is the main risk factor for the gold long. If Warsh or the minutes signal that December is the last hike, the discount-rate effect reverses and the long thesis can work quickly. If they signal more to come, the rates headwind persists and the geopolitical premium stays suppressed.
Quant: ranges and probabilities
At a GVZ of 26.4%, the expected move formula gives a one-week one-standard-deviation range of about $141 per ounce, or ±3.7%. Over 45 days it is about ±$357, or ±9.3%.
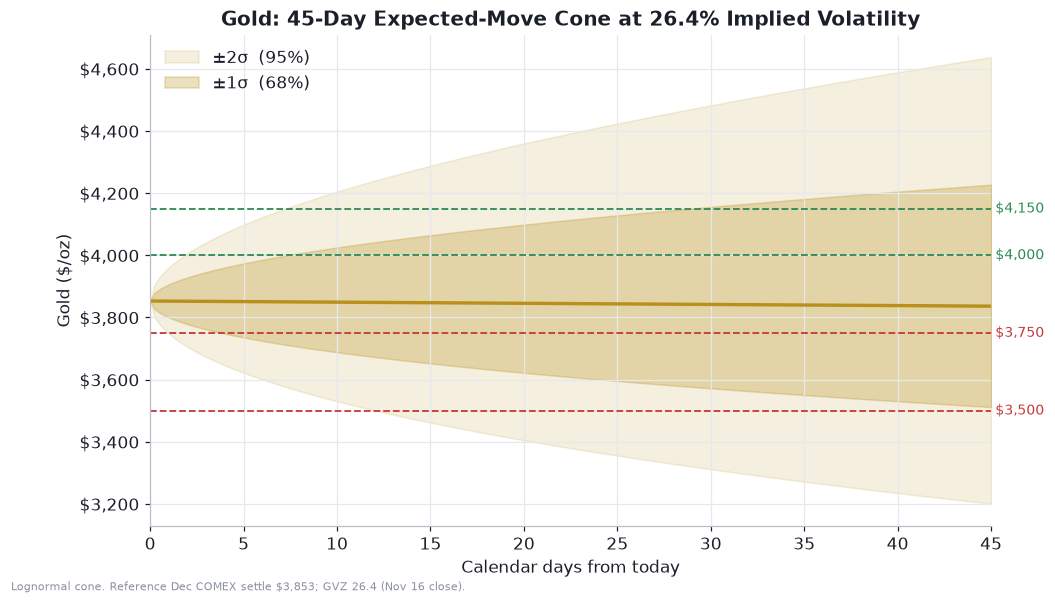
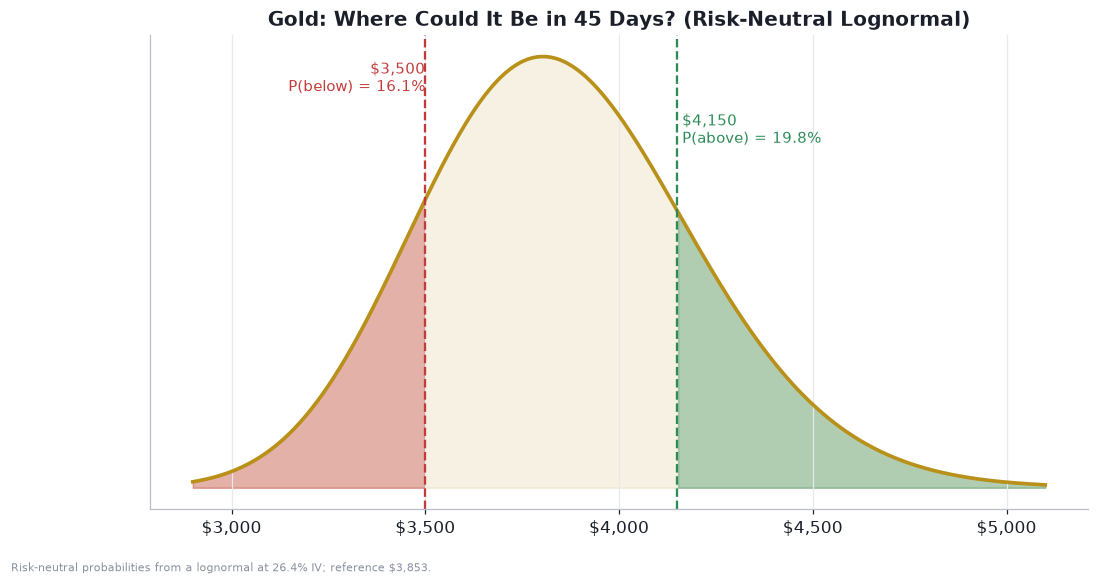
Under the risk-neutral lognormal at 26.4% volatility and 45 days, the probability of finishing below $3,500 is about 16.1%, below $3,750 is about 40.3%, above $4,000 is about 32.6%, above $4,150 is about 19.8%, and above $4,500 is about 4.3%. Those say gold is about as likely to finish above $4,000 (roughly one chance in three) as it is to finish below $3,700 (about 35%). The touch probabilities, computed with equation 13, are bigger: about 77% for $3,750, 69% for $4,000, 42% for $4,150 and 30% for $3,500.
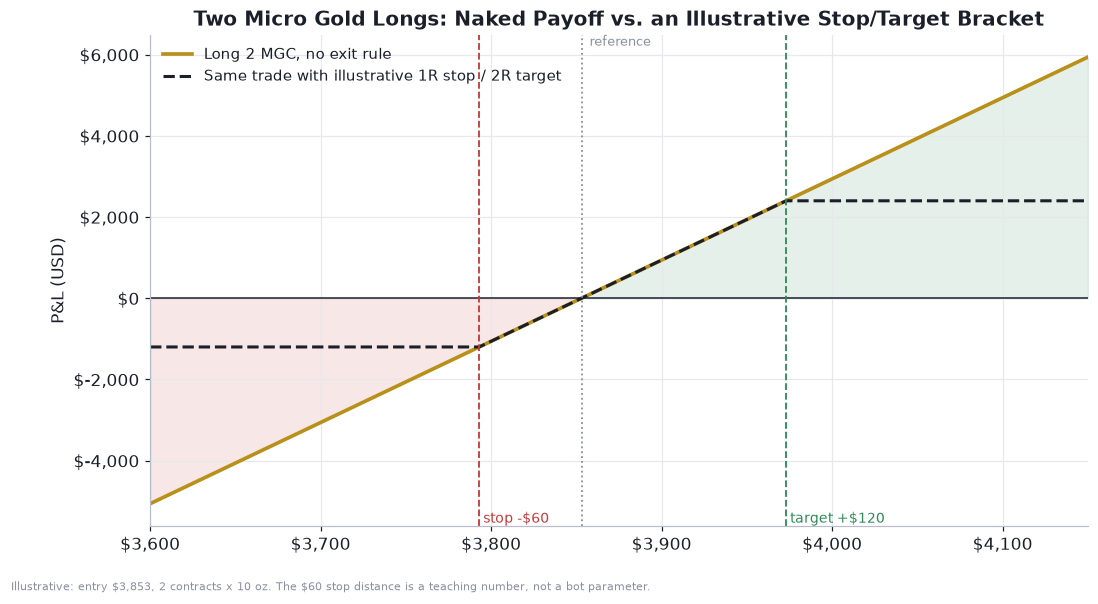
Now apply that to the position. Two micro gold contracts are 20 ounces, about $77,060 of notional at $3,853. A one-week one-standard-deviation move in gold is about $141 per ounce, so the position swings about ±$2,820 in a normal week. If the account is the $10,000 listed in the term sheet, that is 28% of capital in one standard deviation. A two-standard-deviation week, which happens about one week in twenty, would cost more than half of it. This is the central risk-budget fact about the gold bot: it is the biggest position in the group by notional and by risk, and it is leveraged about 7.7 times on a $10,000 account. The ATR-based stop and a hard contract cap are the only protection, and both operate on closed bars, not on the live tick.
Ways to express a gold view
Outright futures. Micro gold at 10 ounces is a convenient size. The cost is that a 1% move is $770 on two contracts, as above. With no carry income and a positive cost of carry, holding gold futures costs the financing rate through the equation 14 basis.
Options on futures. Gold options trade on the standard 100-ounce contract, so I show payoffs per 10 ounces for comparability.
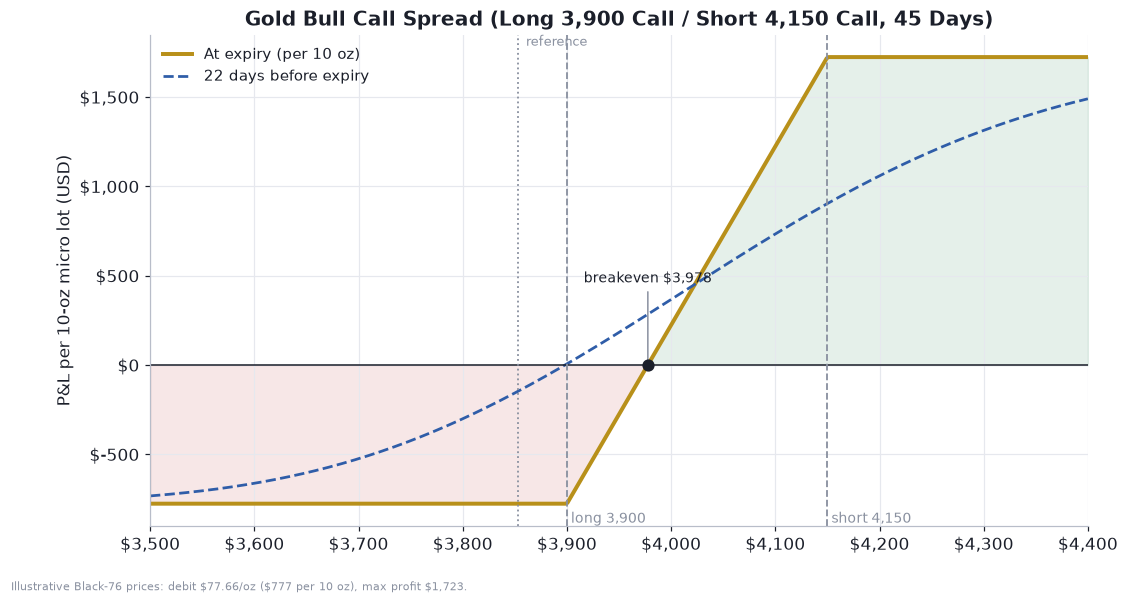
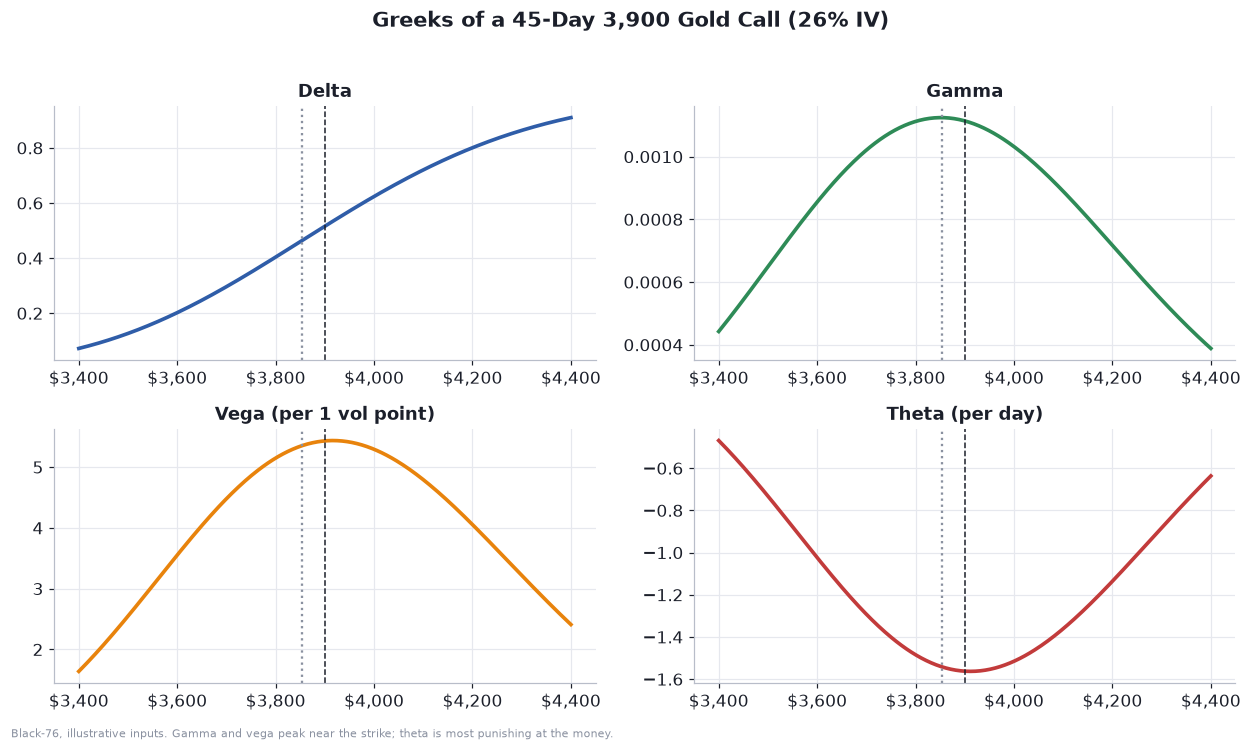
Bull call spread. If you think the uncertainty premium or a Fed pivot could lift gold in the next six weeks but do not want to be wrong at 7.7 times leverage, buy the $3,900 call and sell the $4,150 call, 45 days out. At implied volatilities of about 26% and 25.5%, the debit is about $77.66 per ounce, or $777 per 10 ounces. Breakeven at expiry is about $3,977.66, which is only about 3.2% above today’s price. Maximum profit is the width, $250, minus the debit, about $172 per ounce, or $1,723 per 10 ounces, roughly 2.2 times the maximum loss. You win if gold finishes above about $3,978, you cap your gain at $4,150, and the maximum loss is known.
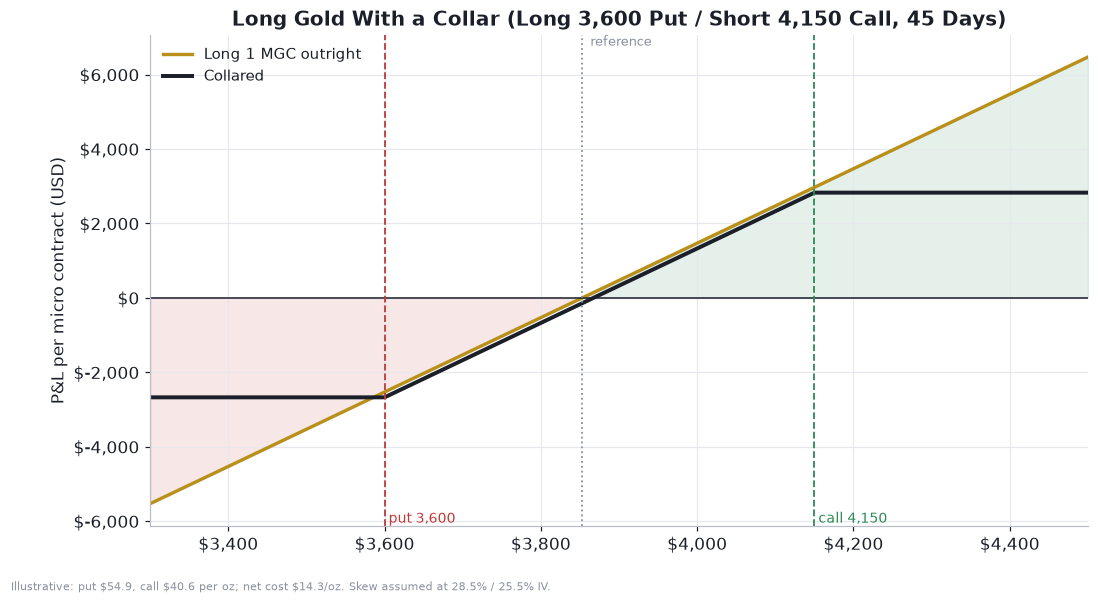
The collar. If you already hold gold and want to stay long while capping risk, buy a $3,600 put and sell a $4,150 call. With a put at about 28.5% implied volatility and a call at 25.5%, the put costs about $54.89 and the call collects about $40.63, a net debit of about $14.26 per ounce. The result is a position that loses at most about $253 plus the debit below $3,600 and gains at most about $297 minus the debit above $4,150. This is how a holder survives a rates shock without selling the asset.
The Greeks of the call spread’s long leg explain why timing matters. A 45-day $3,900 call has a delta near 0.46, and its time decay accelerates as expiry approaches while the position needs a move to $3,978 to break even.
Hedging the rates channel. Because the main risk to a gold long is rising yields, the obvious hedge is short 10-year Treasury futures. The minimum-variance hedge ratio for two assets is:
where A is the exposure you hold, B is the hedge instrument, ρ is their correlation and the σs are their volatilities, all in dollar terms per unit. The ratio tells you how many dollars of the hedge to trade per dollar of exposure to minimize variance. The sign matters: gold is negatively correlated with yields, so it is positively correlated with Treasury futures prices, and a long gold position is hedged by a short Treasury futures position that profits when yields rise. In my assumed correlation matrix later in this article, gold and the 10-year yield have a correlation of −0.40, which would imply a small hedge ratio rather than a one-for-one hedge. The same folder of PDFs includes a separate 10-year Treasury short bot, which is conveniently on the other side of this trade, though its own results are not credible either.
What would make the gold thesis right, and wrong
Right: a Fed communication that reads as “one more hike and done”, a 10-year yield that fails below 5%, a dollar rollover from 103.5, or an escalation in Hormuz that pushes the Treasury market into a flight-to-quality bid. Wrong: a break below $3,750 on a hawkish minutes release, a 10-year above 5.25% and a dollar index above 104. In the second case, the Investing.com target of $3,500 is about 9.2% below spot, which is a one-sigma move over 45 days at current implied volatility. That is not a tail scenario.
Crude oil: a war premium meeting a surplus forecast
Fundamentals: two stories at the same time
Crude oil is the hardest of the three markets because both of its stories are true.
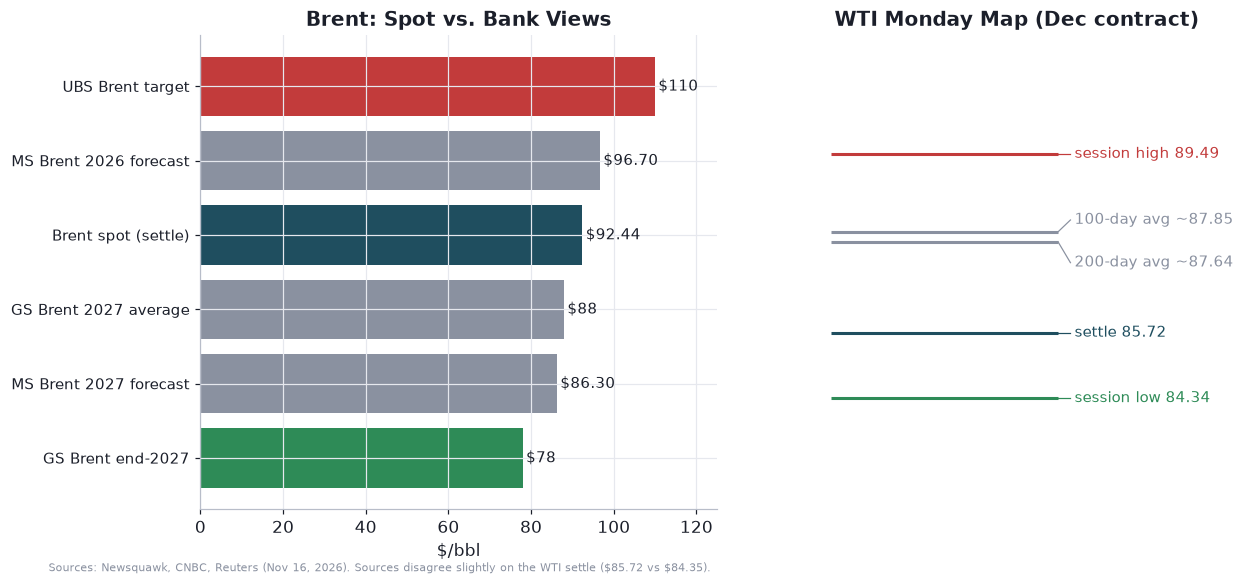
The bullish story is physical and military. The US-Israeli war with Iran is in its ninth month. Over the weekend and on Monday, the Iranian Revolutionary Guards reported that two oil tankers hit mines in the Strait of Hormuz and warned oil companies that the southern route is mined. The UK Maritime Trade Operations centre said a tanker was struck by an unidentified projectile while leaving the strait, triggering an engine-room fire. Iran struck an air base in Bahrain in its first direct strike on the Gulf state in several weeks. A third US carrier strike group has arrived in the region. About 15 million barrels per day of crude moved through the strait in 2025, according to IEA data cited by CNBC, and there is no comparable bypass. High shipping and war-risk rates, according to KCM Trade’s Tim Waterer, are putting a floor under prices. The source report adds that Chinese “teapot” refiners are pivoting to Iraqi crude as US pressure chokes Iranian supply, and it cites UBS as seeing Brent at $110 on tight buffers.
The bearish story is the balance sheet. On Friday the International Energy Agency said the oil market will return to a surplus in the fourth quarter, with supply averaging 105 million barrels per day, 1.7 million barrels per day above demand. It had previously forecast a deficit. Middle East exports, it said, are recovering faster than demand despite the attacks, and shipments through Hormuz have largely recovered to pre-war levels. Another 71 million barrels from a record emergency stock release will be available through February, including 15 million barrels of diesel. Goldman Sachs expects Brent to average $88 in 2027 and ease to $78 by the end of that year. Morgan Stanley raised its Brent forecast for 2026 to $96.70 and for 2027 to $86.30. And Monday’s China data missed: industrial production grew 4.8% against 5.3% expected, retail sales 0.4% against 0.8%, and fixed-asset investment fell 8.1% against an expected 7.0% decline.
The tape sided with the balance sheet. According to Newsquawk, WTI settled $2.84 lower at $85.72 and Brent settled $3.40 lower at $92.44 on a day of active Gulf escalation. Other outlets quoted slightly different settlements, for instance WTI near $84.35, so treat any single figure as approximate. Newsquawk’s commentary captured the point: when supply-risk headlines fail to lift prices, the market is signalling that the geopolitical premium is either already embedded or being discounted on diplomatic off-ramps. Reports that the US is not considering imminent airstrikes, and that it wants to escalate pressure to secure an initial Hormuz agreement, fit the familiar sequence of escalation followed by backchannel de-escalation.
There is also a macro overlay. A hawkish Fed and a strong dollar are headwinds for dollar-priced commodities. The source report states a rule that a weaker dollar means higher commodity prices, and, conversely, rising oil feeds inflation and then rates. It flags that oil and the 10-year yield tend to correlate above 0.7 in inflation shocks, which is when a supply shock hits both legs of a “long oil, short bonds” trade at once. That is exactly the regime risk for this week. A fast resolution in the Gulf would drop oil, drop inflation expectations, drop yields and help gold. It would hurt the crude long and help the gold long. I will return to this in the portfolio section, because it is the key diversification link between two of the three bots.
Technical picture
WTI traded between $84.34 and $89.49 on Monday. It briefly dipped below its 100-day and 200-day averages, which Newsquawk puts at about $87.85 and $87.64, and settled below both. Those two moving averages are almost on top of each other. When a market closes below a cluster of long-term averages after failing at the cluster, that cluster becomes resistance. Brent traded between $92.25 and $96.77.
My levels for WTI:
Resistance: $87.60 to $88.00 (the moving-average cluster), then $89.50 (Monday’s high), then $90 and $100 as round numbers.
Support: $84.34 (Monday’s low), then $80, then the high $70s, where a surplus narrative could take it, with $75 as the next round number.
Momentum: negative short term. Two closes below the cluster would confirm it.
Volatility regime: OVX closed at 49.59, down 1.4%, in the 36th percentile of its one-year range of 28.4 to 120.9. That is high in absolute terms but low relative to the war-driven spikes earlier this year.
For a momentum-based long, this is a hostile setting. The strategy’s premise is that price accelerates upward on supply-shock news. Monday did the reverse: bad news for supply, lower prices. A bot that requires price to be above a slower trend measure before buying would be flat, and that is the correct behavior.
Quant: a two-humped distribution
A single lognormal at 49.6% implied volatility is the textbook description, and it produces this cone.
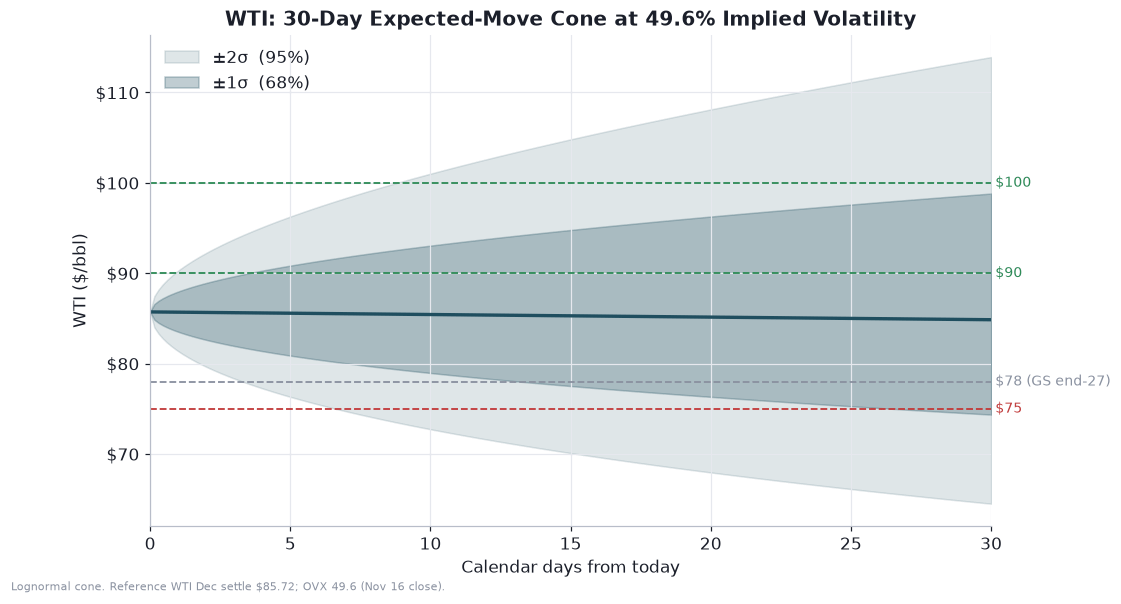
At $85.72, equation 4 gives a one-week one-standard-deviation move of about ±$5.89 (±6.9%) and a 30-day move of about ±$12.19 (±14.2%). Under the risk-neutral lognormal, the probability that WTI finishes above $90 in 30 days is about 34%, above $100 about 12%, and below $80 about 34%. The touch probabilities from equation 13 are about 63% for $80, 73% for $90 and 28% for $100.
But a single bell curve is a poor description of this market, because the outcome is driven by a discrete event. Either the Hormuz situation resolves into a deal and the surplus narrative takes over, or it drags on, or it escalates into real disruption. For that kind of problem I prefer a scenario mixture, where the final price is a weighted blend of several distributions:
Each scenario j has a probability π and a distribution f centered on a median m. Here are my illustrative scenarios for WTI in 30 days. They are my assumptions, not forecasts.
A deal or surplus takes over (35%). Median $76, volatility 30%. Hormuz flows normalize, the IEA’s surplus is believed, and the geopolitical premium bleeds out.
Muddle through (45%). Median $86, volatility 38%. Headlines stay noisy, prices chop around current levels.
Escalation with real disruption (20%). Median $106, volatility 50%. A genuine loss of throughput reprices the curve, which Newsquawk notes is what has durably repriced it in the past, as opposed to rhetoric.
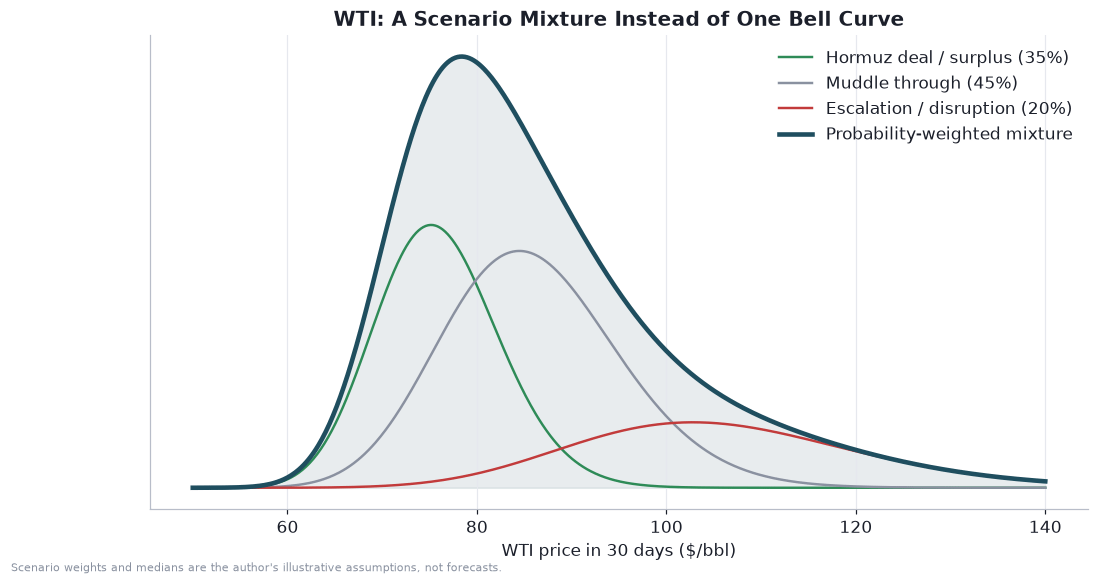
The blend has a probability-weighted mean of about $86, essentially today’s price, which is a useful check: my scenarios do not add a directional view, they reshape the distribution. The shape is lopsided. The probability of finishing below $78 is about 32%, while the probability of finishing above $100 is about 16%. The right tail is thinner than the left but heavier than a lognormal would suggest, with a small second hump near the escalation scenario. The market-implied lognormal gives about 12% for above $100 and about 28% for below $78. In other words, my mixture says the left tail is a little more likely than the market and the right tail is a bit more likely too, and that the middle is hollowed out. That is the signature of a binary-event market, and it is why convex option structures are better suited to crude than narrow stop-and-target logic.
What 3 micro contracts really are
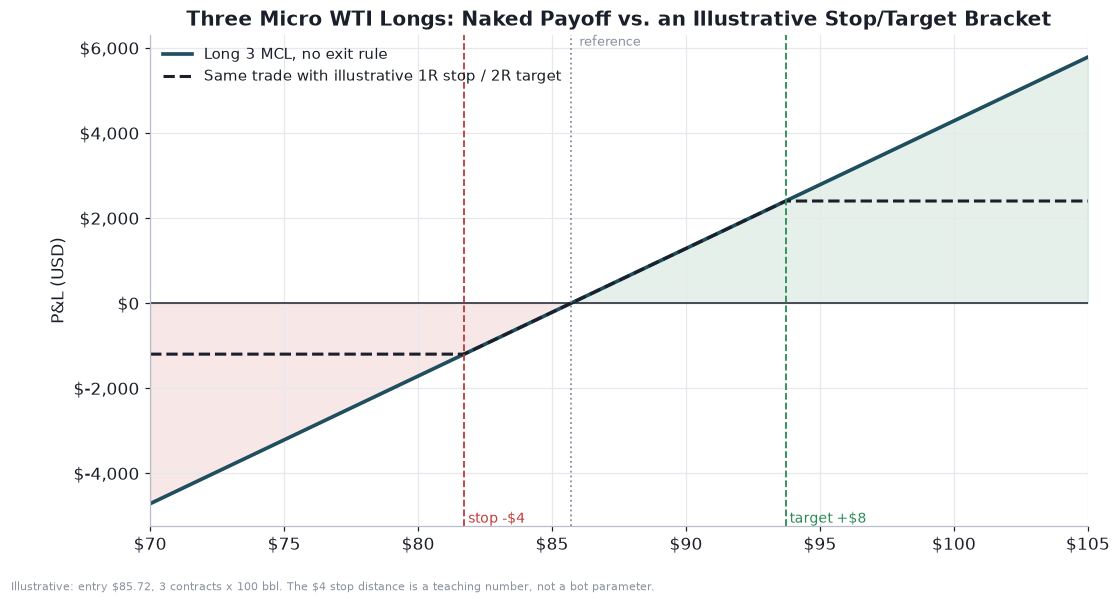
The bot’s cap is three contracts of 100 barrels each, or 300 barrels. At $85.72 that is $25,716 of notional. Each $1 move in WTI is $300 on the position, and a tick of $0.01 is $1 per contract. The one-week one-standard-deviation move of $5.89 is therefore about ±$1,766 on the position. Against the $12,000 allocation in the term sheet, that is almost 15% of capital for a single ordinary week. Against the $50,000 default in the script it is 3.5%. The PDF set and the script disagree about capital by a factor of about four, which changes the risk story entirely.
Ways to express a crude view
Outright futures. Micro WTI is 100 barrels, a tenth of the standard 1,000-barrel contract. The curve matters. The source report describes front-month backwardation, a curve where nearer prices are higher than deferred ones. In backwardation a long holder earns a positive roll yield when the curve shape holds, because each contract converges up to the spot price as it approaches expiry. Note also that the front December contract expires around November 20 under the exchange’s standard rule, so any bot that trades the front month has to roll within the week.
Options on futures. WTI options trade on the standard contract, so I quote per barrel and per 1,000 barrels. These are Black-76 prices from equation 15 with my assumed volatilities and a flat curve, which is a simplification of a market that is probably backwardated.
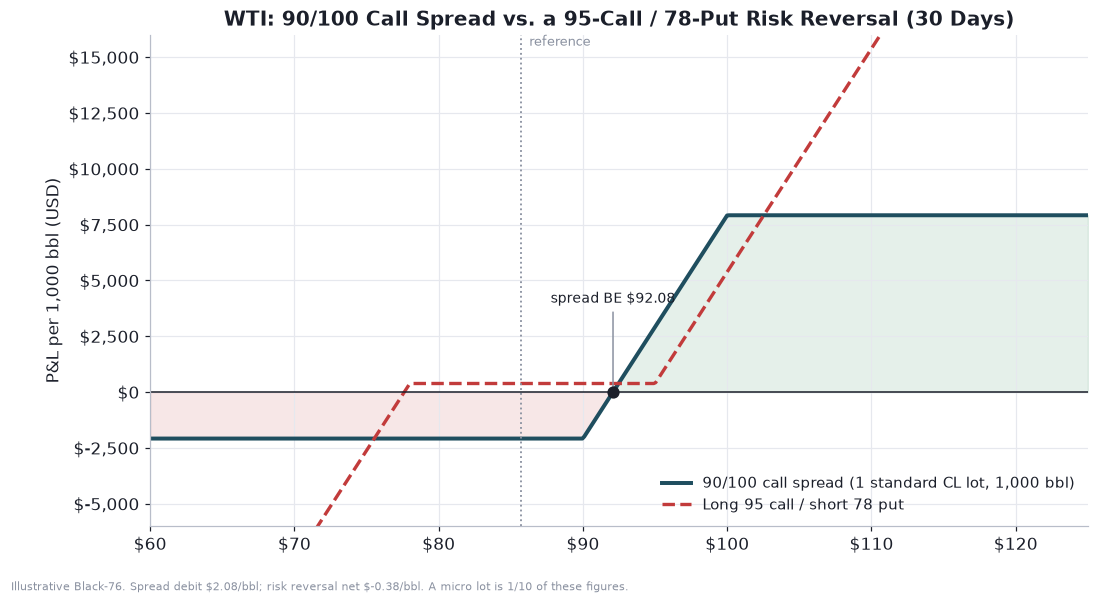
The call spread. Buy the $90 call and sell the $100 call, 30 days out. At 50% and 52% implied volatility, the debit is about $2.08 per barrel, or about $2,084 per standard contract. Breakeven at expiry is about $92.08. Maximum profit is the $10 width minus the debit, about $7.92 per barrel, roughly 3.8 times the maximum loss. It wins if WTI finishes above $92.08, which the lognormal gives about a 28% chance. This is a defined-risk bet on the escalation scenario that does not lose more than the premium if the surplus narrative wins, which it might.
The risk reversal. Buy a $95 call, sell a $78 put. At 50% and 55% implied volatility the net is roughly a $0.38 credit per barrel, so the position costs nothing, but you are now short the left tail. Below $78 the position loses $1,000 per standard contract for every $1 move. That is, in effect, a leveraged long that begins at $78. The source report’s institutional version of this trade sells $80 to $85 puts to finance $110 to $120 calls on Brent. It looks free until the surplus scenario hits. Given my mixture’s 32% probability of WTI below $78, I would not sell that put unless I genuinely wanted to own crude at $78.
Spreads. The source report also discusses Brent-WTI spreads and crack spreads. Using Monday’s two settlements the Brent minus WTI gap is about $6.72, though the contracts are different delivery months, so it is a rough indicator. If Hormuz disruptions persist, Brent plausibly outperforms WTI because the US domestic supply is not directly affected. If the deal scenario wins, both fall and the spread may narrow.
What would make the thesis right, and wrong
Right: a credible disruption to throughput, as opposed to attacks that leave loadings intact, or a decline in the IEA’s expected surplus. Insurance and freight data tend to move before flat price confirms genuine impairment, and Newsquawk flags war-risk rates as a leading indicator to watch. Wrong: sustained closes below $84, a diplomatic framework for the strait, continued weak Chinese data, or a Fed that tightens into an oil shock.
Putting the three bots in one book
Each bot has its own thesis, but a trader running all three has one account and one risk budget. The question that matters is not “is the Bitcoin short good?” but “what happens to my equity when several things move at once?”
Correlation: the matrix that drives diversification
Correlation measures how two return series move together, on a scale from −1 to +1.
I have not estimated a correlation matrix from data for this article, so the one below is assumed, set from general market behavior and from the macro links described above. It is a teaching device, and it changes with the regime. In stress, correlations rise toward one in risk assets.
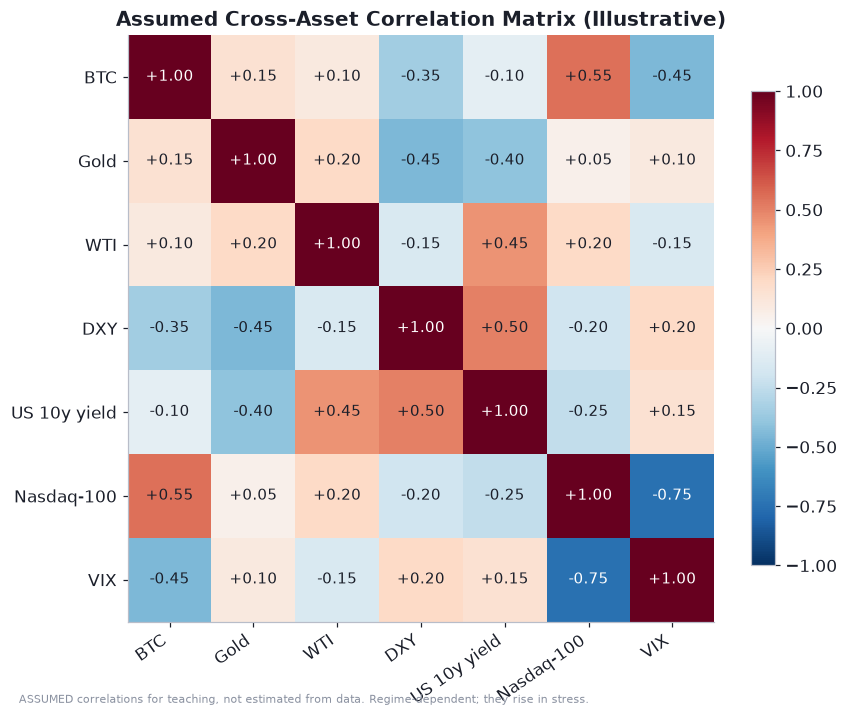
The choices I made encode the story of this week. Bitcoin is positively correlated with the Nasdaq-100 (+0.55) and negatively with the dollar (−0.35) and with the VIX (−0.45). Gold is negatively correlated with the dollar (−0.45) and the 10-year yield (−0.40). Crude is positively correlated with the 10-year yield (+0.45), consistent with the source report’s caution that oil and yields correlate strongly in inflation shocks. The Nasdaq-100 and VIX sit at −0.75.
The position that matters is the sign of each exposure. The Bitcoin bot is short, the gold and crude bots are long. A short Bitcoin position is positively correlated with falling risk assets, and a long gold position tends to rally when risk falls and the dollar softens. Bitcoin falling because of a growth scare would help the short and probably help gold, though a Fed-driven yield spike would hurt gold and help the short. Crude and gold have a positive assumed correlation of +0.20, but their link through yields has opposite signs: higher yields push crude up in an inflation shock and gold down. That is why a Hormuz resolution (crude down, yields down, gold up) is partly self-hedging for the pair.
Portfolio variance and who carries the risk
For a vector x of dollar exposures and a covariance matrix Σ of returns, the portfolio variance and each position’s share of it are:
The risk contributions sum to the total portfolio volatility, which makes them a fair way to see who is carrying the load.
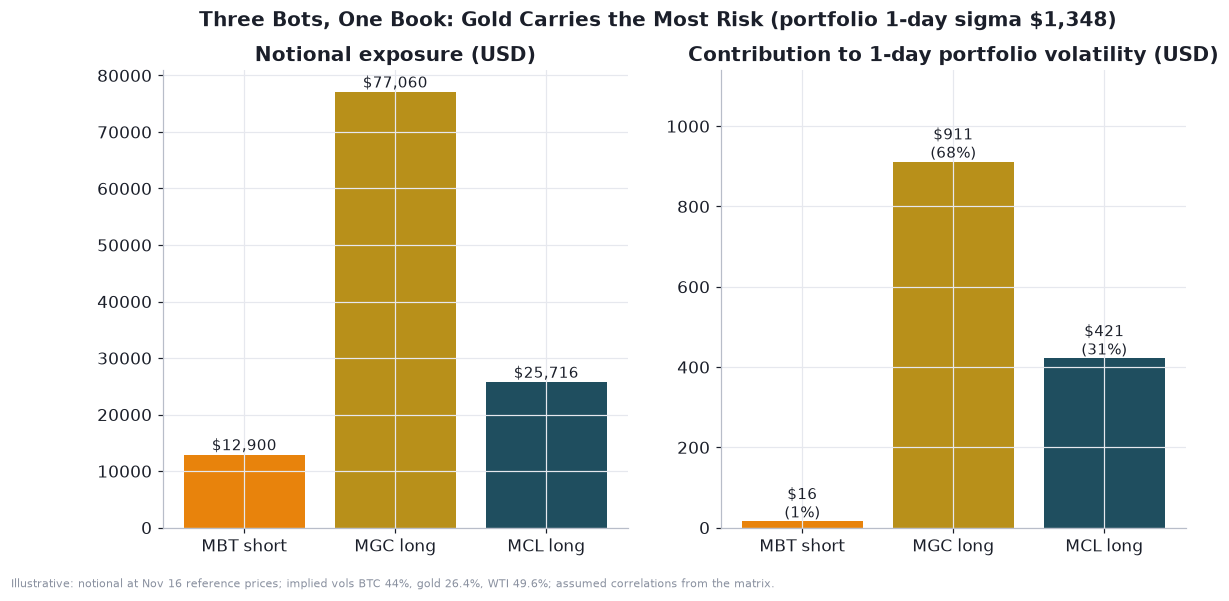
At Monday’s reference prices, the three positions are: short 0.2 BTC, about −$12,900 of notional; long 20 ounces of gold, about +$77,060; and long 300 barrels of crude, about +$25,716. Applying the implied volatilities of 44%, 26.4% and 49.6%, the one-day dollar standard deviations on their own are about $297, $1,065 and $668. Summed, those would be $2,030. With the assumed correlations, the portfolio’s one-day standard deviation is about $1,348, a diversification benefit of about 34%.
The shocking part is the attribution. Gold contributes about $911 of the $1,348, or about 68%. Crude contributes about $421, or 31%. The Bitcoin short contributes about $16, or about 1%. Because the short Bitcoin position is positively correlated with the long gold and crude positions in the assumed matrix, it acts as a partial hedge on the book, and because it is small it adds almost nothing to the total. The position that makes the headlines is the one that matters least for risk. That is why risk budgets must be set by contribution, not by headline narrative.
Value at risk and expected shortfall
Value at risk, VaR, is the loss that should be exceeded only (1 − α) of the time over a horizon h. Expected shortfall, ES, is the average loss on those worst days. For a normal distribution with mean μ_p and standard deviation σ_p:
With α = 95%, z is 1.645. Taking μ as zero and h as one day, the portfolio’s 95% VaR is about 1.645 × $1,348 ≈ $2,218, and the normal ES is about $2,780. Now replace the normal with a fat-tailed Student-t distribution with four degrees of freedom, scaled to the same standard deviation. The 95% VaR barely changes, at about $2,040, but the ES jumps to about $3,065, roughly 10% more than the normal. That is the crucial lesson of fat tails: the threshold looks similar while the average loss beyond it is bigger.
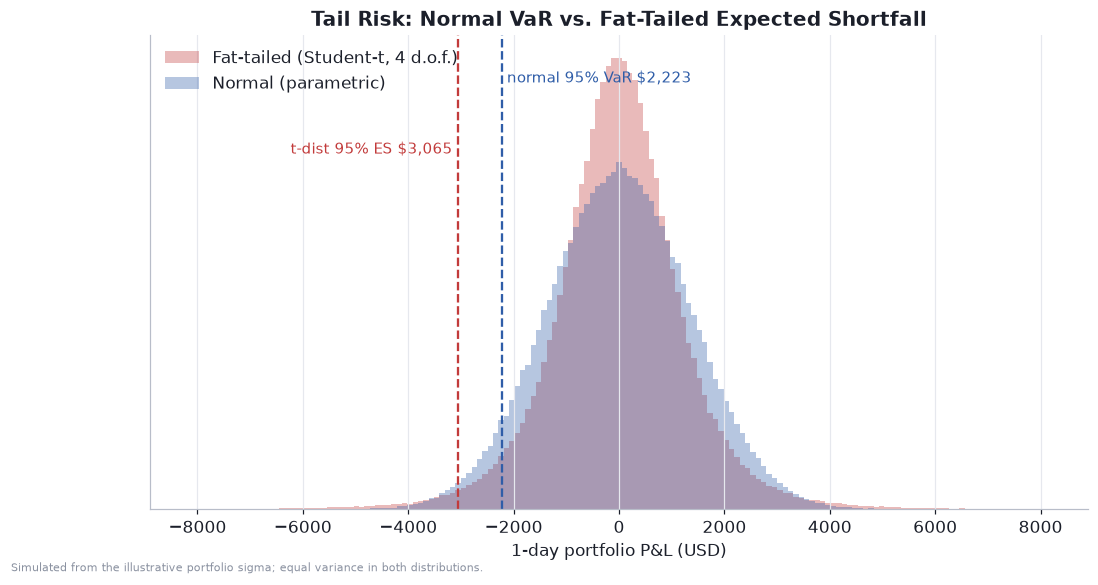
Remember what is missing from these calculations. They assume the volatilities I used and the correlations I invented. They do not include gap risk: the bots monitor stops on bars, and a headline from Hormuz or a surprise from Warsh can gap through a stop. They also do not include liquidity risk on the weekend, when Bitcoin trades but CME futures do not.
Sizing: Kelly and why you only take a fraction
The Kelly criterion gives the fraction of capital to risk that maximizes long-run growth. For a bet that wins with probability p and pays b times the amount risked:
For p = 0.5 and b = 2, the full Kelly fraction is 0.5 − 0.5/2 = 0.25 of capital per bet. That is enormous. In practice nobody risks 25% of an account on one trade, because Kelly assumes you know p and b exactly. If you overestimate your edge, Kelly sizing is ruinous, and it is much more punishing to overbet than to underbet. The chart shows expected log growth against the fraction risked: growth is highest at full Kelly, falls to zero at about twice Kelly, and turns negative beyond it. Most practitioners use a half or a quarter of Kelly and cap the risk per trade at one or two percent of capital. The left panel shows the volatility-scaled version used by most systematic bots: as volatility rises, the number of contracts allowed by a fixed risk budget drops in steps to the hard cap, and eventually to zero.
Scenario map: who wins when
I find the most useful portfolio tool is the plainest: list the scenarios, and score each bot’s direction in each. It is judgement, not a model, but it exposes concentrations.
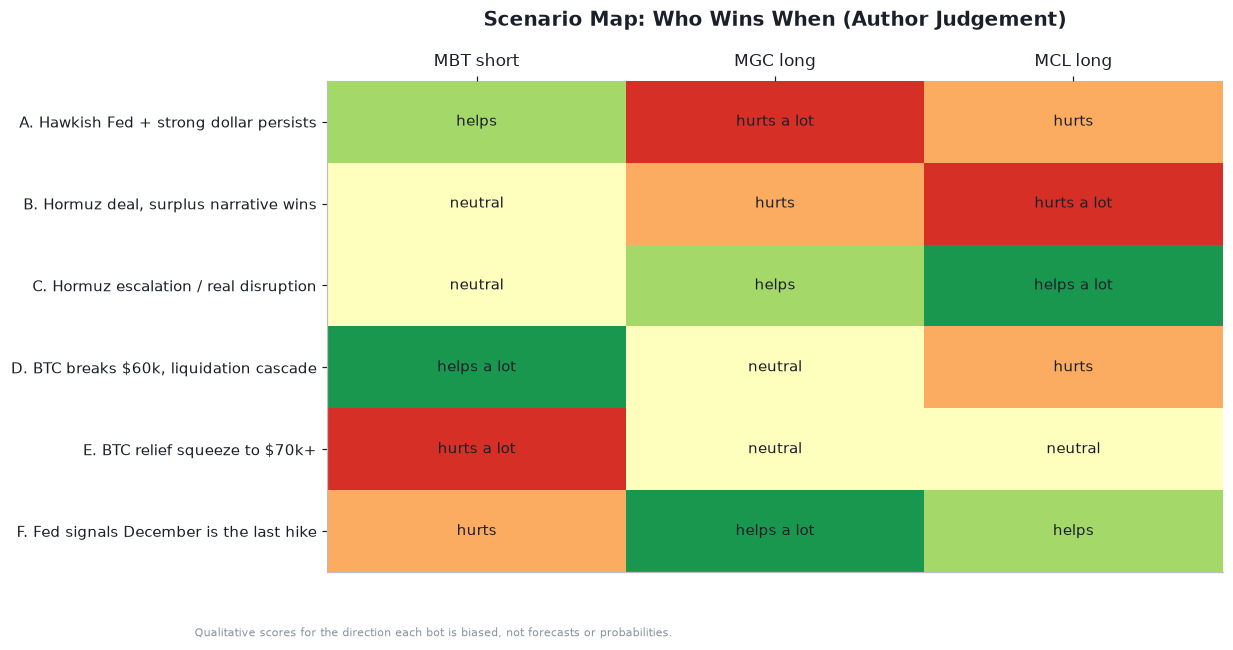
Look at the columns. The gold long is the most exposed to the rates scenarios: it is hurt by a persistent hawkish Fed and helped by a “one-and-done” signal. The crude long is the most exposed to the Hormuz scenarios, helped by escalation and hurt by a deal. The Bitcoin short benefits from a crypto break below $60,000 and is hurt by a relief squeeze. The Fed-pivot scenario helps gold a lot, crude somewhat, and hurts the Bitcoin short, which is the one that has a conflict with the others. Notice that no single scenario hurts all three bots at once. A deal in Hormuz hurts the crude long while a deal-driven fall in yields helps gold. That diversification is real but fragile, because in a liquidity crunch everything sells off together and the matrix collapses.
The calendar
Several catalysts cluster in the next ten days, and the options market has priced a lot of them in already.
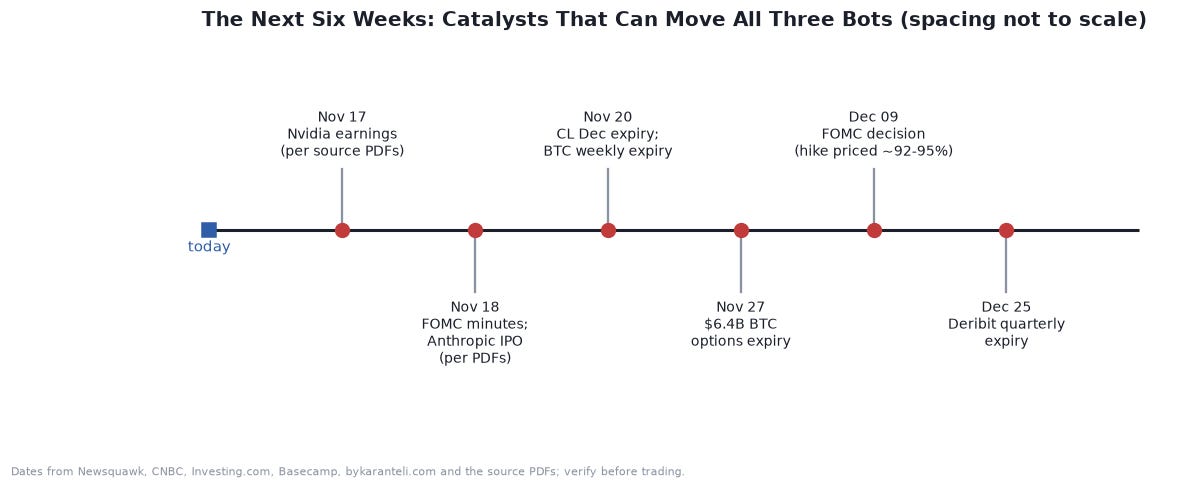
CoinDesk says Bitcoin traders are awaiting Nvidia’s earnings, which the source PDFs date to November 17. The October FOMC minutes and the Anthropic IPO, per the source report, both fall on November 18. The WTI December contract and Bitcoin’s weekly options expire around November 20. A $6.4 billion Bitcoin options expiry settles on November 27. The FOMC decision on December 9 is where the hike priced at roughly 92% to 95% becomes fact or surprise. Every one of those dates is an opportunity for a gap that no bar-based stop can honor.
The data-quality section: why I am not quoting the backtests
The PDFs include a “term sheet” of backtest results, a trading analysis, an options chain study and summaries. A reasonable reader would expect to see their performance numbers analyzed in an article like this one. I am not going to do that, because the numbers do not survive basic checks. Here is what I found.
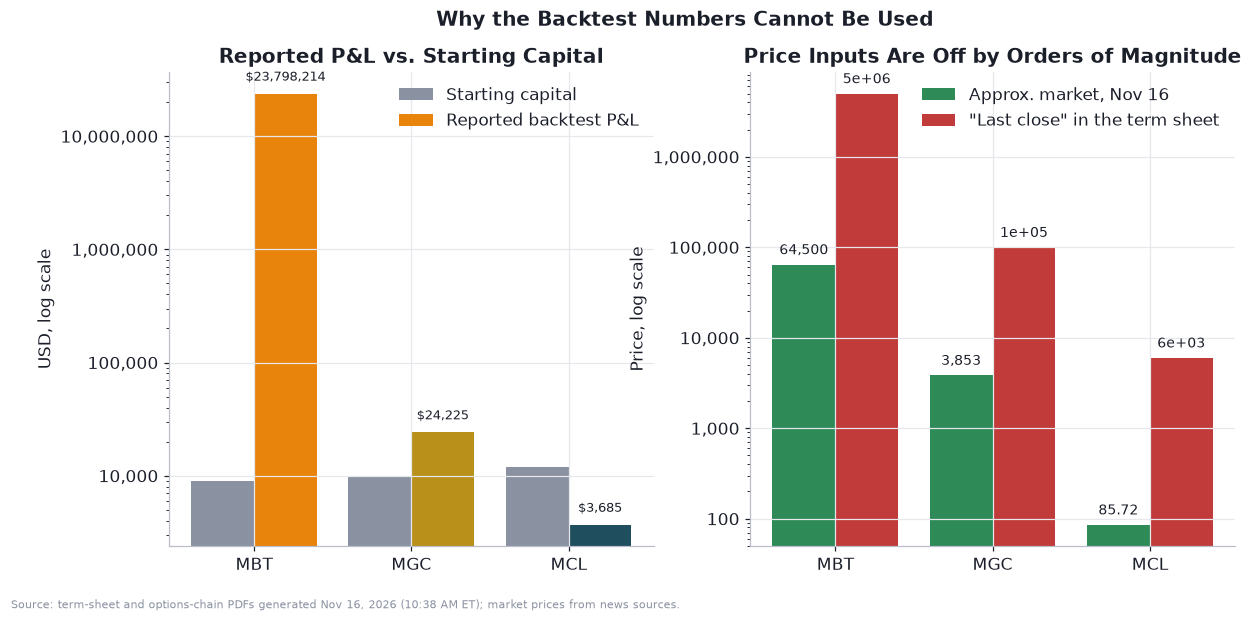
The Bitcoin bot’s backtest is not a backtest. The term sheet reports a net profit of $23,798,214 on a $9,000 starting account, an annualized return of 919,190%, and a maximum drawdown of 60,809.5%. It reports 11 trades with an average win of $6,168,333 and an average loss of $2,642,357. A two-contract micro Bitcoin position moves $0.20 per dollar of Bitcoin price, so an average win of $6.2 million would require Bitcoin to move by about $30 million per coin. The “last close price” printed in the term sheet is 5 × 10⁶ dollars, about 77 times the real price of roughly $64,500, and it prints a contract notional of $500,000 where the real figure is about $6,450 per micro contract. The most likely explanation is a price-scaling error in the data feed or the backtest engine. Whatever the cause, every dollar figure for this bot is unusable.
The gold and crude backtests look smaller but have their own problems. The gold section prints a last close of 1 × 10⁵ dollars against a market price near $3,853. It reports a 91.6% maximum drawdown on a $10,000 account, only 31% of months profitable, and a Sharpe ratio of 2.01 alongside a 150% annual return. A strategy with that drawdown does not have a trustworthy Sharpe of two. The crude section states that the data source was unavailable, “Rithmic Ticker Plant login failed | Using plan metrics”, which suggests the numbers shown as actuals were partly modeled rather than computed. It prints a last close of $6,000 against a real price of $85.72.
The live data pipeline had not received data. The trading analysis PDF shows, for all eight bots in the folder, zero ticks, a 0% success rate and “first data: never”. The options chain PDF says the data download returned zero option contracts for each of these underlyings. As a stand-in, it used an S&P 500 futures chain with a futures mid of 0.00 and no implied volatility data, and notes that the data is 4.6 days old. So there are no usable options or Greeks figures in the PDFs. Everything in the options sections above comes from my own Black-76 calculations using public volatility figures.
The inputs contradict each other. The same bot’s margin per contract appears as $500 in the term sheet, $1,500 in the summary and $20,000 in the trading analysis. Its capital appears as $9,000 in two documents and $25,000 in another, while the script defaults to $50,000. The scripts reference contract month codes for June, July and August 2026 contracts, which have expired, while the term sheet refers to November, December and January contracts. A bot has to be pointed at the right contract to trade.
The summary metrics are projections. The portfolio summary’s average Sharpe of 1.65, win rate of 55.4% and 15.7% Kelly fraction are labelled as AI projections from a plan file, and the Python script headers describe their own profit as an “estimate”. The combined P&L of $23,849,452.90 on a $125,000 allocation, a 19,079.6% return, is just the Bitcoin artifact summed in.
To see what the trade counts can and cannot support, use the Wilson score interval for a win rate. For k wins in n trades, with z = 1.96 for 95% confidence:
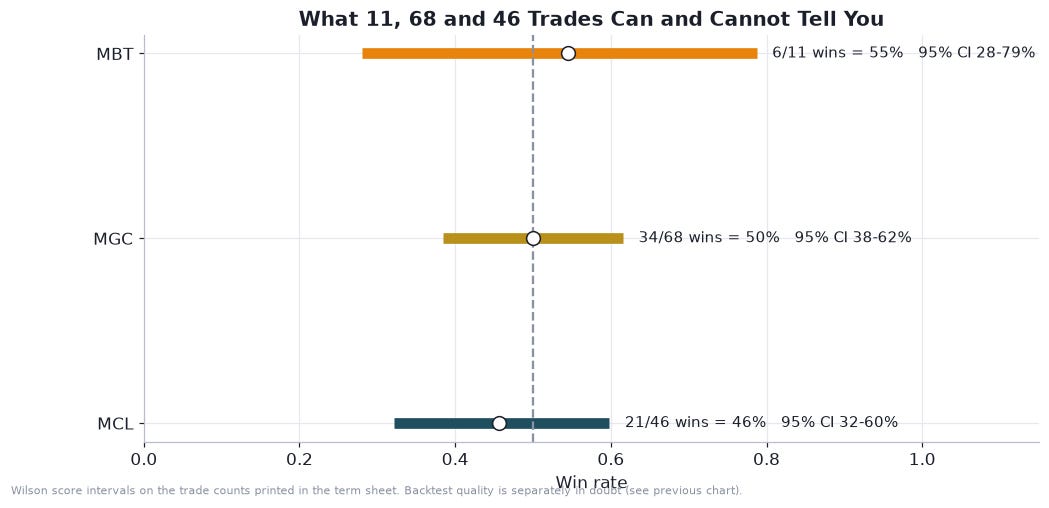
Applied to the term sheet’s trade counts, the Bitcoin bot’s six wins in eleven trades gives a 95% interval of about 28% to 79%, which cannot distinguish a good strategy from a coin flip. The gold bot’s 34 wins in 68 trades gives about 38% to 62%, and the crude bot’s 21 wins in 46 trades gives about 32% to 60%. All three include 50%. Even if the data were clean, the sample sizes would not prove an edge. And a win rate by itself says nothing about expectancy, as equation 10 reminds us.
Finally, the Sharpe ratio, which the term sheets report, is the mean excess return divided by its volatility:
where N is the number of periods per year. A Sharpe of 1.49 computed from 11 trades has a sampling error comparable to its own size, and it is mathematically inconsistent with a 60,810% drawdown. Ratios derived from a corrupted return series are noise.
What I would take from all this
Strip away the broken backtests and what remains is useful: three clearly stated theses, a consistent risk skeleton, and a market that has just given us a very informative day. Here is how I would summarize each.
Bitcoin short. The thesis is aligned with the trend. The put wall at $60,000 is a real feature of the market, and the probability of touching it in the next month is higher than the probability of finishing below it. The risks are a squeeze, since funding is negative and the move is already 22.6% in 26 days, and event gaps around November 17 and 18. A defined-risk bear put spread or a short future with a protective call sizes the risk better than a naked short. A weekly close above $70,000 to $72,000 would change my mind.
Gold long. The thesis is the one under the most pressure. The dominant driver is real rates and the dollar, the price is at a one-year low, and the report’s own day-of analysis disagrees with the bot’s direction. It is also the largest risk contributor. If you want exposure to a Fed pivot, a call spread or collar expresses it with a cap on the loss, and the key dates are Warsh’s remarks and the November 18 minutes, then the December 9 decision. Without a rates signal, the trend filter is doing the right thing by keeping the bot flat.
Crude long. The thesis is a bet on a premium the market is already discounting. The distribution is two-humped, so convex structures such as call spreads suit it better than a tight stop on a fast bar. The signals to watch are tanker insurance and freight rates, actual throughput through the strait, the IEA surplus estimate and China’s demand data.
The book. Gold carries about two thirds of the risk. If I could change one thing in a three-bot account, it would be to size by risk contribution instead of by the contract count. Use stops, but remember that they work on bars, and the next two weeks are full of gap events.
I will leave you with a thought about method. The most valuable output of this exercise was not a forecast. It was a set of numbers that tell you how big a normal move is, how likely the levels you care about are to be touched, and how much of your account each position puts at risk. Prices will do what they do. Position sizes and structures are what you control.
This article is for educational purposes only and is not financial advice or a recommendation to buy, sell or hold any instrument. Trading futures, options and crypto involves substantial risk of loss. All prices, strikes, volatilities, probabilities and correlations marked illustrative or assumed are for teaching purposes. Sources for market data include CoinDesk, Fortune, ChainRegistry, Deribit-derived data summaries, Derivasys, Volmex, CNBC, Reuters, Investing.com, Newsquawk and the Cboe volatility indices as of November 16, 2026. Verify all figures independently before making any decision.