


Spot data as of the November 9, 2026 daily close (UTC). Derivatives data from a live snapshot taken at 11:57 a.m. ET on November 10, 2026. Written November 10, 2026. Not investment advice.
Bitcoin closed Monday, November 9, 2026 at $75,223. On October 6, 2025 it closed at $124,753, its highest close ever, after touching an intraday high of about $126,198. Since then the price has fallen about 40%, with a low of $58,559 on June 30, 2026 (an intraday low of about $57,748 came the next day). It rallied more than 40% into September, then turned down again. When the derivatives snapshot for this article was taken, late in the morning of November 10 and a few hours after a hotter-than-expected U.S. inflation report, the Deribit BTC index stood at $72,739.
For an asset that many investors bought in 2024 and 2025 as “digital gold” or as a play on a friendlier Washington, 2026 has been a hard year. U.S. spot bitcoin ETFs, which took in more than $56 billion in their first two years, are net sellers for 2026. Last week’s midterm elections handed Congress to a party seen as less friendly to crypto. A record $6.3 billion theft from Binance on October 29 shook confidence in the largest exchange. And the Federal Reserve, which cut rates through 2025, is now openly discussing a rate hike in December.
None of that tells you where bitcoin goes next. This article tries to answer a narrower and more useful question: what do the data say about the range of likely moves, and how are the spot, futures and options markets pricing them? It uses three lenses:
Quantitative analysis measures how bitcoin behaves: its returns, volatility, tails, drawdowns, correlations with other assets, its four-year halving cycle, and a range of simulated outcomes.
Fundamental and on-chain analysis looks at what can be measured about the network and its demand: the supply schedule, mining economics, ETF flows and the macro backdrop. Bitcoin has no earnings or cash flows, so there is no DCF here. I explain why, and what to look at instead.
Derivatives and technical analysis reads what traders are paying for leverage and protection, through futures basis, perpetual funding and the options surface, and where price levels and trends stand.
Everything is built from public data, and every chart lists its source. Every formula is written out with each symbol defined. Where a number is my assumption rather than a measured fact, I say so. Where I could not verify something, I flag it.
Executive summary
The trend is down, but the cycle is late. Bitcoin is 933 days past the April 2024 halving. In the previous three cycles, prices peaked 372, 525 and 546 days after the halving, and this cycle peaked on day 534. Cycle troughs came on days 777, 889 and 924. The June 2026 low came on day 801. If the pattern holds, which it may not, the worst of the bear market could already be behind us, or close. Each cycle has been smaller than the last. Peak gains from halving day were 91x, 30x and 7.9x in the first three cycles and only 1.9x this time. Peak-to-trough drawdowns were 84%, 83% and 77%, and 53% so far.
Volatility is lower than it used to be, but still high. One-year realized volatility is 44%, down from 80% to 140% in bitcoin’s early years. Deribit’s DVOL index, a 30-day implied volatility measure, is 40.6. The options market prices a move of about 10.7% by December 25 and about 19% by March 26, 2027, measured by the cost of an at-the-money straddle.
The options market leans bearish. Puts cost more than calls at every expiry. The 25-delta risk reversal is about −5 to −8 volatility points at the front of the curve and about −2 points a year out. The risk-neutral distribution for March 26, 2027 puts about 19% probability below $60,000, about 17% above $90,000 and about 8% above $100,000. It puts only about 1% probability on a new record by March.
Leverage is modest and carry is thin. Deribit’s dated futures trade at about 5.4% to 5.7% annualized over spot, roughly 1.2 to 1.5 points above the 4.19% Treasury-bill yield. Binance perpetual funding has averaged 7.1% annualized over the past 30 days and 3.5% over the past year, far below the 30% average of 2021. This is not the excess leverage of a market top.
Institutional demand has stalled. U.S. spot ETFs have taken in $55.6 billion net since they launched in January 2024, below the $62.7 billion peak reached on October 9, 2025. Flows for 2026 to date are −$1.03 billion, and November so far is −$1.48 billion. June 2026 was the worst month on record, at −$4.51 billion.
The network is healthy, and its miners are under pressure. Supply is 20.11 million BTC, 95.8% of the 21 million cap, growing at 0.82% a year. The hash rate averaged about 1,027 exahashes per second over the past 30 days, about 7% below a year ago. Hashprice, a measure of miner revenue per unit of computing power, is about $39 per petahash per day, down from about $48.
Simulations give a wide range. My one-year Monte Carlo, using a T-bill drift and 44% volatility (both my assumptions), gives a median of about $71,000 and a 90% range of about $34,000 to $148,000. A bootstrap of actual returns gives a similar median and a wider range. Under both methods, the chance of a new record within a year is about 10% to 12%.
For the March 2027 expiry, I define three scenarios: bear below $60,000, base $60,000 to $90,000, and bull above $90,000. The options market gives them about 19%, 63% and 17%. My GBM simulation gives 22%, 55% and 23%, and the bootstrap gives 26%, 49% and 25%. Three different methods tell the same story. The middle is most likely, and both tails are fat.
Where bitcoin stands on November 10, 2026
Start with the price record. Bitcoin’s total return is −9.3% over the past month, +17.7% over three months (measured from the August lows), −8.0% over six months and −28.2% over a year. It is down 14.0% in 2026, from $87,509 at the end of 2025. Over the same year, SPY returned about 12%, and gold, as measured by GLD, was roughly flat.
The past two weeks brought a run of bad news. On October 29, hackers stole about $6.34 billion of digital assets from Binance hot wallets. The exchange’s own incident report says it has replenished 98% of the affected assets from its own funds, that about $2.85 billion was frozen or intercepted, and that the FBI has attributed the attack to North Korea. According to AP and the BBC, it is the largest crypto theft on record.
Then came the midterms. Reuters, via Yahoo Finance, reported that bitcoin and ether fell to their lowest levels in more than two months as investors weighed the prospect of tighter crypto regulation from a Democratic-controlled Congress. FXStreet noted that Senator Elizabeth Warren, a prominent crypto skeptic, is expected to lead the Senate Banking Committee. Bloomberg, via Yahoo Finance, reported that the industry’s next major bill, the CLARITY Act, failed to advance in the Senate in September. On November 5, when the Nasdaq fell 5.5% in an AI-led sell-off, bitcoin fell 5.6% according to The Block. Over the weekend, CoinDesk reported more than $1 billion of leveraged positions liquidated in 24 hours, mostly longs, as headlines about NVIDIA’s CEO and stalled U.S.-Iran talks hit risk assets.
Finally, macro. This morning the Bureau of Labor Statistics reported that consumer prices rose 0.4% in October, against a 0.3% forecast, and core prices rose 0.3%, against 0.2%. CoinDesk reported that bitcoin extended its losses after the release. Bitcoin Magazine quoted Fed Governor Christopher Waller saying that a 50-basis-point hike “should be considered” at the December 9 meeting if inflation ran hot. Rising rate expectations hurt assets that pay no yield, and bitcoin has been no exception this year. The drop to the June low came after a hot inflation report, as Investing.com and CNBC documented at the time.
Data and methods
Here is what the numbers rest on, with as-of dates:
Spot prices: Yahoo Finance BTC-USD daily closes (UTC day) from September 2014 through November 9, 2026. Before September 2014, I use blockchain.com’s market-price series, which starts in 2010. Bitcoin trades every day, so I annualize with 365 days. Stocks and ETFs use 252.
Cross-asset: SPY, QQQ and GLD adjusted closes, the ICE U.S. Dollar Index (DX-Y.NYB) and the CBOE 10-year yield index (^TNX), from Yahoo Finance, through November 9. Cross-asset statistics use weekly Friday closes, because bitcoin’s daily close (midnight UTC) does not line up with the 4 p.m. New York close.
Rates and liquidity: FRED series DGS3MO (4.19%) and DGS10 (4.86%), both as of November 6, 2026, and WALCL (the Fed’s total assets, $6.75 trillion) as of November 4, 2026. The broad trade-weighted dollar series (DTWEXBGS) timed out repeatedly from my machine, so I use the ICE Dollar Index from Yahoo Finance instead.
On-chain: block height 975,324 and the mining and hash-rate APIs from mempool.space; hash rate, difficulty, miner revenue, fees and total supply from blockchain.com’s charts API, through November 9–10, 2026.
ETF flows: daily U.S. spot bitcoin ETF flows from Farside Investors, January 11, 2024 to November 9, 2026. I could not find a free, verifiable source for daily ETF holdings in BTC, so I report flows only.
Futures and funding: Deribit’s public API for dated futures and the perpetual swap. Public endpoints from Binance (USD-M BTCUSDT funding history since September 2019, open interest), Bybit and OKX. CME settlement data was not accessible. CME’s website blocks automated requests, so CME figures appear only as a rough cross-check from Yahoo Finance’s continuous front-month series (BTC=F).
Options: the full Deribit BTC options chain (878 instruments): mark implied volatilities, prices, open interest and forwards, plus the DVOL index history since March 2021. Snapshot taken November 10, 2026 at 16:57 UTC (11:57 a.m. ET).
The spot analysis and the derivatives snapshot are about 17 hours apart, and bitcoin fell about 3% in between. Where the difference matters, I say which one I am using.
The quant view: how bitcoin behaves
Sixteen years of price
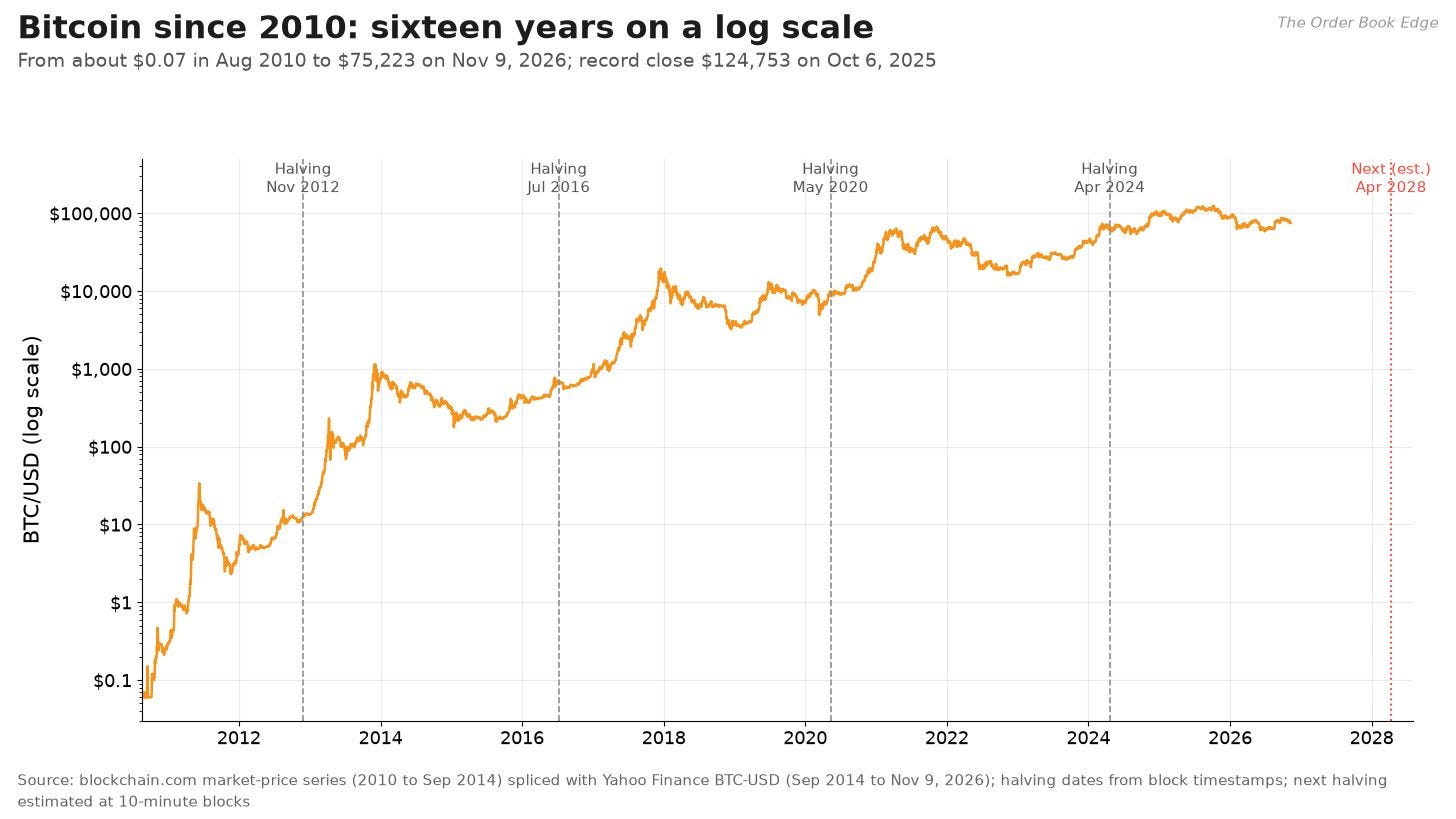
On a log scale, bitcoin’s history looks like a staircase. A dollar spent at the August 2010 price of about $0.07 would be worth more than a million dollars today. That number is not useful for investing decisions. It is useful as a reminder of how far the asset has come and why its early statistics are dominated by its early years. Most of the work below uses the past ten years or less, when bitcoin traded on liquid, regulated venues.
Every return measure starts from daily prices. The definitions, which I use throughout the article, are:

Pₜ is the closing price on day t, Rₜ is the simple return, rₜ is the log return, σ̂ₙ(t) is the annualized realized volatility over the trailing n days, and r̄ₜ is the mean log return over that window. The factor 365 annualizes the variance because bitcoin trades every day of the year. Log returns add up over time, which makes them the natural unit for modeling. Simple returns are what you actually earn.
By window:
10 years: a compound annual growth rate (CAGR) of 59.1%, with 67.2% annualized volatility and a maximum drawdown of −83.4%. For comparison, SPY returned 15.1% with 18.1% volatility, QQQ 20.0% with 22.8%, and gold (GLD) 12.1% with 16.6%.
5 years: 2.4% a year with 50.8% volatility. The five-year window starts almost exactly at the November 2021 peak. SPY returned 11.5% and gold 17.2%.
3 years: 27.0% a year with 46.9% volatility. SPY 21.6%, gold 27.9%.
1 year: −28.2% with 44.3% volatility. SPY +11.7%, gold +0.3%.
The five-year number is a good lesson in how much the start date matters for bitcoin. A buyer at the 2021 top has made almost nothing in five years, while a buyer at the 2022 bottom has more than quadrupled their money.
Risk-adjusted returns
The Sharpe ratio measures excess return per unit of total volatility. The Sortino ratio counts only downside volatility:

μ is the annualized mean return, r_f is the risk-free rate (the 3-month Treasury-bill yield, 4.19%), σ is annualized volatility, σ_D is annualized downside deviation, A is the number of periods per year (365 for bitcoin, 252 for ETFs), and n is the number of observations.
Over ten years bitcoin’s Sharpe ratio is 0.96 and its Sortino ratio 1.44, better than SPY (0.64 and 0.89), QQQ (0.73 and 1.03) and gold (0.52 and 0.73). Over five years the ranking reverses: bitcoin’s Sharpe is 0.22, against 0.48 for SPY and 0.71 for gold. Over the past year it is −0.62. Bitcoin has paid investors well for its risk over a full cycle, but not over shorter windows that start near a peak.
Volatility: lower than it was, still high
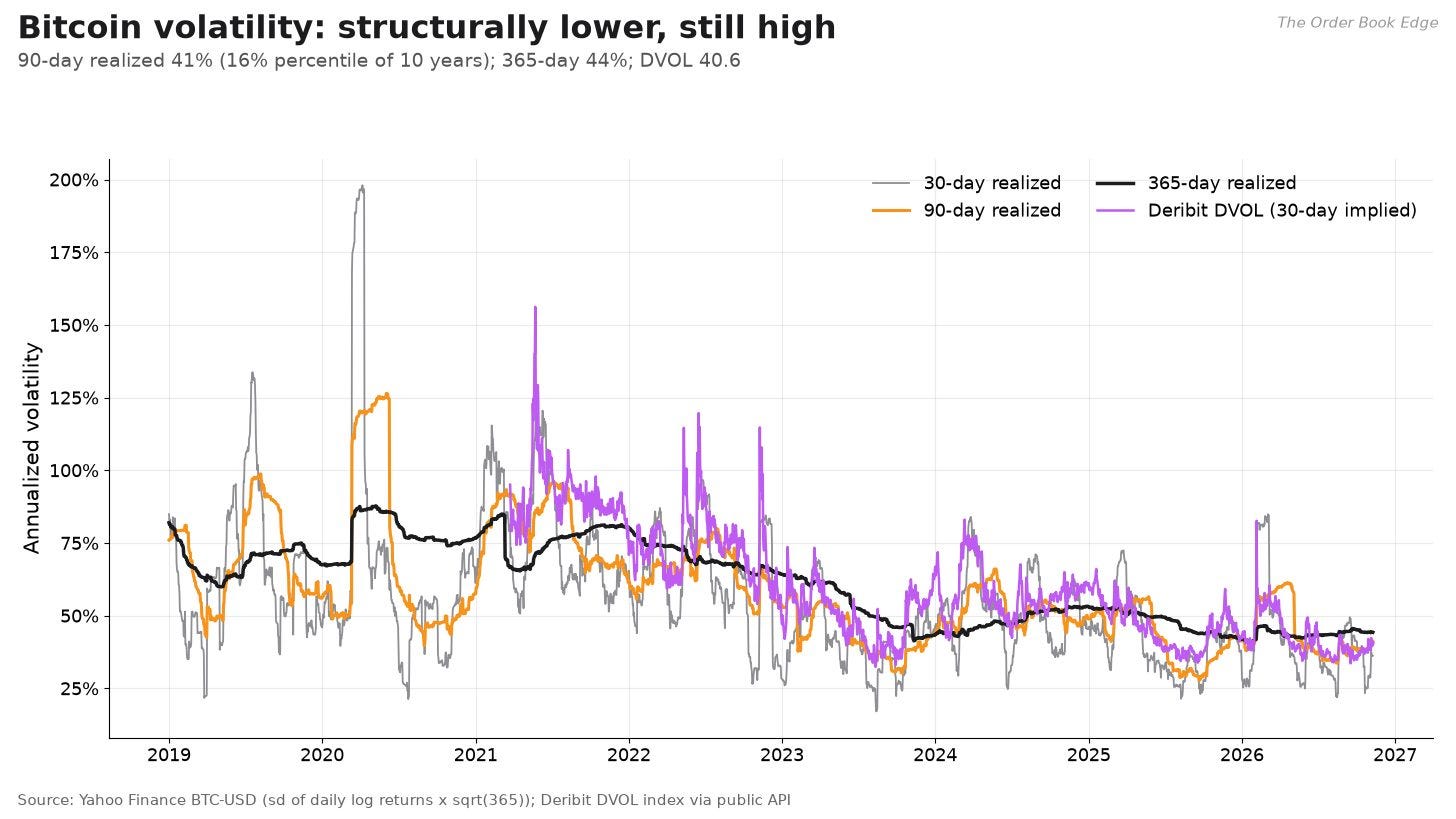
Bitcoin’s volatility has fallen steadily as the market has grown. Annualized volatility was 138% in 2011 and 140% in 2013. It was 94% in 2017 and 80% in 2021. It was 43% in 2023, 42% in 2025 and 45% so far in 2026. The lowest 90-day reading of the past decade, 27.7%, came on September 21, 2025, two weeks before the all-time high. Low volatility near a peak is a pattern seen in other markets too: it can encourage leverage just when risk is building.
Today, 30-day realized volatility is 36.2%, 90-day is 41.1% (the 16th percentile of the past ten years) and 365-day is 44.3%. Deribit’s DVOL index, which measures the 30-day implied volatility priced into options, is 40.6. Over the past year DVOL has ranged from 33.6 to 82.6, peaking on February 5, 2026. Its all-time low since the index began in March 2021 is 32.4, in August 2023. Implied volatility is roughly in line with realized volatility, which means options are not pricing in panic.
Fat tails and the shape of returns
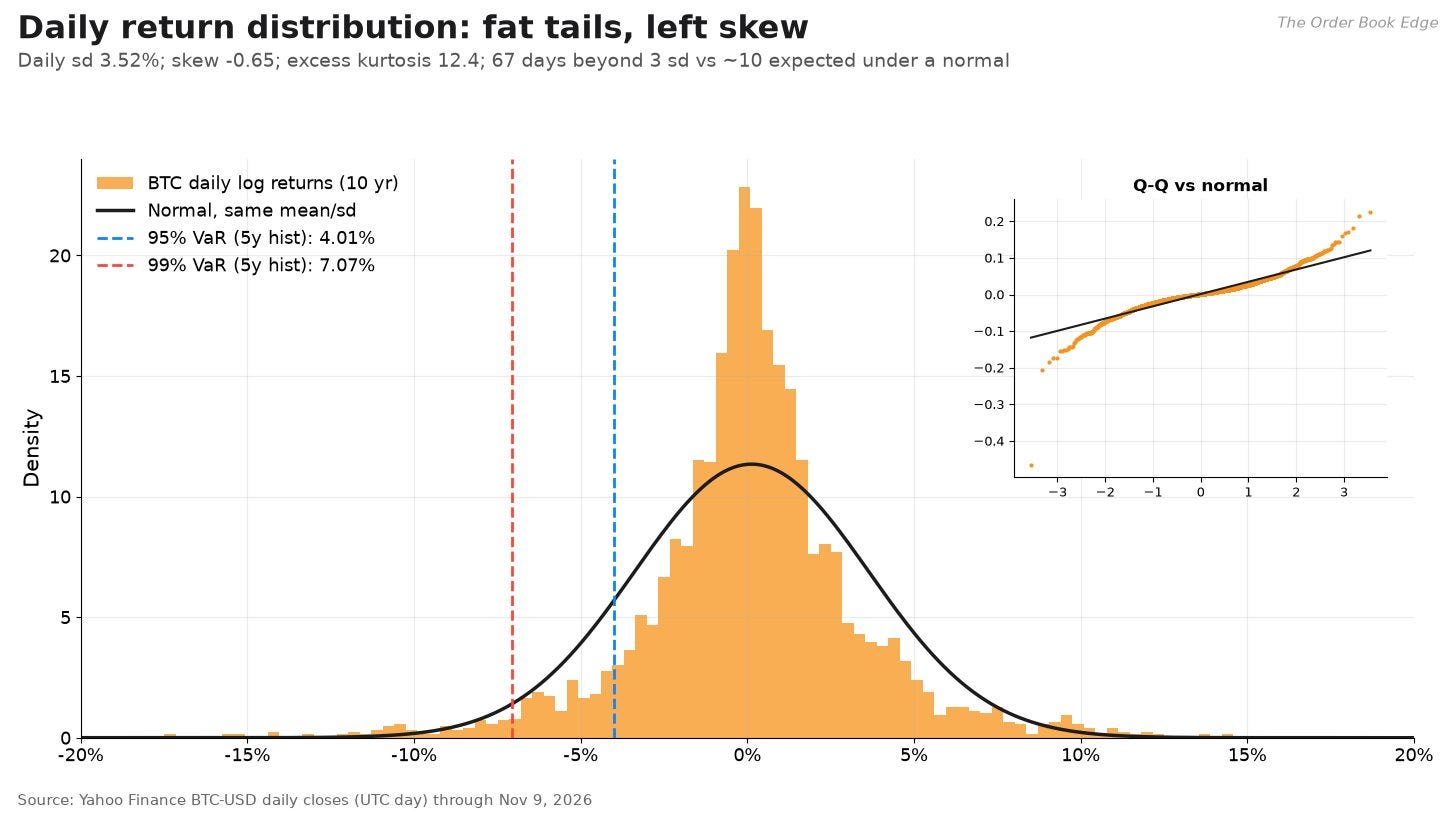
Over the past ten years (3,653 days), bitcoin’s average daily log return was 0.13%, with a standard deviation of 3.52%. The distribution has a skew of −0.65 and an excess kurtosis of 12.4. A normal distribution has zero of both. The Jarque-Bera statistic is about 23,500, a decisive rejection of normality. There were 67 days with moves larger than three standard deviations, against about 10 expected under a normal distribution. The best day was +25.2% on December 7, 2017. The worst was −37.2% on March 12, 2020. Bitcoin rose on 52.1% of days.
Negative skew is worth noting. Unlike NVIDIA or many growth stocks, whose biggest days tend to be up days, bitcoin’s largest moves have more often been sudden crashes, usually driven by forced liquidations of leveraged positions.
Value at risk and expected shortfall
Value at risk (VaR) is the loss you would exceed on only a small share of days. Expected shortfall, or conditional VaR (CVaR), is the average loss on those worst days:


α is the confidence level (95% or 99%), Q_(1−α)(R) is the (1−α) quantile of daily simple returns, E[·|·] is a conditional average, μ_d and σ_d are the daily mean and standard deviation, z_(1−α) is the standard normal quantile (−1.645 at 95%, −2.326 at 99%), and VaR^N is the version that assumes normal returns. The Cornish-Fisher quantile z_(CF) adjusts z for sample skewness s and excess kurtosis κ, and replaces z in the normal formula.
Over the past year, the one-day 95% historical VaR is 3.41% and the 99% figure is 5.40%. The 99% expected shortfall is 8.17%. Over five years, the 95% VaR is 4.01%, the 99% VaR is 7.07%, and the 99% expected shortfall is 9.61%. The normal model gives a five-year 99% VaR of only 6.14%, while the Cornish-Fisher correction gives 8.67%. The normal model understates the far tail by about a third. For a holder of $100,000 of bitcoin, a one-in-a-hundred day costs about $7,000 by the historical measure, and the average such day costs nearly $10,000.
Drawdowns
Define the drawdown as the decline from the running peak:

max_(s≤t) Pₛ is the highest price up to day t, and MDD is the maximum drawdown over the sample.
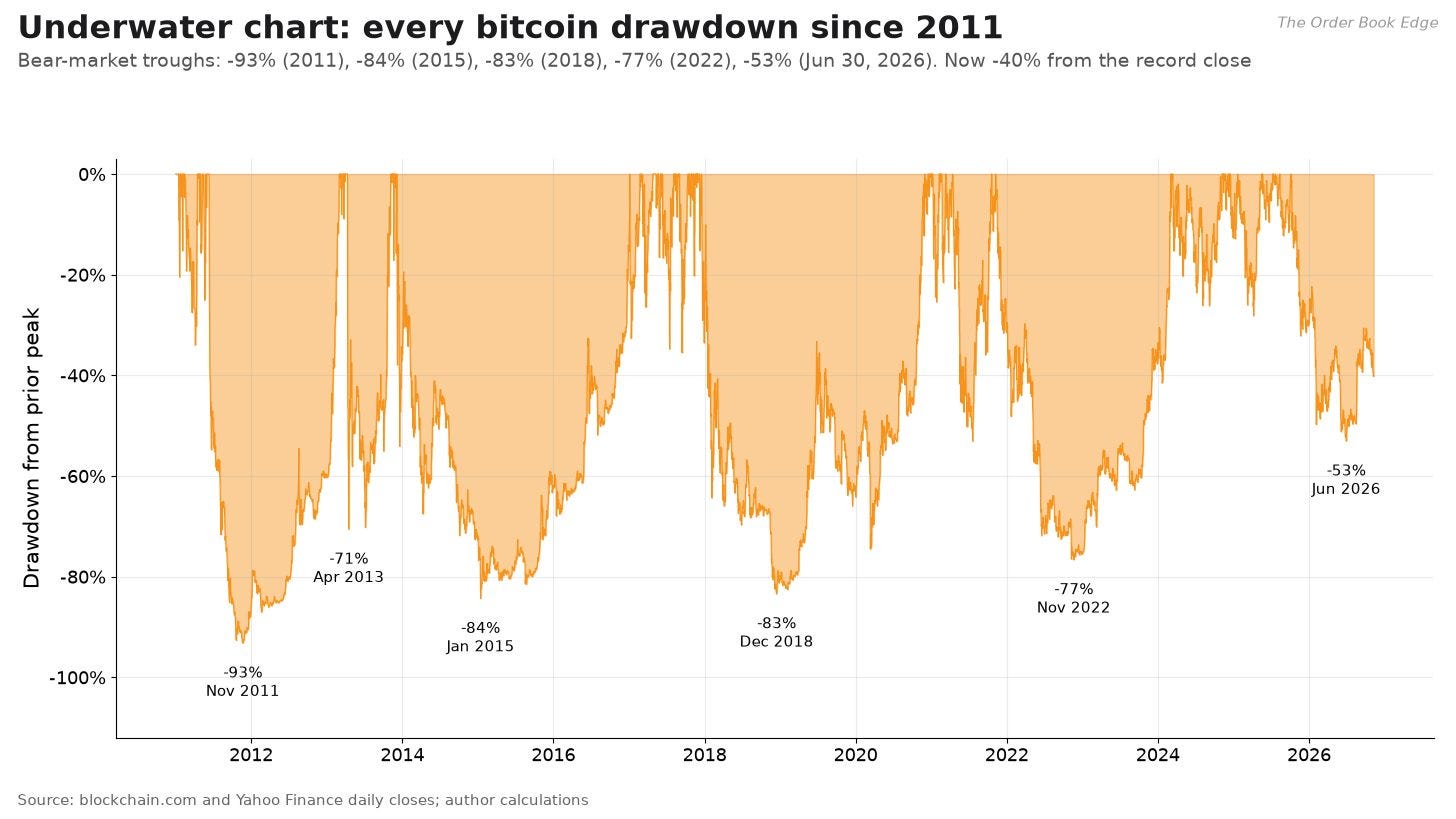
Bitcoin’s bear markets since 2011:
−93%: June 2011 to November 2011. Recovered March 2013.
−84%: December 2013 to January 2015. Recovered January 2017.
−83%: December 16, 2017 to December 15, 2018. Recovered November 30, 2020.
−77%: November 8, 2021 to November 21, 2022. Recovered March 4, 2024.
−53%: October 6, 2025 to June 30, 2026, on closing prices. Not recovered. Today the drawdown is −40%.
There were also many smaller declines of 25% or more, including a −71% crash in April 2013 and others in 2021 (−53% from April to July), 2024 (−26%) and early 2025 (−28%). The current bear market is the shallowest of the four post-halving bear markets so far. CNBC quoted one analyst at the time attributing this to a larger, more institutional investor base. That explanation is plausible but unproven. A milder drawdown could also mean the bear market is unfinished.
Correlation and beta: what bitcoin trades with
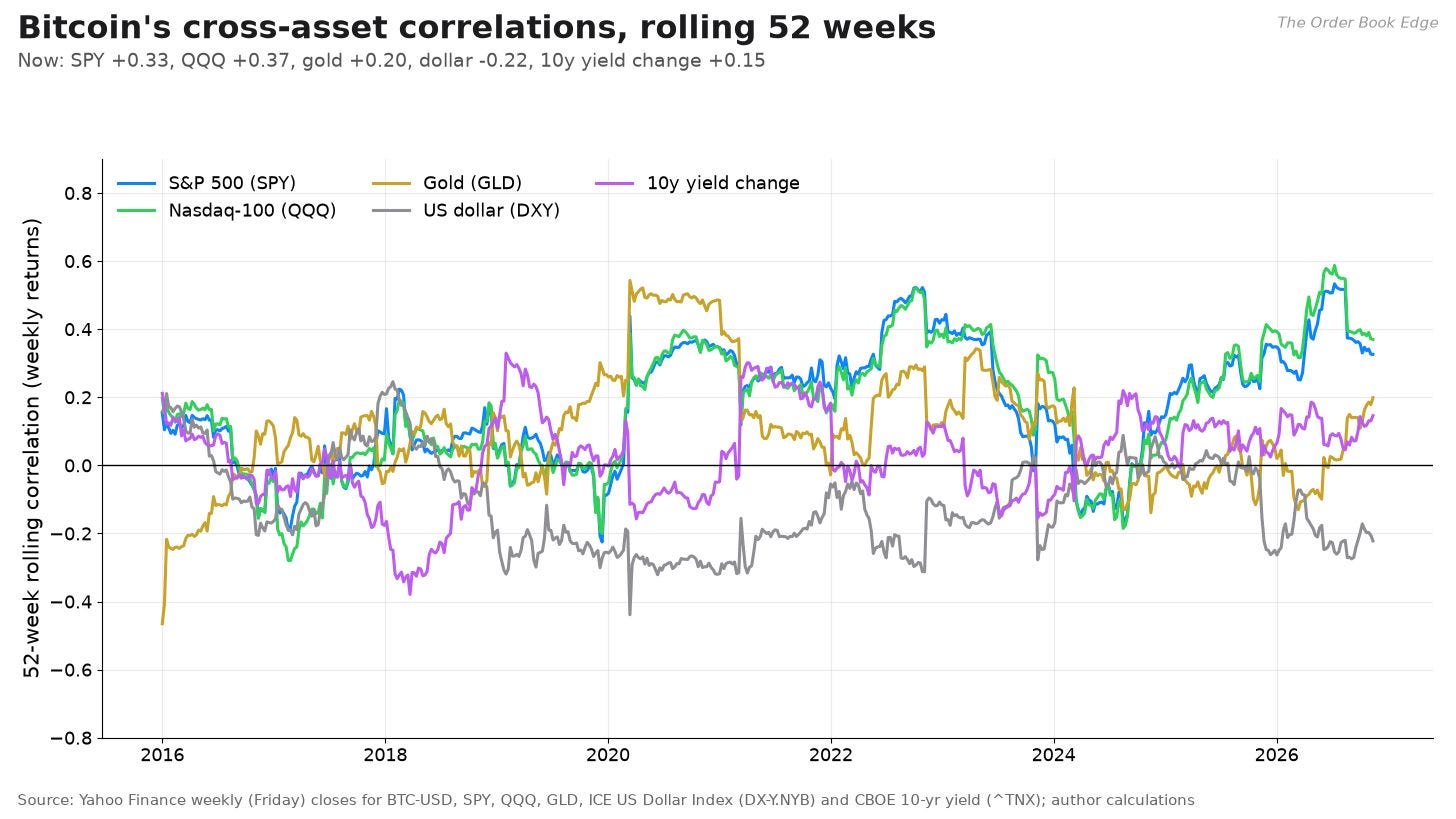
A beta regression measures how much bitcoin moves with another asset:

r^(BTC)w and r^X_w are weekly log returns of bitcoin and the comparison asset X, α is the intercept, β is the sensitivity, ε_w is the residual, ρ is the correlation, and σ(BTC) and σ_X are the two volatilities. For the 10-year yield, r^X_w is the weekly change in yield in percentage points.
Over the past year, bitcoin’s weekly correlation is +0.32 with SPY, +0.37 with QQQ, +0.18 with gold, −0.20 with the dollar index and +0.13 with changes in the 10-year yield. The beta to SPY is 1.14 (t-statistic 2.4) but the R-squared is only 0.10, so the stock market explains about a tenth of bitcoin’s weekly variance. Over five years the SPY beta is 0.90 (t = 4.9, R-squared 0.08), and the gold beta is 0.36 (t = 2.0, R-squared 0.01).
Three conclusions follow. First, bitcoin trades more like a high-beta technology asset than like gold. Its correlation with the Nasdaq-100 is about twice its correlation with gold. Its rolling 52-week correlation with SPY reached 0.53 in July 2026, near the highest of the past decade. Second, that correlation is unstable. It moved from near zero in 2016 to 2019 to above 0.5 during the 2022 and 2026 sell-offs. Third, the “digital gold” story is weak on the data. Bitcoin’s correlation with gold is low and its correlation with the dollar is only mildly negative. Over three years gold actually beat bitcoin on a risk-adjusted basis, with a 27.9% annual return and a Sharpe ratio of 1.05 against bitcoin’s 0.66.
The halving cycle
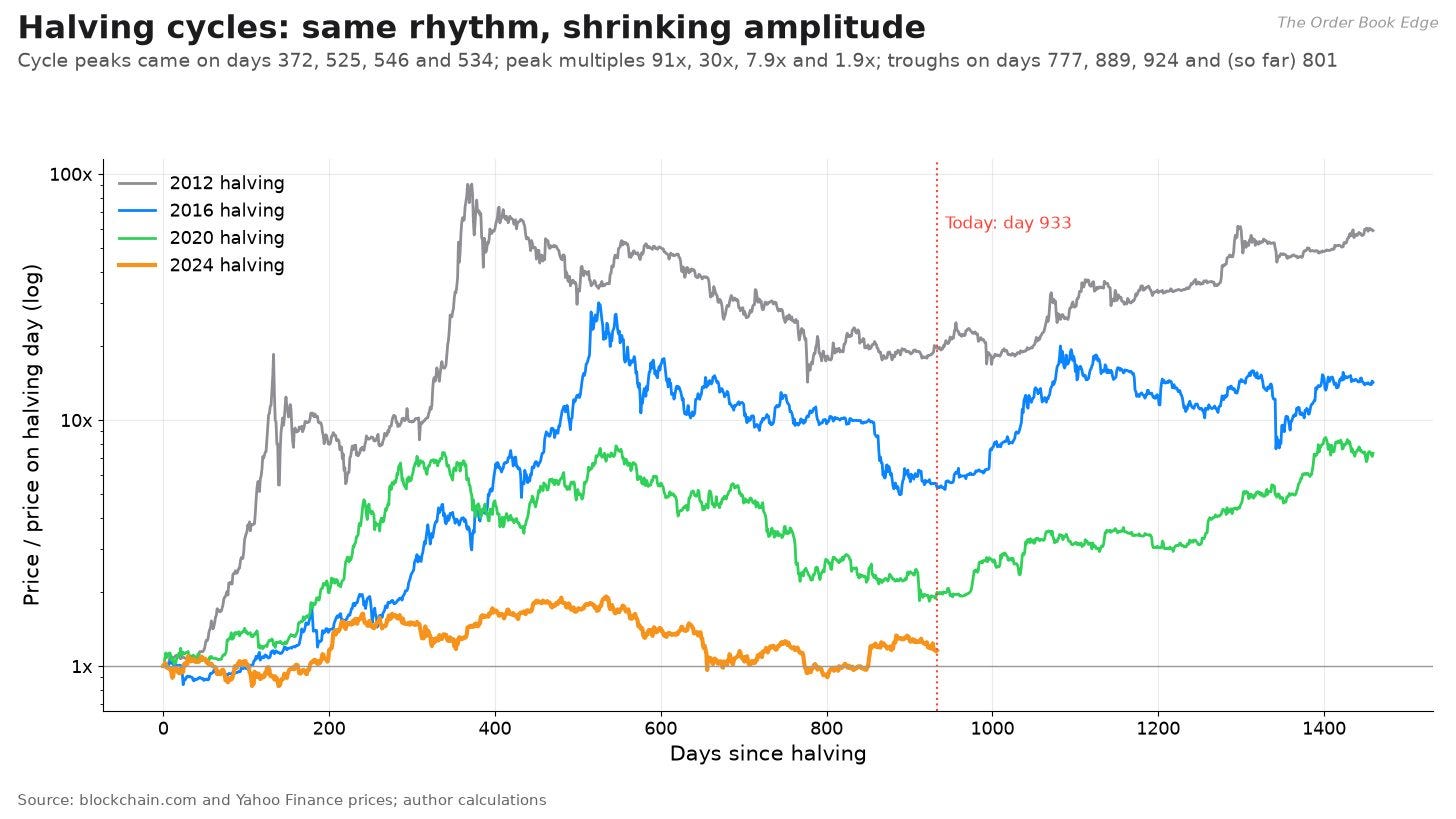
Roughly every four years, every 210,000 blocks, the reward paid to miners for each new block is cut in half. There have been four halvings: November 28, 2012, July 9, 2016, May 11, 2020 and April 20, 2024. The chart indexes each cycle to the price on halving day and plots the four cycles on top of each other.
The timing has been remarkably consistent:
2012 cycle: peak on day 372 at 91x the halving price. Trough on day 777, down 84% from the peak.
2016 cycle: peak on day 525 at 30x. Trough on day 889, down 83%.
2020 cycle: peak on day 546 at 7.9x. Trough on day 924, down 77%.
2024 cycle: peak on day 534 at 1.9x. Low so far on day 801, down 53%.
Today is day 933. On the same day in previous cycles, bitcoin traded at 19.6x, 5.3x and 2.0x its halving-day price. Today it is at 1.15x.
There are two ways to read this. The cyclical reading says the pattern is intact. The peak came on schedule, the trough probably came in June on schedule, and the next leg up should start before the 2028 halving. The skeptical reading notes that four observations are not a statistical sample, that each halving matters less as issuance shrinks (see the supply section), and that the cycle may reflect the four-year rhythm of global liquidity and investor psychology as much as mining rewards. The shrinking amplitude is the most robust finding: each cycle’s peak multiple has been roughly a quarter to a third of the previous one’s. Even if the timing pattern holds, there is little reason to expect the next cycle to produce the gains of earlier ones.
This cycle has also differed in its drivers. In earlier cycles, the marginal buyer was a retail investor on a crypto exchange, often using leverage, and the rally after each halving was fed by new users. In this cycle, the marginal buyer was an ETF investor or a listed company adding bitcoin to its balance sheet, and much of the buying came before the halving. ETFs launched three months before the April 2024 halving and took in about $12 billion in that period, according to Farside’s data. That front-loading may explain why the post-halving rally was so much smaller. It may also mean that the four-year rhythm matters less than it used to, and that flows, rates and regulation now matter more. If so, the June 2026 low may not be “the” cycle bottom in the old sense, and the next rally may depend on the return of institutional demand rather than on the calendar. I lean toward treating the cycle as one input among several, not as a map.
Seasonality
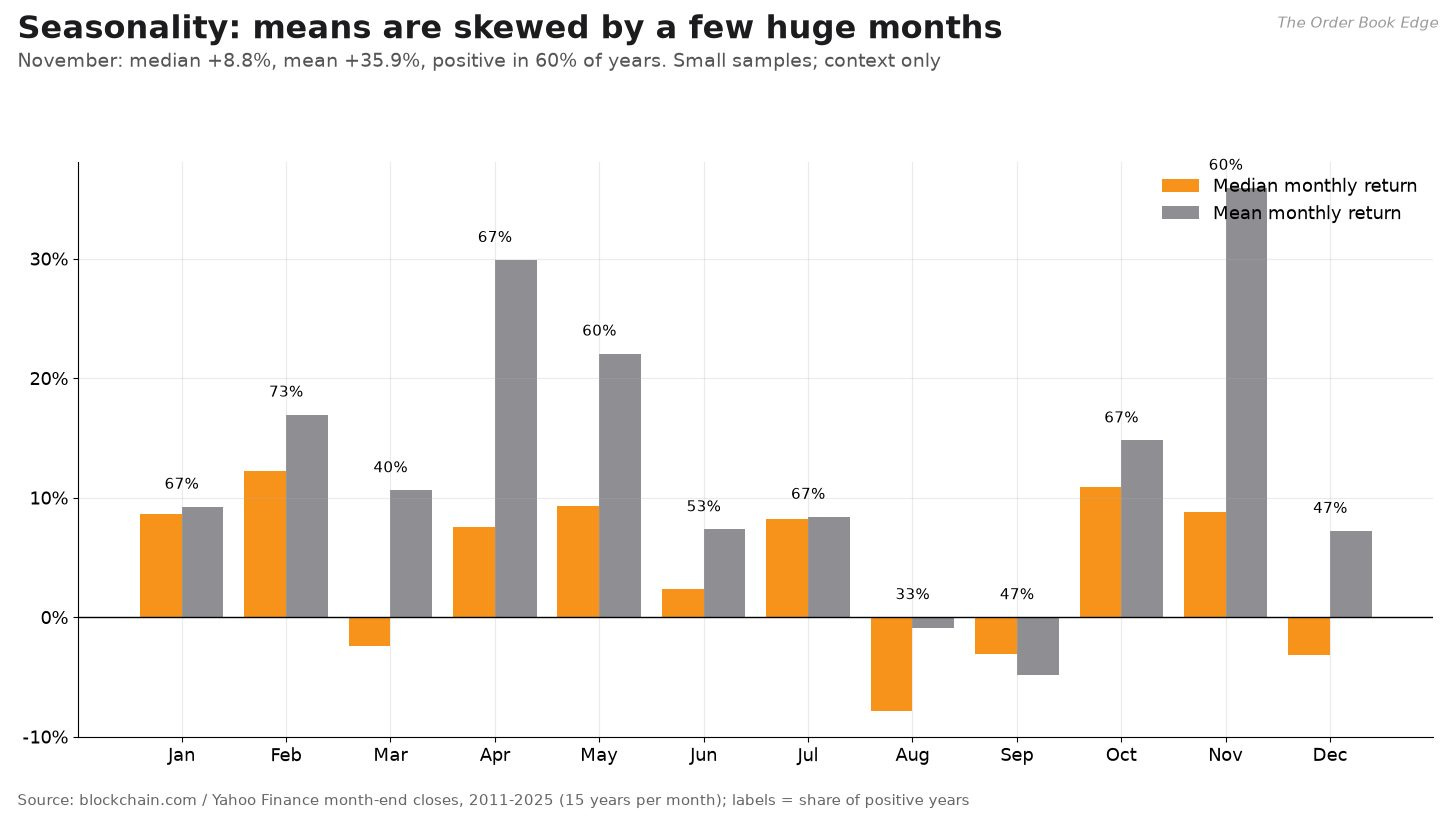
Monthly returns from 2011 to 2025 show the danger of using averages for bitcoin. November has the highest mean return, +35.9%, but its median is +8.8%, and it was positive in only 60% of years. The gap comes from a few huge Novembers, such as 2013 and 2020. February (median +12.2%, positive 73% of the time) and October (median +10.9%, positive 67%) have been more consistent. August (median −7.9%, positive 33%) and September (median −3.1%) have been the weakest months. With 15 observations per month, none of this is statistically reliable. I include it as context, not as a signal.
Momentum and mean reversion
Day-to-day, bitcoin’s returns are close to random. The lag-1 autocorrelation of daily log returns over five years is −0.02. Variance ratios, which compare the variance of multi-day returns with a scaled one-day variance, are 1.01 at 7 days, 1.06 at 30 days and 1.17 at 90 days. A ratio above 1 points to trending behavior at longer horizons, consistent with the long trending phases of the halving cycle.
RSI-based conditioning tells a similar story. Over ten years, when the 14-day RSI was below 30 (143 days), bitcoin’s average 30-day forward return was +5.6%, positive 64% of the time. When RSI was above 70 (453 days), the average was +14.3%, positive 73% of the time. Across all days the average was +6.3%, positive 56% of the time. Strength has tended to lead to more strength. Oversold readings have produced slightly better-than-average hit rates but below-average returns.
Monte Carlo: a range of one-year outcomes
The standard model for a price that cannot go below zero is geometric Brownian motion (GBM):

Sₜ is the price at time t, μ is the drift (expected return per year), σ is annual volatility, Wₜ is a standard Brownian motion whose increments are normal with mean 0 and variance dt, S₀ is today’s price and T is the horizon in years. The −σ²/2 term is the volatility drag. At 44% volatility it costs about 10 percentage points a year in median growth.
Because GBM assumes normal returns, I also run a block bootstrap, which resamples actual returns in 7-day blocks to keep fat tails and short-term clustering:

rₜ is a historical daily log return from the past five years, r̄ is their mean, σₕ is their annualized volatility, r̃ₜ is the return recentered to the chosen drift, r̃⁽ʲ⁾ₖ is the k-th return drawn for simulated path j, and S⁽ʲ⁾_T is that path’s final price.
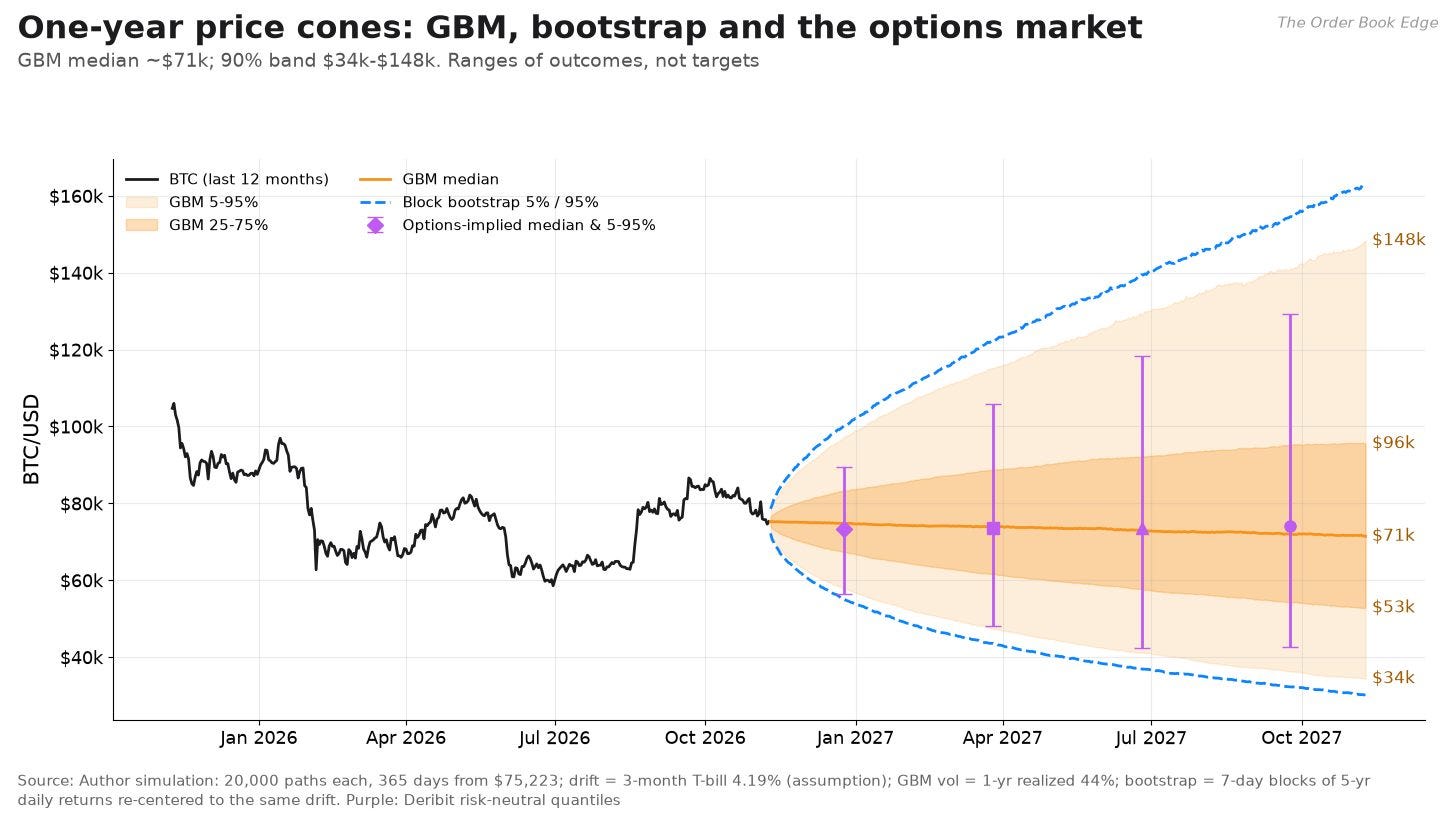
Simulation assumptions (the author’s): 20,000 paths per method, 365 days, starting from the November 9 close of $75,223. The drift is the 3-month T-bill yield, 4.19%. I chose it deliberately. Bitcoin has no cash flows to anchor an expected return, and I do not want the simulation to assume an answer. Using the risk-free rate also makes the simulation comparable to the options market, which prices in risk-neutral terms. GBM volatility is the one-year realized 44.3%. The bootstrap draws from five years of returns, whose volatility is 50.8%.
Results:
GBM: median one-year price about $71,400. Interquartile range about $52,800 to $95,500. 5th to 95th percentile about $34,400 to $148,300.
Bootstrap: median about $70,400. 5th to 95th percentile about $30,200 to $162,900.
Probability of finishing above today’s price: about 45%, because the drift is smaller than the volatility drag.
Probability of a new record above $126,198 within a year: about 10% (GBM) and 12% (bootstrap).
Probability of finishing below $50,000: about 21% and 25%.
Probability of a further decline of more than 30% from a running peak at some point in the year: about 78% and 83%.
The purple markers show the options market’s own risk-neutral medians and 5–95% ranges for four expiries (see the options section). They sit inside the Monte Carlo cones and are a bit narrower, because implied volatility (about 40%) is a bit below the volatilities I used. The takeaway is the width. Even with no directional view at all, bitcoin’s plausible one-year range runs from roughly half today’s price to roughly double it.
What the cones leave out
Monte Carlo results are only as good as their assumptions, and three of mine are worth stating plainly. First, volatility is not constant. Bitcoin’s volatility comes in clusters: calm months are followed by calm months and violent weeks by violent weeks. GBM ignores that entirely, and the 7-day block bootstrap captures it only within each block. A volatility regime shift, like the one from 2021’s 80% to 2023’s 43%, would change the width of the cones a great deal. Second, the drift is a placeholder. I used the T-bill rate because I have no defensible estimate of bitcoin’s expected return, not because I think it will earn exactly that. A one-point change in assumed drift moves the median by about 1%, while a ten-point change in volatility moves the 5th and 95th percentiles by tens of thousands of dollars. Third, neither method knows about the halving cycle, ETF flows or the Fed. They are statistical descriptions of how far the price can travel, not forecasts of where it will go. That is also why I compare them with the options market, which does price in what traders know today.
The fundamental view: supply, miners, ETFs and liquidity
Bitcoin pays no dividends, has no earnings, and gives its holders no claim on anything. You cannot discount its cash flows because there are none. That does not mean fundamentals are irrelevant. It means they have to be measured differently: by the supply schedule, the security and economics of the network, the size and direction of investor demand, and the macro conditions that set the price of money. None of these will hand you a fair value. Together they tell you whether the forces behind the price are strengthening or weakening.
A supply schedule fixed in code
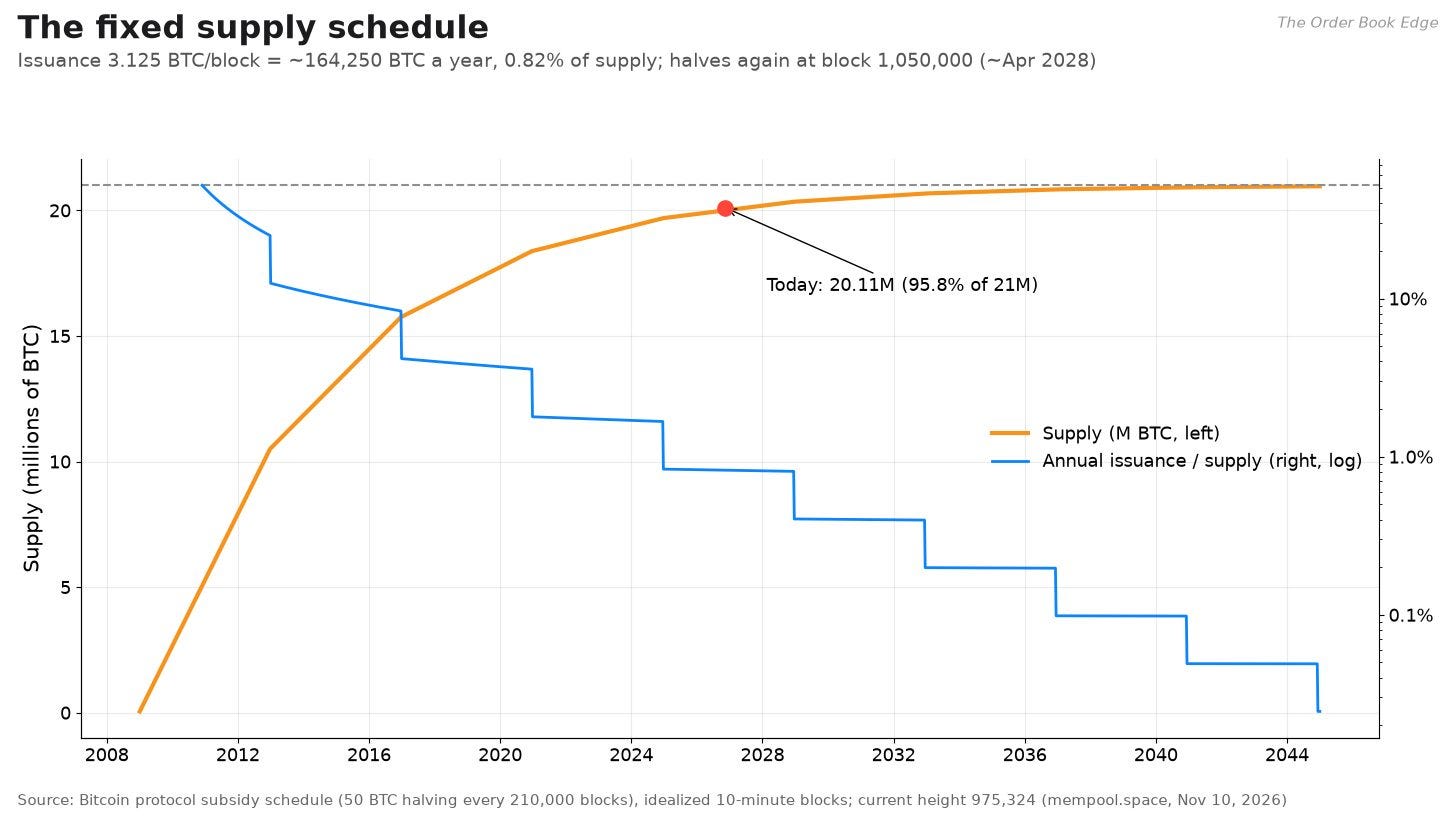
Bitcoin’s issuance is set by its protocol. The block reward started at 50 BTC and halves every 210,000 blocks:

h is the block height, b(h) is the new-coin subsidy per block in BTC, ⌊ · ⌋ rounds down to an integer, Q(H) is the total supply after block H, and π is the annual inflation rate of supply. The factor 144 is the target number of blocks per day, one every ten minutes. (In code, the 21 million cap is approached but never quite reached because of rounding to the smallest unit, the satoshi.)
At block height 975,324 (November 10, 2026), the subsidy is 3.125 BTC per block and supply is about 20.11 million BTC, 95.8% of the eventual total. At the target block rate, new supply is about 164,250 BTC a year, or 0.82% of the existing stock. That is a lower inflation rate than gold’s, which is usually estimated at 1.5% to 2% a year. The next halving, to 1.5625 BTC, comes at block 1,050,000, which is 74,676 blocks away. At ten minutes per block that works out to about April 11, 2028. Blocks have recently been coming in a little more slowly than that (mempool.space shows an average of about 644 seconds over the current difficulty period), so the date could slip toward May.
The supply schedule matters, but its marginal effect is shrinking. At today’s price, annual new issuance is worth about $12 billion. That is real selling pressure, because miners must sell much of what they mine to pay for electricity and equipment. But it is now smaller than many single months of ETF flows. In 2012, the first halving cut annual issuance by 12.5% of the existing supply. In 2028, the cut will be about 0.4% of supply. Each halving is a smaller supply shock than the last, which helps explain the shrinking cycle amplitude.
Stock-to-flow: a model that stopped working
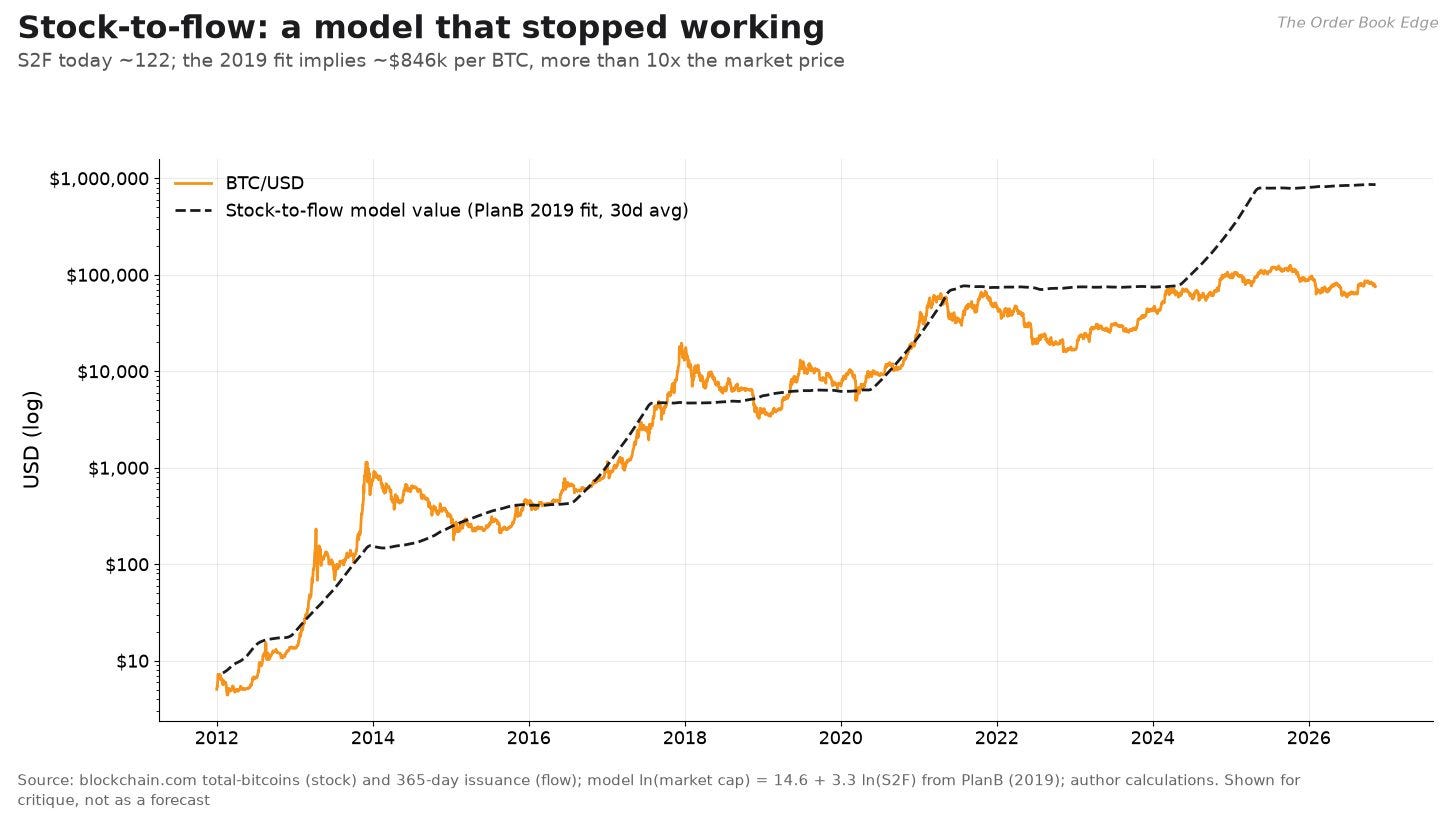
The stock-to-flow (S2F) model, popularized in 2019 by the pseudonymous analyst PlanB, is the best-known attempt to tie bitcoin’s price to its supply schedule. It regresses market capitalization on scarcity:

SFₜ is stock-to-flow, Qₜ is the existing supply, Fₜ is the annual flow of new coins, MCₜ is market capitalization in U.S. dollars, a and b are the regression coefficients from PlanB’s 2019 fit, uₜ is the error term, and P̂ₜ is the model’s implied price per coin.
Bitcoin’s current S2F ratio is about 122. Plug that into the 2019 fit and the model implies a price of roughly $846,000, more than eleven times the market price. After the 2028 halving the ratio doubles to about 248, and the model implies about $8.6 million per coin.
I include the model because readers ask about it, not because it works. Its problems are serious:
It has failed out of sample. The model tracked the price reasonably well through 2020, the period it was fitted on. It has overstated the price by a wide and growing margin ever since. A model that was meant to be the theory of bitcoin’s price is now off by an order of magnitude.
The regression is statistically fragile. Both log market cap and log S2F trend upward over time. Regressing one trending series on another can produce a high R-squared with no real relationship, a well-known problem called spurious regression. Several analysts who tested for cointegration in 2020 and later found the evidence weak.
S2F is known in advance. The halving schedule has been public since 2009. In an efficient market, a predictable supply cut should be priced in long before it happens, not afterward.
It ignores demand. Price depends on how much people want to hold, not just on how much new supply comes on the market. Dodo birds were scarce too.
Supply matters as a constraint. As a valuation model, S2F has not held up. I would not use it to set price targets.
Network security and miner economics
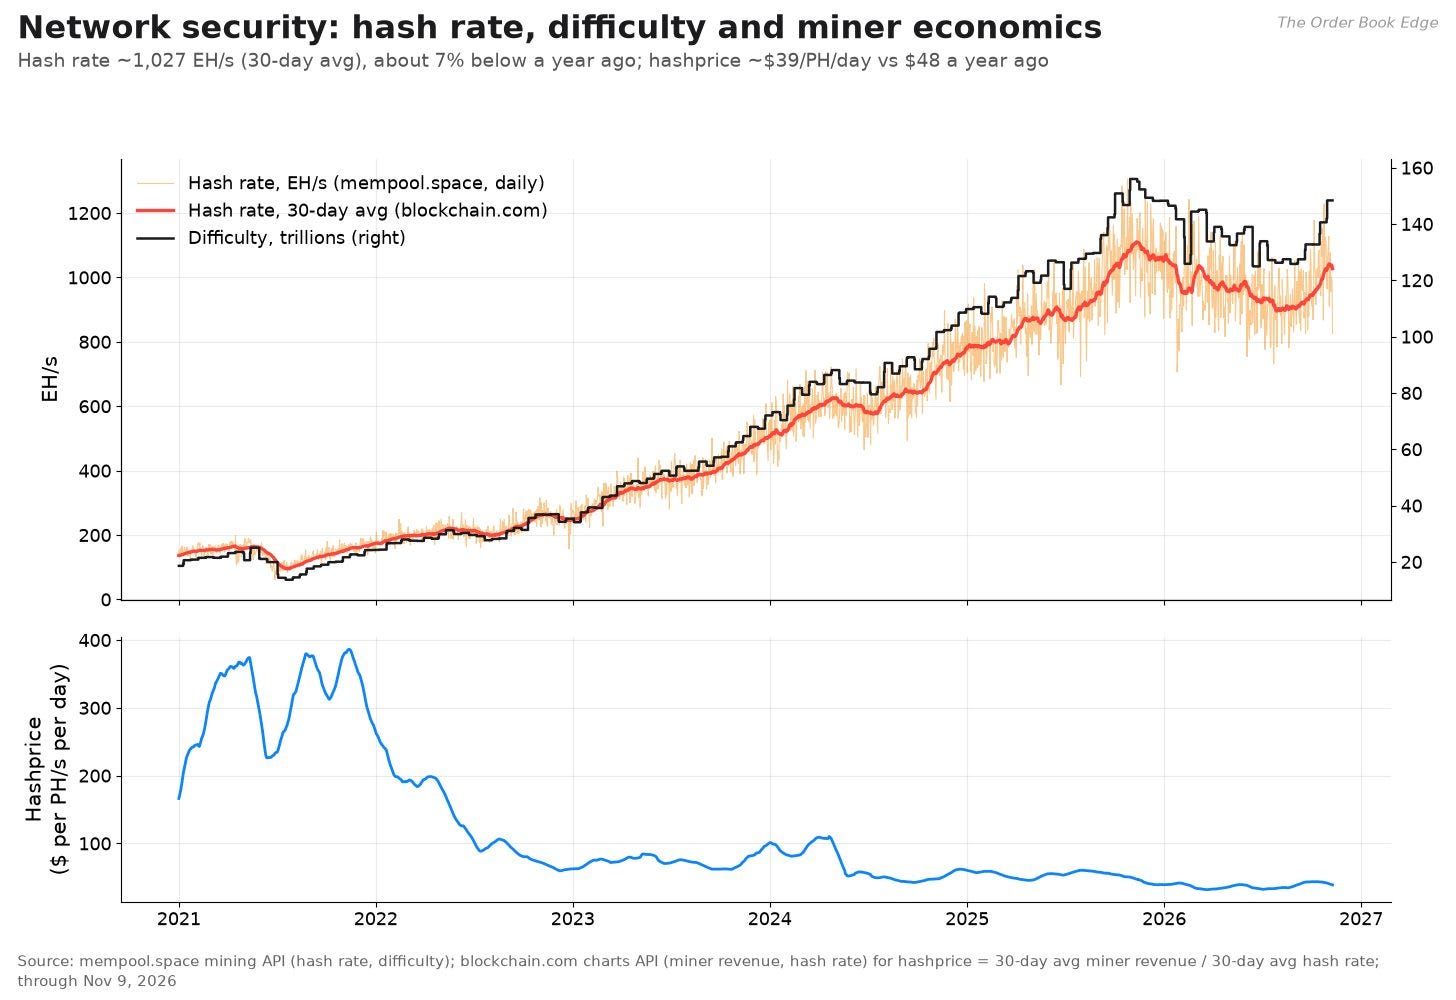
The hash rate measures the total computing power securing the network. Difficulty, which adjusts every 2,016 blocks to keep blocks coming roughly every ten minutes, follows it. The hash rate averaged about 1,027 exahashes per second (EH/s) over the past 30 days according to blockchain.com, about 7% below the 30-day average a year ago. Daily estimates from mempool.space are noisy. They have swung between about 825 and 1,000 EH/s over the past week, below a peak of about 1,306 EH/s in late October 2025. Difficulty stands at 148.4 trillion after rising 5.5% at the last adjustment in late October. mempool.space estimates that the next adjustment, due later this week, will be about −6.8%.
The falling hash rate reflects miner economics. Hashprice, the dollar revenue a unit of computing power earns per day, fell from about $48 per petahash per day a year ago to about $39 today (30-day averages, my calculation from blockchain.com’s miner revenue and hash rate). Total miner revenue averaged about $40 million a day over the past 30 days. Transaction fees made up only 0.56% of it. That number is a quiet long-term concern. As the subsidy shrinks toward zero, the network’s security budget will eventually have to come from fees, and fee revenue today is tiny.
Squeezed miners sell more of their coins. CoinDesk reported today that MARA Holdings, one of the largest listed miners, sold 13,597 BTC, worth about $1.1 billion, over six weeks. I have not independently verified those figures. Many large miners are also moving their computing capacity toward AI data centers, which pay more reliably than mining at current hashprice. In the short run that means supply from treasury sales. In the long run, a modest decline in hash rate is not a security problem. At about 1,000 EH/s, the network still has roughly 65% more computing power than it did around the 2024 halving, when the 30-day average was about 620 EH/s.
Spot ETFs: the demand engine has stalled
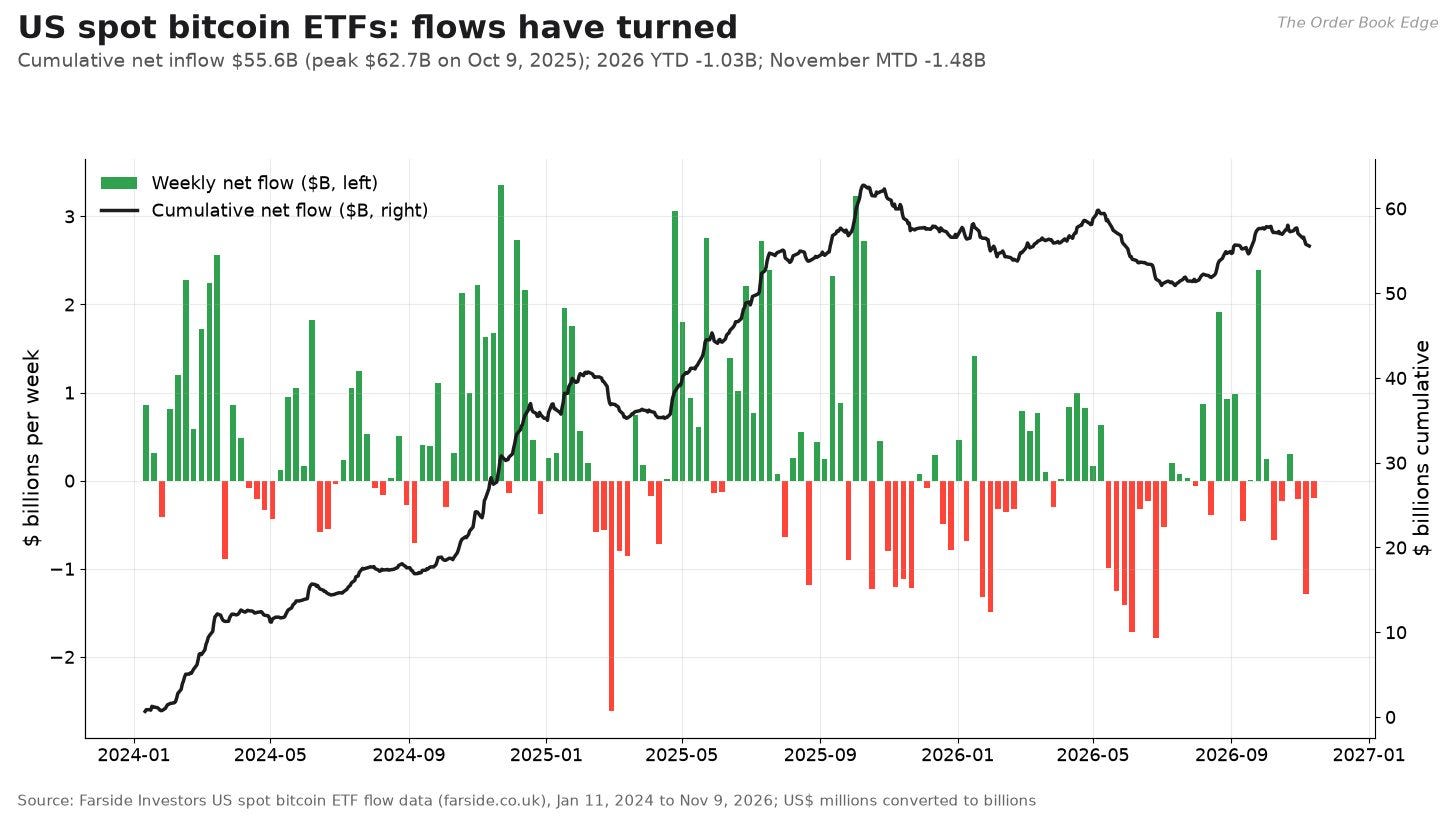
The launch of U.S. spot bitcoin ETFs in January 2024 created the largest new source of demand in bitcoin’s history. According to Farside Investors’ daily flow data, the funds took in $35.2 billion net in 2024 and $21.3 billion in 2025. BlackRock’s iShares Bitcoin Trust (IBIT) accounted for $64.9 billion of inflows. Grayscale’s GBTC, which converted from a closed-end trust with a high fee, lost $28.1 billion. Cumulative net inflows peaked at $62.7 billion on October 9, 2025, three days after bitcoin’s record close.
In 2026 that engine went into reverse. Net flows for the year to date are −$1.03 billion. November 2025 lost $3.47 billion, and January 2026 another $1.60 billion. After a recovery in March and April, May lost $2.41 billion and June lost $4.51 billion, the worst month on record and the month of the price low. Flows were positive again in August (+$3.54 billion) and September (+$2.65 billion) as bitcoin rallied, then turned negative in October (−$0.52 billion). November to date is −$1.48 billion, including −$1.08 billion over the last five sessions. IBIT has had seven straight days of outflows.
Two points stand out. First, flows follow price at least as much as they lead it. Flows were strongest in the months bitcoin rallied and weakest in the months it fell, which is consistent with ETF investors chasing momentum. Second, the investor base has not left. Cumulative inflows are still $55.6 billion, about 89% of the peak. About $24 billion of the inflows came between January and October 2024, when bitcoin mostly traded between $40,000 and $70,000. Holders as a group are not under the kind of pressure that forced the selling of 2022. CoinDesk noted, citing SoSoValue, that last week’s outflow was the largest since June.
A data limitation: I could not find a free, verifiable daily source for ETF holdings in BTC. Flows in dollars are reported by the issuers and collected by Farside. Converting them to coins requires each fund’s daily share count and NAV per share, which I did not verify. I use dollar flows only.
Liquidity and rates
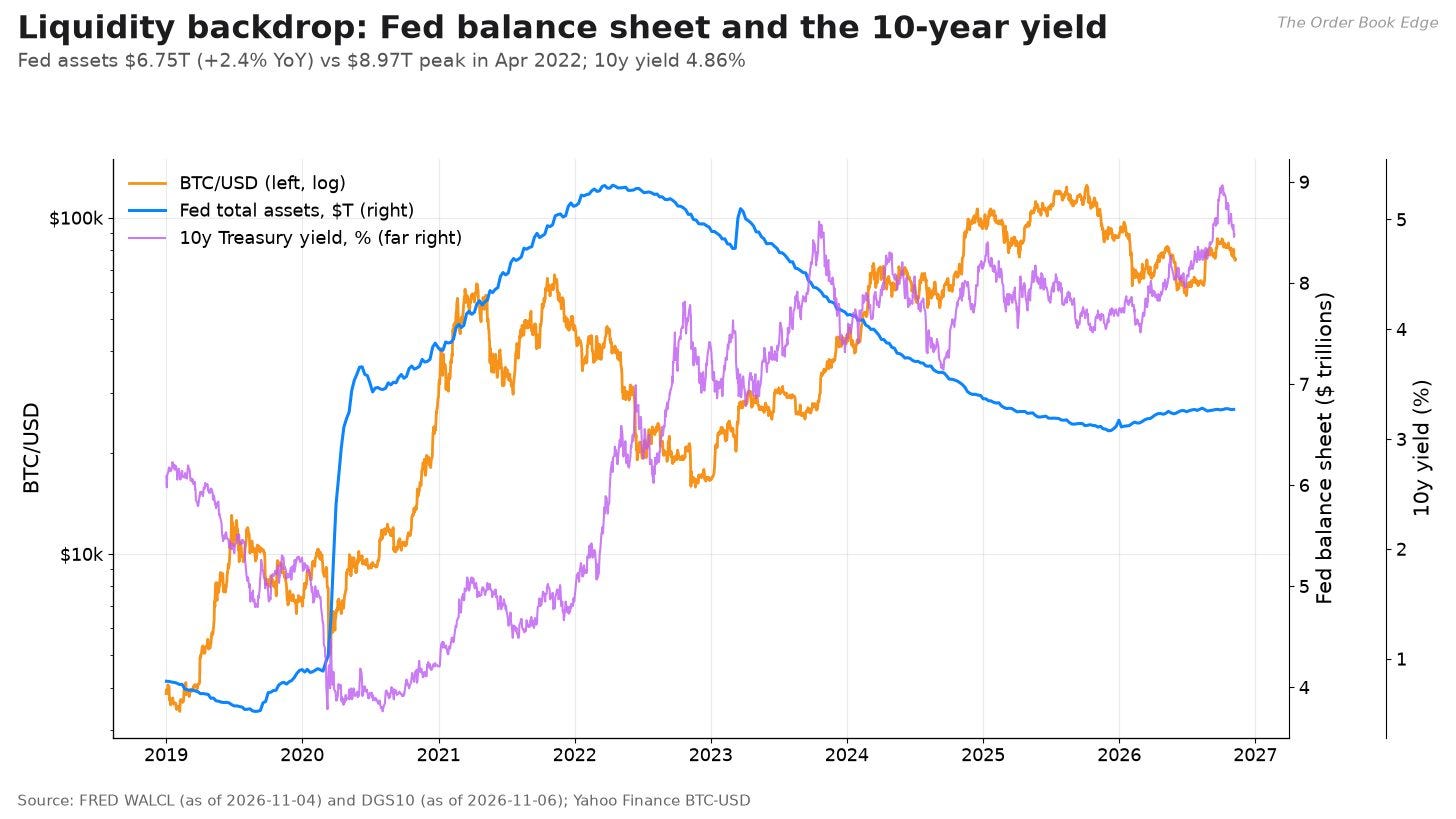
Bitcoin is often described as a liquidity asset, one that rises when central banks are expanding their balance sheets and money is cheap. The data offer partial support at best. Over the past five years, the correlation between 13-week changes in bitcoin and 13-week changes in the Fed’s total assets (WALCL) is −0.34. That is the wrong sign for the simple liquidity story. Most of the effect comes from 2023 to 2025, when the Fed shrank its balance sheet by about $2 trillion from the April 2022 peak of $8.97 trillion and bitcoin still rose more than fivefold. Correlations with 13-week changes in the 10-year yield (−0.11) and the dollar index (−0.16) have the expected sign but are weak.
What has mattered more this year is the direction of rate expectations. The 10-year Treasury yield is 4.86% (November 6) and the 3-month bill yields 4.19%. The Fed’s balance sheet is $6.75 trillion, up 2.4% over the past year. Bitcoin’s worst stretches of 2026 came when inflation surprised on the upside and markets priced in rate hikes, as in June and again today. A higher risk-free rate raises the opportunity cost of holding an asset that pays nothing, and it raises the cost of the leverage that so much bitcoin trading relies on. FXStreet reported that futures markets priced about an 80% chance of a December hike before today’s CPI release. I have not verified that figure against CME FedWatch.
A fundamental scorecard
Pulling the fundamental evidence together:
Supply: neutral to positive. Issuance is small, falling and fully predictable. It is not the reason prices fell, and it will not be the reason they rise in the near term.
Network security: positive. The hash rate is near record levels even after a 7% drop. Difficulty adjustments are doing their job.
Miner economics: negative. Hashprice is near the low end of its history, fees are negligible, and miners are selling coins and turning to AI hosting. Miner selling is a modest but steady source of supply.
ETF demand: negative in the short run, positive in the long run. Flows have turned negative this year and are following the price lower. But the investor base remains large, and its cumulative inflows are still close to the peak.
Macro: negative. Rising inflation and a Fed that is debating hikes are the clearest headwind. Bitcoin has not behaved like an inflation hedge this year. It has behaved like a long-duration risk asset.
Valuation models: not informative. S2F has failed, and there is no cash-flow model to fall back on. That leaves price, flows and positioning as the main evidence, which is why the derivatives markets get so much weight in this article.
The futures view: basis, carry, funding and leverage
Bitcoin trades in three kinds of futures. CME futures are regulated, cash-settled, monthly contracts used mostly by institutions. Dated futures on crypto exchanges such as Deribit and OKX expire on fixed dates and settle in coin or stablecoin. Perpetual swaps, or perps, are the largest market by volume. They never expire and are kept near the spot price by periodic funding payments between longs and shorts. Together, these markets tell you what traders pay for leverage and how crowded the long side is.
A note on CME data. CME’s website blocks automated requests, and its terms of use prohibit scraping. I did not try to get around this. As a rough cross-check, Yahoo Finance’s continuous front-month CME series (BTC=F) has averaged a premium of about 0.4% over spot during the past 30 days. Those prices are not time-matched to spot, so I do not rely on them. The term structure below uses Deribit’s dated futures, which are publicly available and update in real time.
Basis and the cash-and-carry trade
The basis is the futures price’s premium over spot. Annualizing it gives the implied carry, the return a trader locks in by buying spot and selling the future:

F_T is the futures price for expiry T (in years), S₀ is the spot index, B_T is the raw basis, c_T is the annualized continuously compounded carry, r_f is the risk-free rate, k is the round-trip cost of fees and slippage, and Π_(carry) is the excess profit, per dollar, of buying spot, shorting the future and holding to expiry instead of holding T-bills. In theory, the no-arbitrage futures price is F_T = S₀ e^((r_f+u)T), where u is any net cost of holding the asset. Bitcoin has no storage cost, so a basis above the risk-free rate is a premium that leveraged longs pay to arbitrageurs.
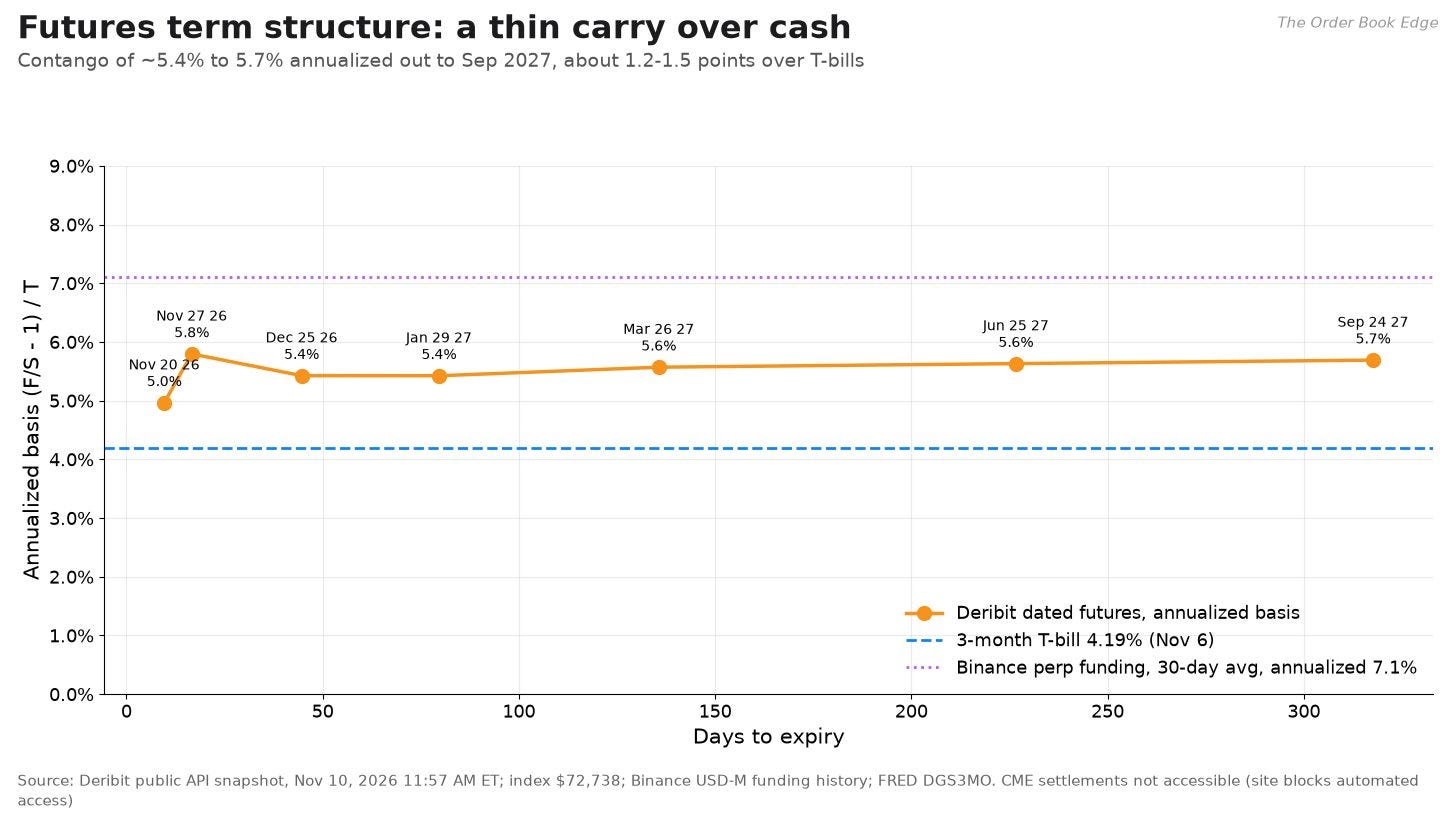
At the snapshot, with the index at $72,739, Deribit’s December 25 future traded at $73,221, an annualized carry of 5.4%. The March 26 contract traded at $74,244 (5.6%), June 25 at $75,281 (5.6%) and the September 24, 2027 contract at $76,340 (5.7%). The curve is in contango, meaning longer-dated futures cost more, but it is nearly flat in annualized terms. With T-bills at 4.19%, the excess carry is only about 1.2 to 1.5 percentage points a year, before costs. For a fund running the cash-and-carry trade, such as a long ETF and short CME future position, that is thin. In late 2024, when the market was more euphoric, annualized basis on CME and offshore venues was widely reported above 10%. Binance funding averaged 11.9% that year, which is consistent with that.
Thin carry is a double-edged signal. It means there is no great crowd of leveraged longs bidding up futures, which reduces the risk of a forced liquidation cascade. It also means there is little speculative demand. Some of this year’s ETF outflows likely reflect basis funds unwinding as the trade’s return fell toward the T-bill rate, though I have not seen data that isolates this.
Perpetual funding
Perpetual swaps use a funding rate to stay near spot. Every eight hours on most exchanges, longs pay shorts when the perp trades above spot and shorts pay longs when it trades below:

fₜ is the eight-hour funding rate, p̄ₜ is the time-weighted average premium of the perp over the spot index, I is an interest-rate component (0.01% per eight hours on Binance), clamp(x, a, b) limits x to the range [a, b], Nₜ is the position’s notional value, and f^(ann) is the simple annualized rate from an average f̄. This is Binance’s formula. Other exchanges use variations of it. When the premium is small, funding settles at the 0.01% default, which annualizes to about 10.95%.
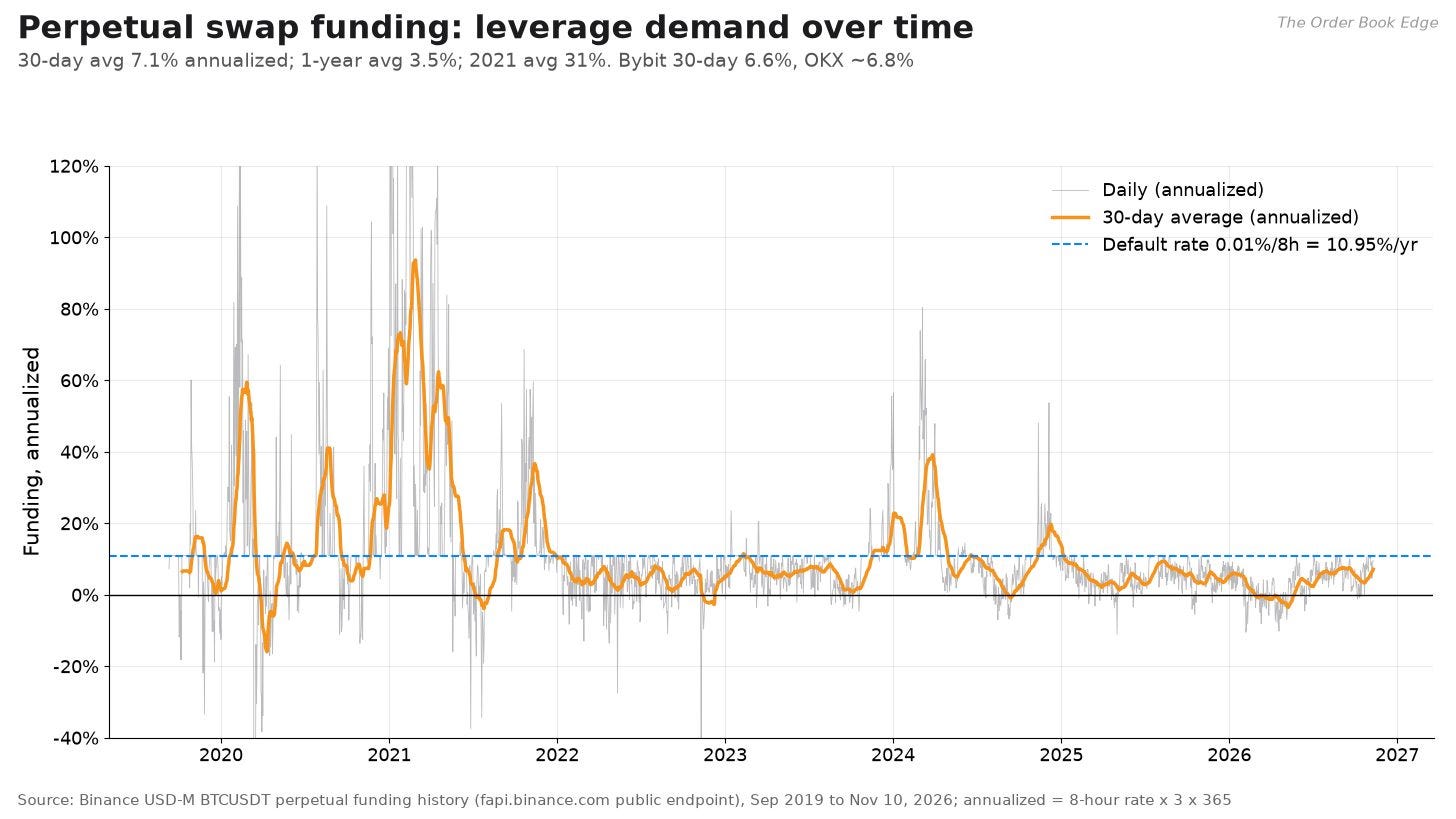
Binance’s BTCUSDT funding rate was 0.0059% per eight hours at the latest print. Annualized averages are 8.2% over 7 days, 7.1% over 30 days, 6.2% over 90 days and only 3.5% over the past year. Funding was negative 23% of the time over the past year, meaning shorts paid longs. By year, funding averaged 30.6% annualized in 2021, 11.9% in 2024 and 5.1% in 2025. The 30-day average at Bybit is 6.6%. At OKX, where only about 33 days of data are available, it is about 6.8%.
Funding below the 10.95% default means the perp has been trading at a small discount to its fair premium. Leveraged traders are not paying up to be long. In past cycles, sustained funding above 30% to 50% annualized came before major tops and long liquidation cascades. Today’s readings are far from that.
Open interest
Open interest, the number of contracts outstanding, measures how much leverage is in the system. Binance’s BTCUSDT perp has about 100,800 BTC of open interest (about $7.4 billion at the snapshot). Bybit’s BTCUSDT perp has about 70,300 BTC ($5.1 billion) and OKX’s BTC-USDT swap about 36,600 BTC ($2.7 billion). Deribit’s BTC futures and perp add about $1.2 billion. Binance’s daily open interest rose from about 92,400 BTC on October 12 to about 98,600 BTC on November 10, a 6.7% increase in coin terms while the price fell. Rising open interest during a price decline usually means new short positions are being opened. That creates fuel for a short squeeze if the price turns up, but it also confirms that traders are positioning for further weakness.
The weekend liquidation event is a reminder of how these markets work. CoinDesk, citing CoinGlass, reported more than $1 billion of crypto positions liquidated in 24 hours, $913 million of them longs. I have not verified CoinGlass’s numbers, which aggregate exchange data that is not all public. The record remains the October 10, 2025 flash crash, when, as CNN reported, about $19 billion of leveraged positions were wiped out in a day. Many analysts date the start of the current bear market to that event.
The options view: what the market is paying for
Deribit is the largest bitcoin options exchange, and its full chain is public. At the snapshot, total open interest was about 341,000 BTC, or about $24.8 billion of notional value. The put-to-call ratio of open interest was 0.73. That means there are more calls outstanding than puts, a common pattern because many investors sell calls against their bitcoin. The 24-hour put-to-call ratio of trading volume, in dollars, was 4.17. On the morning of a hot CPI report, traders bought protection.
Pricing: Black-76
Deribit options are European-style and settle against the expiry-time index. I price them with Black’s 1976 model, which prices options on a forward or futures price:

C and P are call and put prices, F is the forward price for the expiry, K is the strike, T is the time to expiry in years, σ is the implied volatility, r is the discount rate, and N(·) is the standard normal cumulative distribution function. Deribit options are paid for and settled in BTC, which means the premium is effectively discounted in coin terms rather than in dollars. I set r = 0 and use each expiry’s Deribit forward. Checked across all 878 listed options, that reproduces Deribit’s own mark prices with a median error of about $3 and a 95th-percentile error of about $17.
The Greeks measure how an option’s price changes with its inputs:
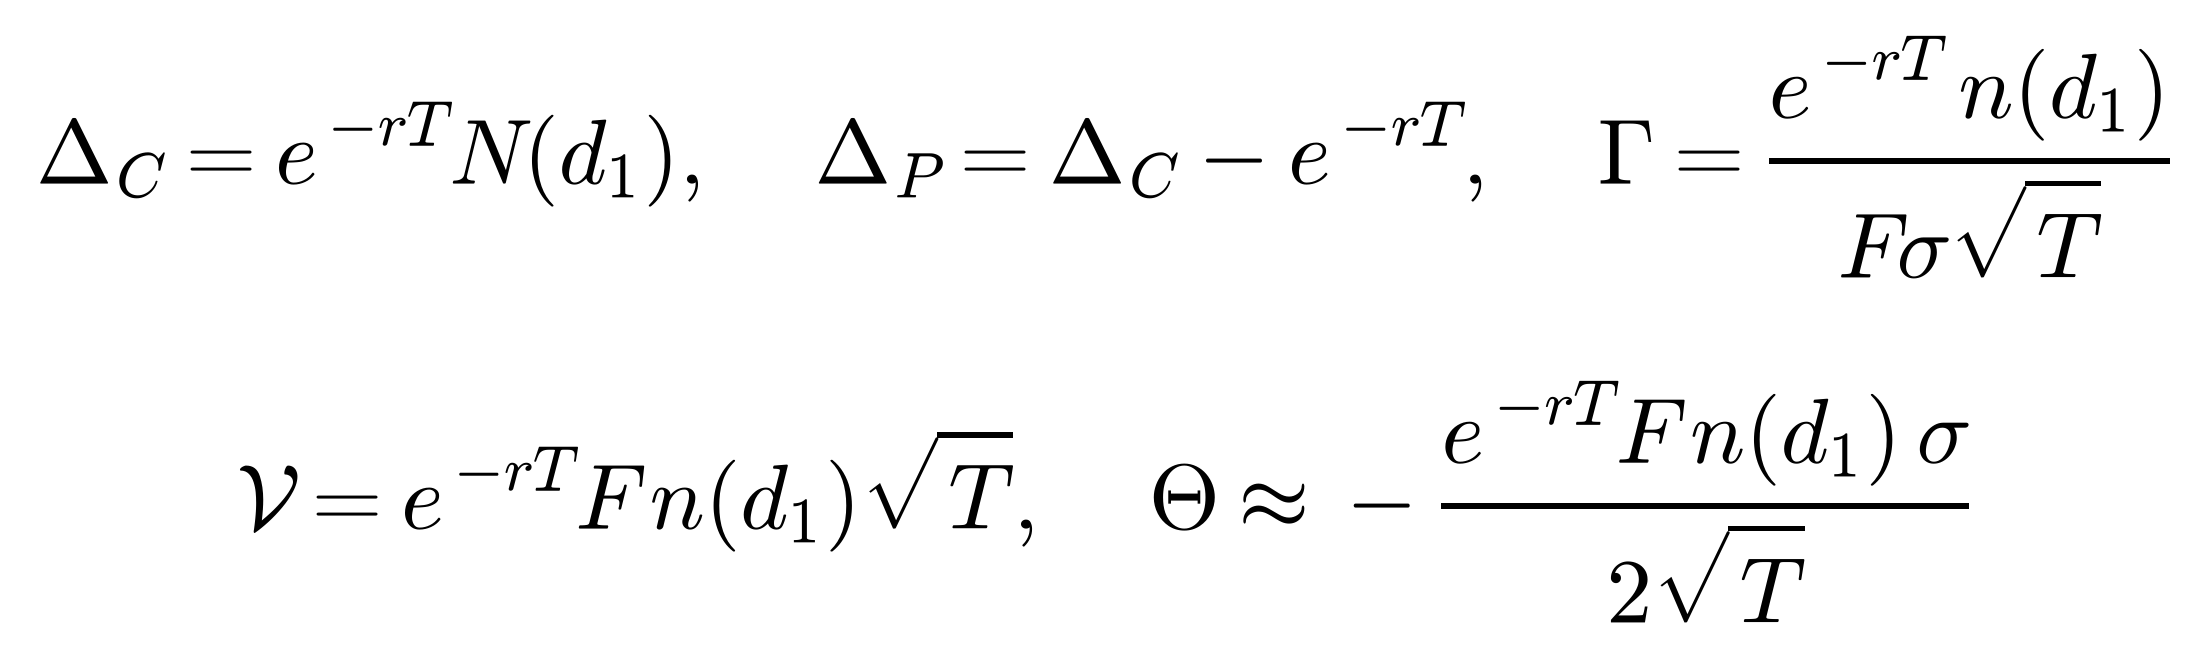
Δ (delta) is the change in option value per $1 change in the forward, Γ (gamma) is the change in delta per $1 change, 𝒱 (vega) is the change in value per unit change in volatility (divide by 100 for one volatility point), Θ (theta) is the change per year of time (divide by 365 for one day), and n(·) is the standard normal density. The theta formula is exact when r = 0.
For a worked example, take the December 25 $73,000 strike, with the forward at $73,223, 44.6 days to expiry and a fitted implied volatility of 38.6%. The call costs about $4,049 and the put about $3,826. The call’s delta is 0.54 and the put’s is −0.46. Gamma is 0.000040 per dollar, so a $1,000 move shifts delta by about 0.04. Vega is about $102 per volatility point, and theta is about −$44 a day. A holder of this straddle loses about $88 a day if nothing happens, and needs bitcoin to move enough to make up for it.
The implied move
The straddle, an at-the-money call plus an at-the-money put, gives a model-free estimate of the expected absolute move to an expiry:
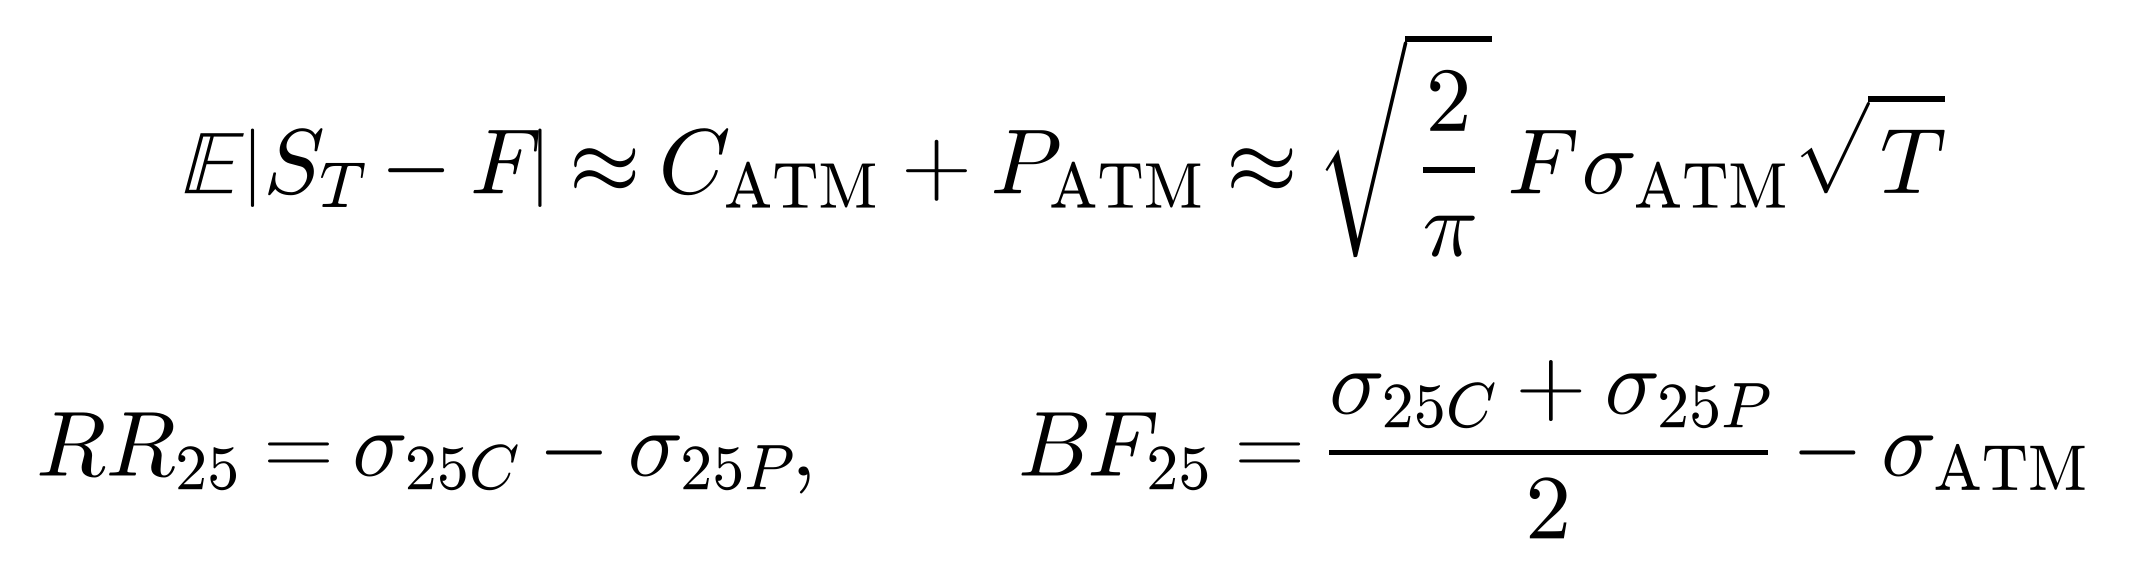
S_T is the price at expiry, C_(ATM) and P_(ATM) are the at-the-money call and put prices, σ_(ATM) is the at-the-money implied volatility, √(2/π) ≈ 0.80 converts a standard deviation into an expected absolute move under a normal distribution, σ_(25C) and σ_(25P) are the implied volatilities of the 25-delta call and put, RR₂₅ is the 25-delta risk reversal (a measure of skew), and BF₂₅ is the 25-delta butterfly (a measure of how much extra the market pays for both tails).
Straddle-implied moves at the snapshot:
November 13 (Friday weekly, $2.4 billion of open interest): about 2.8%, or about ±$2,050.
November 27 (monthly, $5.6 billion): about 6.4%, or ±$4,670.
December 25 (quarterly, $10.3 billion, the largest expiry): about 10.7%, or ±$7,800. This expiry comes after the December 9 Fed meeting.
March 26, 2027 (quarterly, $3.4 billion): about 18.8%, or ±$13,970.
September 24, 2027: about 28.5%, or ±$21,750.
Term structure, skew and smiles
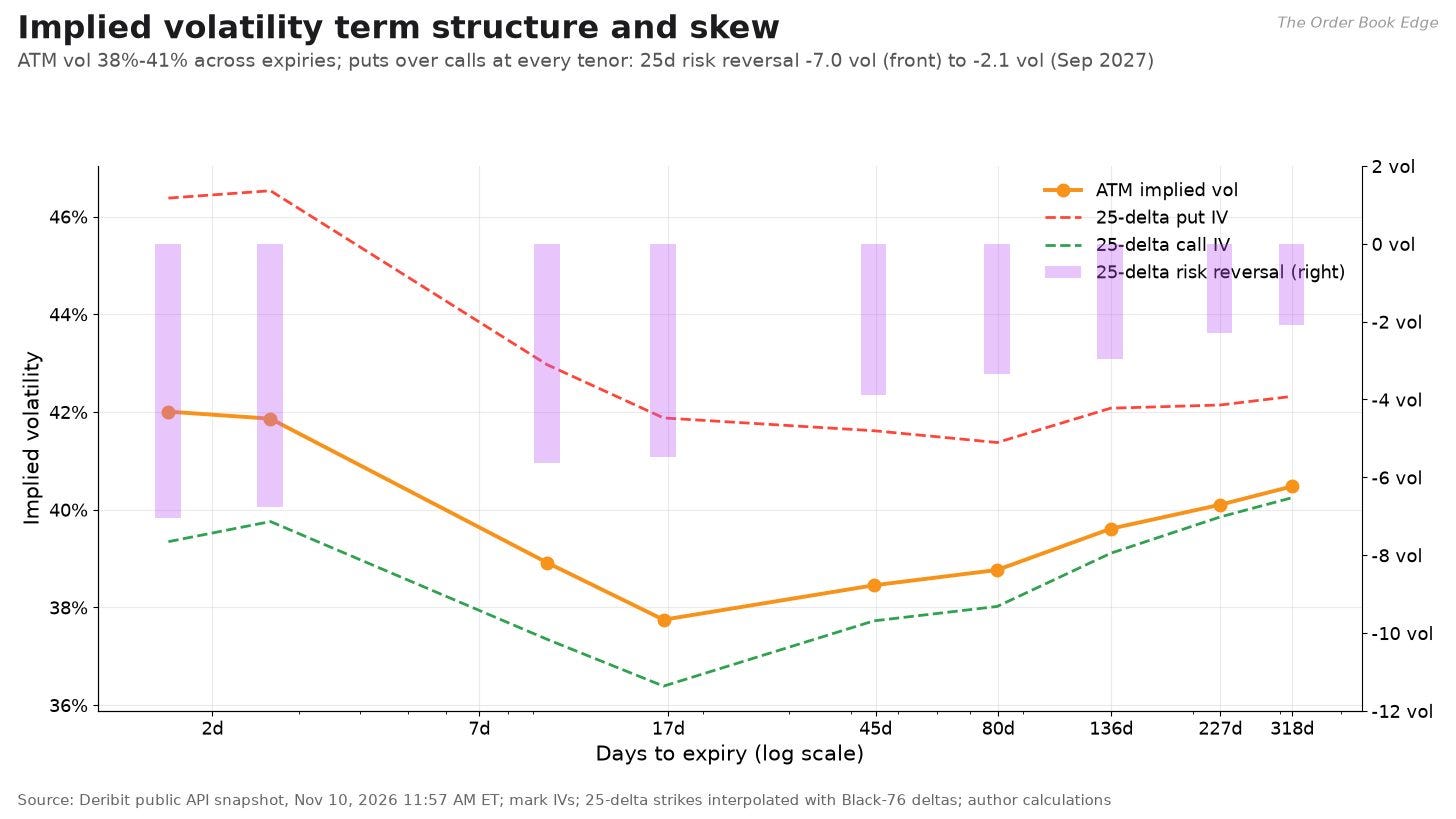
At-the-money implied volatility runs from about 42% for this week’s expiries to 37.8% for November 27, then rises to 38.5% for December, 39.6% for March and 40.5% for September 2027. The short end is elevated because of the CPI release and the weekend’s volatility. The curve beyond a month is gently upward-sloping, which is the normal shape in calm markets.
Skew is the more telling signal. The 25-delta risk reversal is negative at every expiry: about −7 volatility points for this week’s options, −5.5 for November 27, −3.9 for December, −3.0 for March and −2.1 for September 2027. A negative risk reversal means out-of-the-money puts cost more than equivalent calls. Traders are paying more for crash protection than for upside exposure. In bitcoin’s 2020–2021 and late-2024 bull runs, risk reversals were often positive, with calls at a premium. The 25-delta butterfly is a modest +0.8 to +1.4 points, meaning the market is paying some extra for both tails but not a lot.
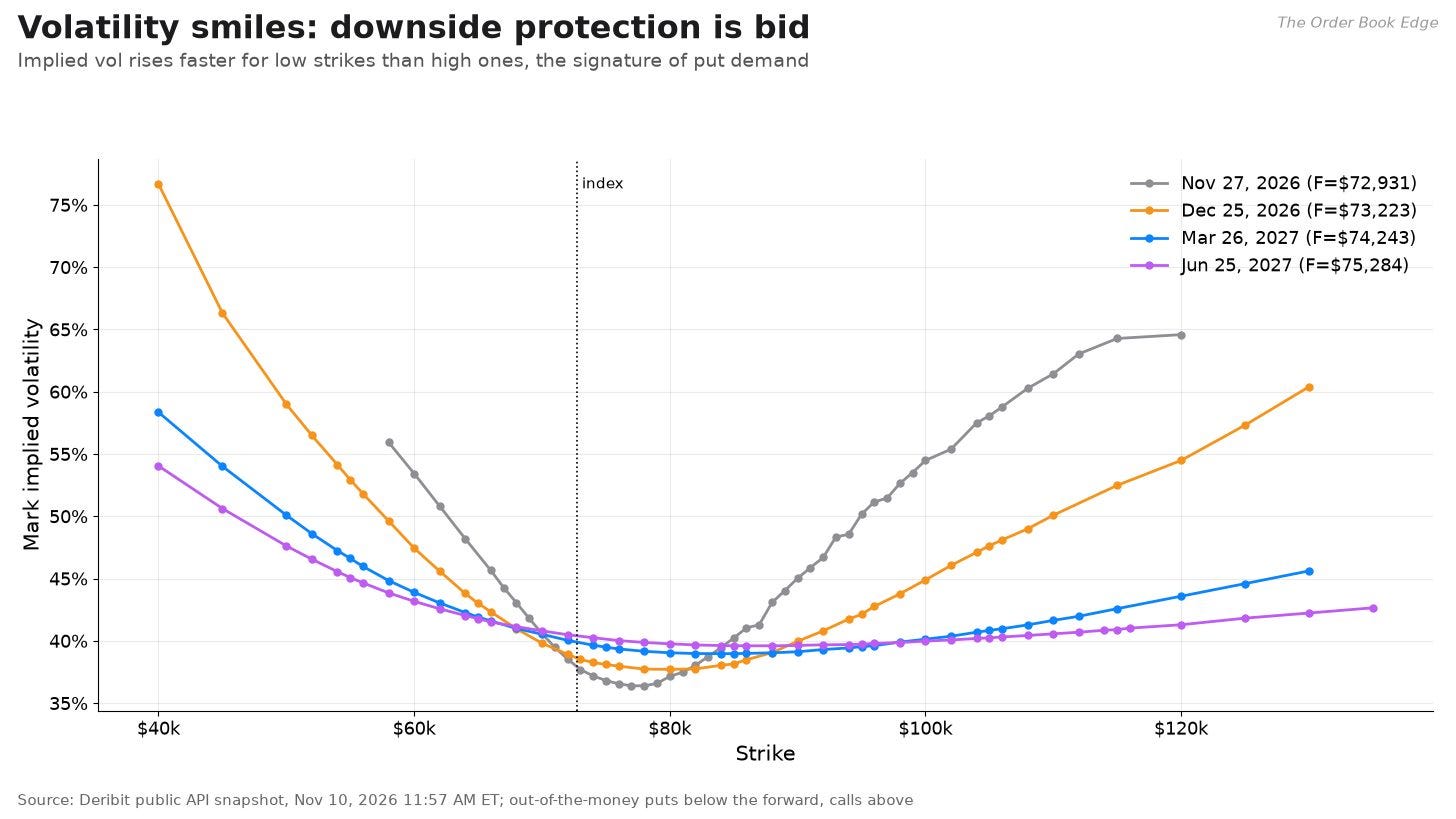
The smiles show the same thing strike by strike. For the December 25 expiry, implied volatility is about 38.5% near the money. It rises to 47.4% at the $60,000 strike, about 18% below the forward, and 59% at $50,000. On the call side, the $88,000 strike, about 20% above the forward, trades at only 39.0%, and the $100,000 strike at 44.9%. For the November 27 expiry, the same comparison is 53.4% at $60,000 against 43.1% at $88,000. Longer expiries have flatter smiles, but every one is tilted toward the downside.
Open interest by strike and max pain
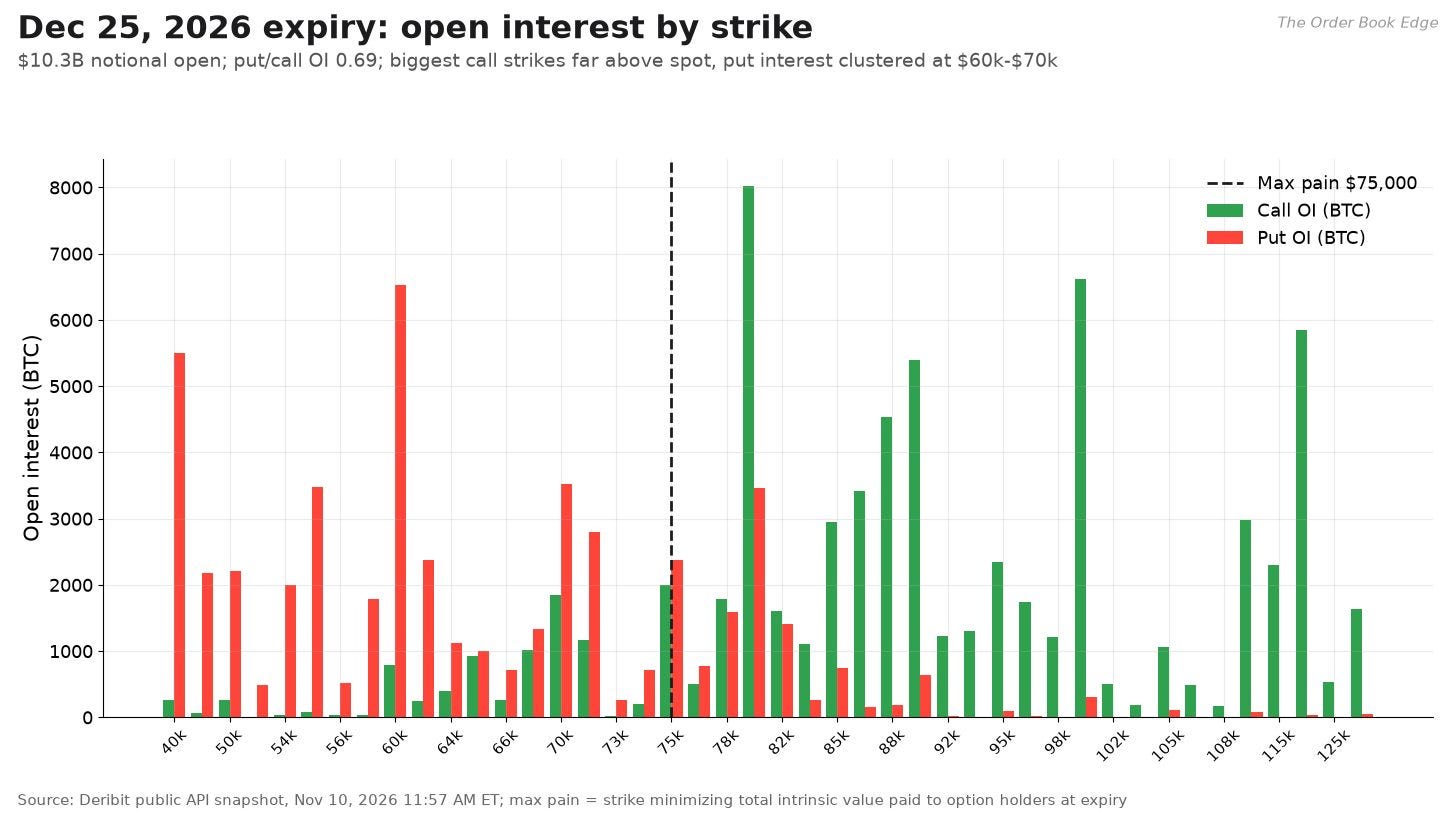
“Max pain” is the expiry price at which option holders, in total, would receive the least:

K* is the max-pain price, Kᵢ are the listed strikes, OI^Cᵢ and OI^Pᵢ are open interest in calls and puts at strike Kᵢ, and the sum is the total intrinsic value paid to option holders if the expiry price is K.
For the December 25 expiry, max pain is $75,000. Open interest is spread widely, with large call positions at $80,000, $100,000 and $120,000 and large put positions at $50,000, $60,000 and $70,000. Max pain for the November 27 expiry is $79,000, for March $76,000 and for September 2027 $84,000. There is a popular idea that prices drift toward max pain into expiry, because option sellers hedge in ways that pin the price. The evidence for this in bitcoin is mixed at best. I treat max pain as a description of where open interest is concentrated, not as a forecast.
The risk-neutral distribution
Option prices across strikes contain a full probability distribution for the price at expiry. Breeden and Litzenberger (1978) showed that the second derivative of the call price with respect to the strike gives the risk-neutral density:
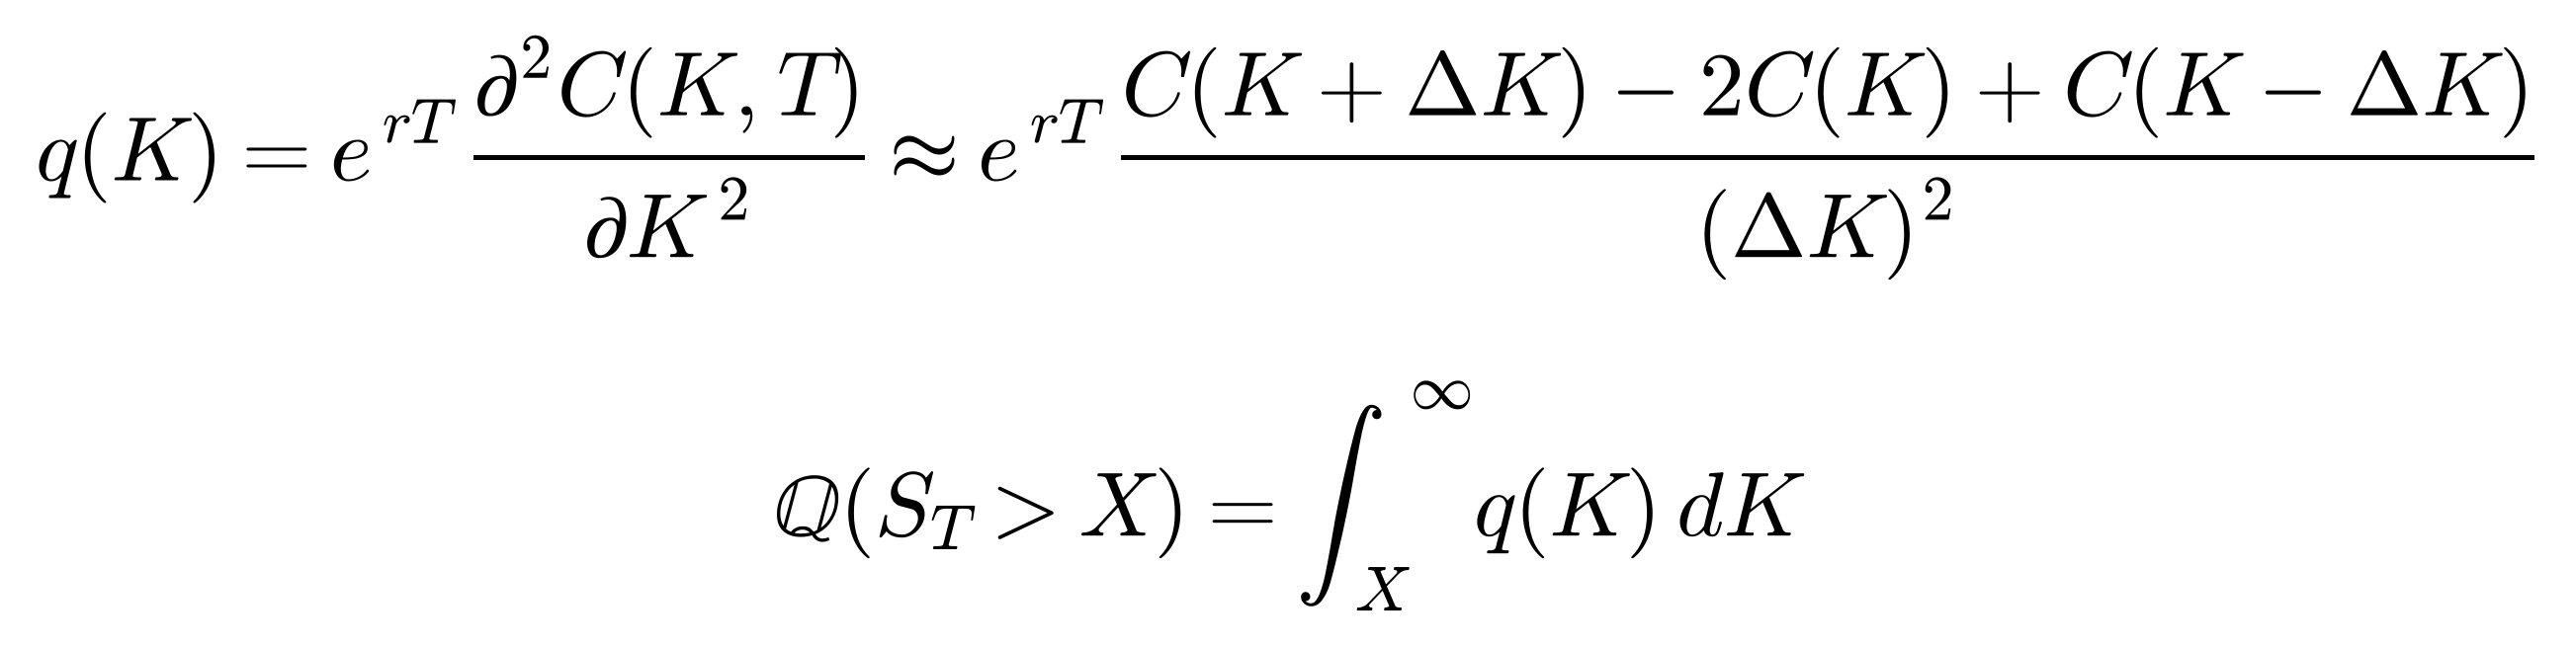
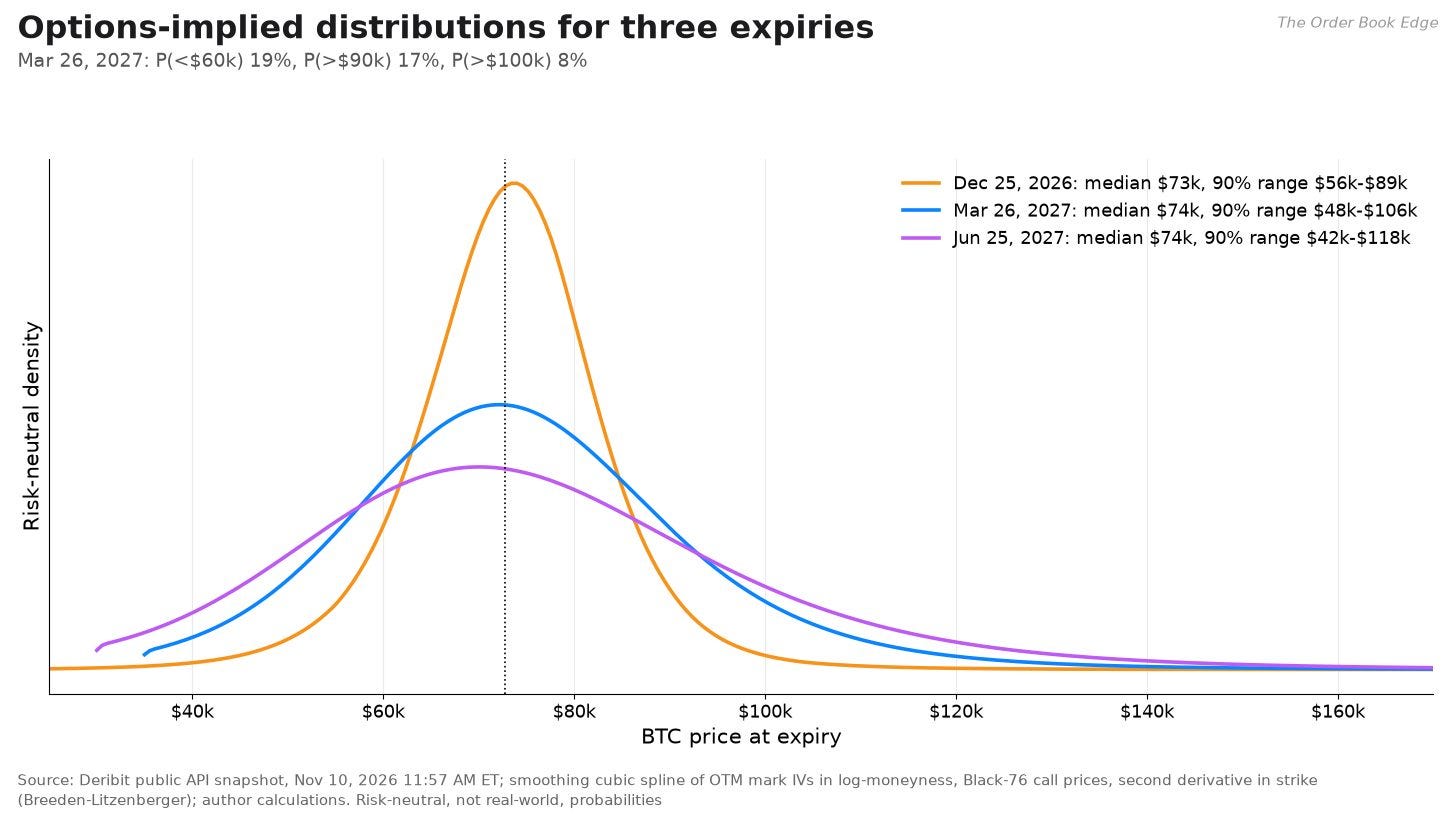
q(K) is the risk-neutral probability density at price K, C(K,T) is the call price as a function of strike and expiry, Δ K is a small strike step, and Q(S_T > X) is the risk-neutral probability that the price at expiry is above some level X. In practice, raw option prices are noisy, so I fit a smooth curve of implied volatility in log-moneyness for each expiry (a smoothing cubic spline through out-of-the-money mark volatilities, held flat beyond the last listed strike), convert it to call prices with Black-76 on a fine strike grid, take the numerical second derivative, apply light smoothing, set any negative values to zero and normalize the result to integrate to one.
The results:
December 25, 2026: median about $73,300. 90% range about $56,400 to $89,400. Probability below $60,000: 9%. Below $65,000: 19%. Above $80,000: 23%. Above $90,000: 5%. Above $100,000: about 1%.
March 26, 2027: median about $73,600. 90% range about $48,000 to $105,800. Below $50,000: 7%. Below $60,000: 19%. Above $80,000: 35%. Above $90,000: 17%. Above $100,000: 8%. Above the $126,198 record: about 1%.
June 25, 2027: median about $73,500. 90% range about $42,400 to $118,200. Below $60,000: 25%. Above $100,000: 14%.
September 24, 2027: median about $74,200. 90% range about $42,600 to $129,100. Above $100,000: 18%. Above the record: about 6%.
Two caveats. First, these are risk-neutral probabilities. They are the probabilities implied by option prices, which include the premium investors pay for insurance. Real-world probabilities of a crash are probably lower than the risk-neutral ones, and real-world probabilities of a rally possibly higher, because investors overpay for puts. Second, the tails depend on how the smile is extrapolated beyond the most distant listed strikes, so the probabilities beyond the 5th and 95th percentiles are less reliable.
Four option structures, priced off the live chain
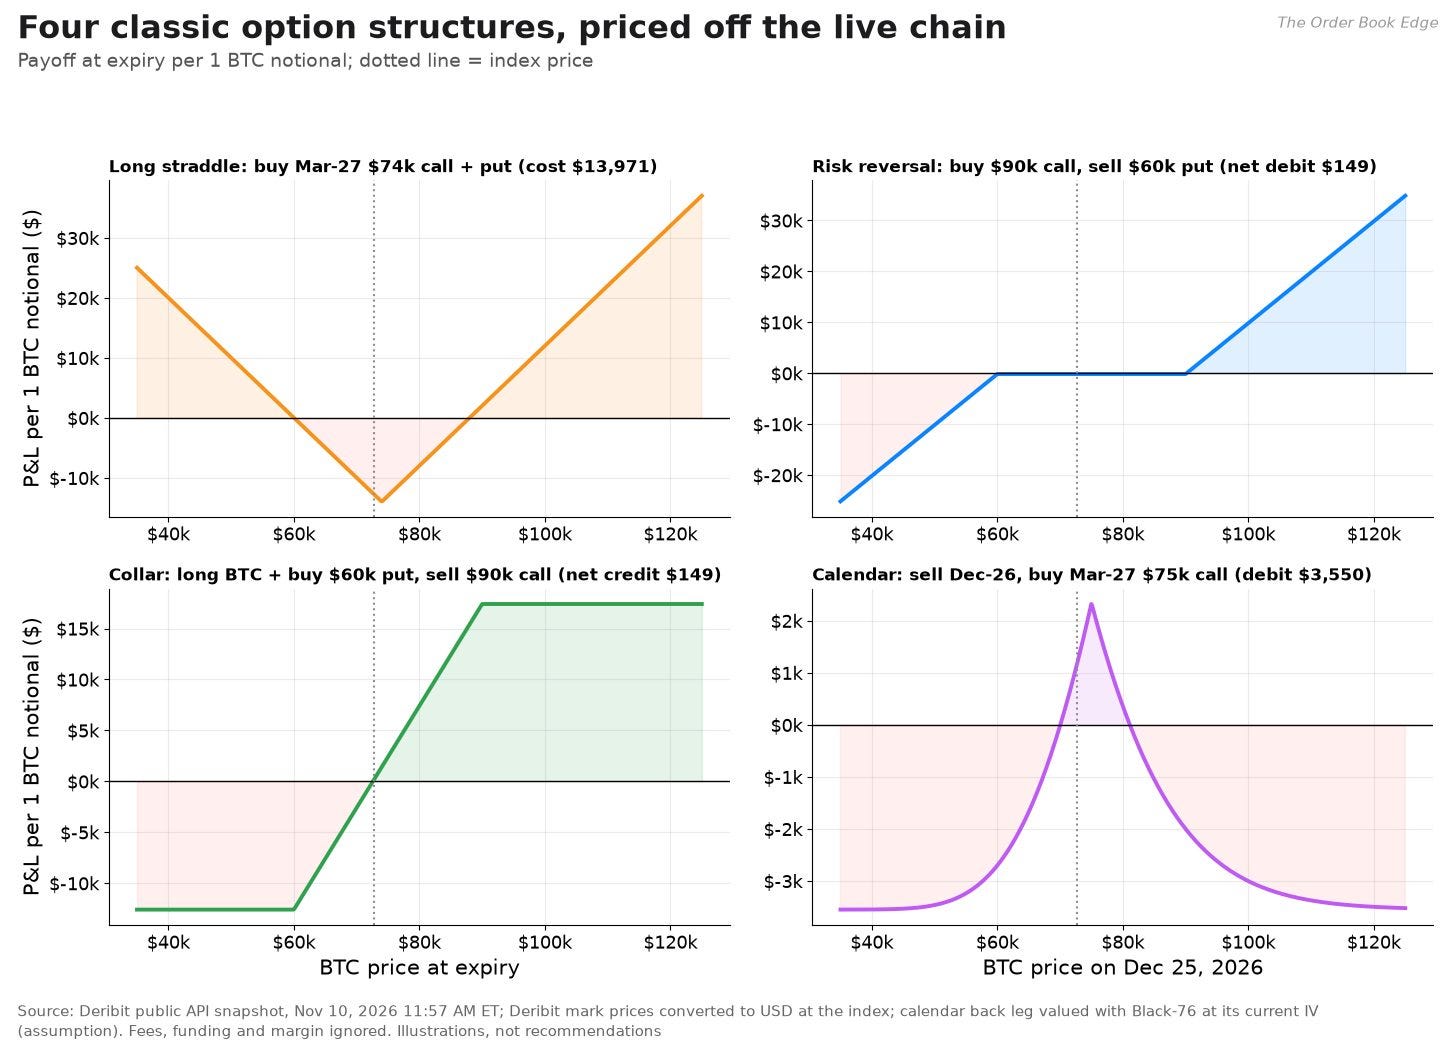
To show how traders can express a view, here are four standard structures, priced at Deribit marks from the snapshot. These are illustrations of mechanics, not recommendations. They ignore fees, slippage and the margin that some of them require.
Long straddle (March 26, $74,000 strike): buy the call ($7,102) and the put ($6,869) for a total of $13,971 per BTC. It profits if bitcoin is below about $60,000 or above about $88,000 at expiry, a move of about 19% either way. It is a bet on volatility rather than direction, and it loses money every day the price stays still.
Risk reversal (March 26): buy the $90,000 call ($2,256) and sell the $60,000 put ($2,107), for a net cost of about $149. Thanks to negative skew, a trader can get almost free upside above $90,000 in exchange for the obligation to buy at $60,000. This is the cheapest way to express a bullish view, and the one with the most downside if the bear case plays out.
Collar (long BTC, March 26): own bitcoin, buy the $60,000 put and sell the $90,000 call. The skew that makes the risk reversal cheap makes this collar pay a net credit of about $149. Relative to the spot index at the snapshot, the holder’s outcome is locked between about −18% and +24%. This is the classic structure for a long-term holder who wants to sleep through a bear market.
Call calendar ($75,000 strike): sell the December 25 call ($3,088) and buy the March 26 call ($6,637), for a debit of about $3,550. It makes the most money if bitcoin sits near $75,000 on December 25, when the short call expires worthless and the long call keeps its time value. The chart shows the value at the December expiry, assuming the March option’s implied volatility is unchanged.
Putting the derivatives signals together
Read one at a time, each derivatives measure has a mild message. Read together, they describe a market that is cautious but not panicked.
Futures carry, at 5.4% to 5.7% annualized, is barely above the risk-free rate. Leveraged longs are not paying up.
Perpetual funding, at 7% annualized over 30 days, is below the 10.95% default level, and it was negative almost a quarter of the time over the past year.
Open interest is rising while the price falls. New positions are being added on the way down, which points to shorts building.
Implied volatility, at about 40, sits near realized volatility and around the middle of its one-year range. There is no sign of panic buying of options, except at the very front of the curve.
Skew is negative at every expiry. Puts cost 2 to 8 volatility points more than calls, with the most expensive protection in the shortest-dated options.
Max pain sits at $75,000 to $79,000 for the large expiries of the next two months, slightly above the current price.
The combination matters. Markets usually top when funding and basis are high, skew is positive and implied volatility is low. The last of those, at least, described the weeks before the October 2025 record, when 90-day realized volatility fell to its lowest level in a decade. Markets usually bottom when funding turns deeply negative, skew is very negative and implied volatility jumps, as in June 2026 and the February spike in DVOL to 82.6. Today’s mix sits between those extremes, closer to the bearish side. That fits a market that has already corrected a long way but has not yet seen the kind of forced capitulation that has often marked a final low. It also means that, if the bear case plays out, implied volatility has room to rise, which would make protection bought now more valuable.
For a holder, the practical implication is that downside protection is not cheap, because skew is steep, but overall volatility is not expensive. Structures that sell the expensive downside to finance upside, such as the risk reversal, or that give up some upside to fund protection, such as the collar, are where the pricing of this market is most favorable. Straddles, which buy both sides at roughly fair volatility, need a large move to pay off.
The technical view: trend, momentum and levels
Technical analysis works better for bitcoin than for most assets, for a structural reason. A large share of trading is done by leveraged traders who watch the same moving averages and levels, and liquidations cluster around them. That makes some levels self-fulfilling, at least for a while. The indicators I use are standard:


Pₜ is the daily close, n is the lookback in days, λ is the exponential smoothing weight, and the MACD signal line is the 9-day EMA of MACDₜ. Ūₜ and D̄ₜ are Wilder’s 14-day smoothed averages of daily gains and losses (λ = 1/14), s₂₀(t) is the 20-day standard deviation of closes, BB⁺ and BB⁻ are the upper and lower Bollinger bands, and %B locates the price within the bands (0 at the lower band, 1 at the upper).
Trend: caught between the averages
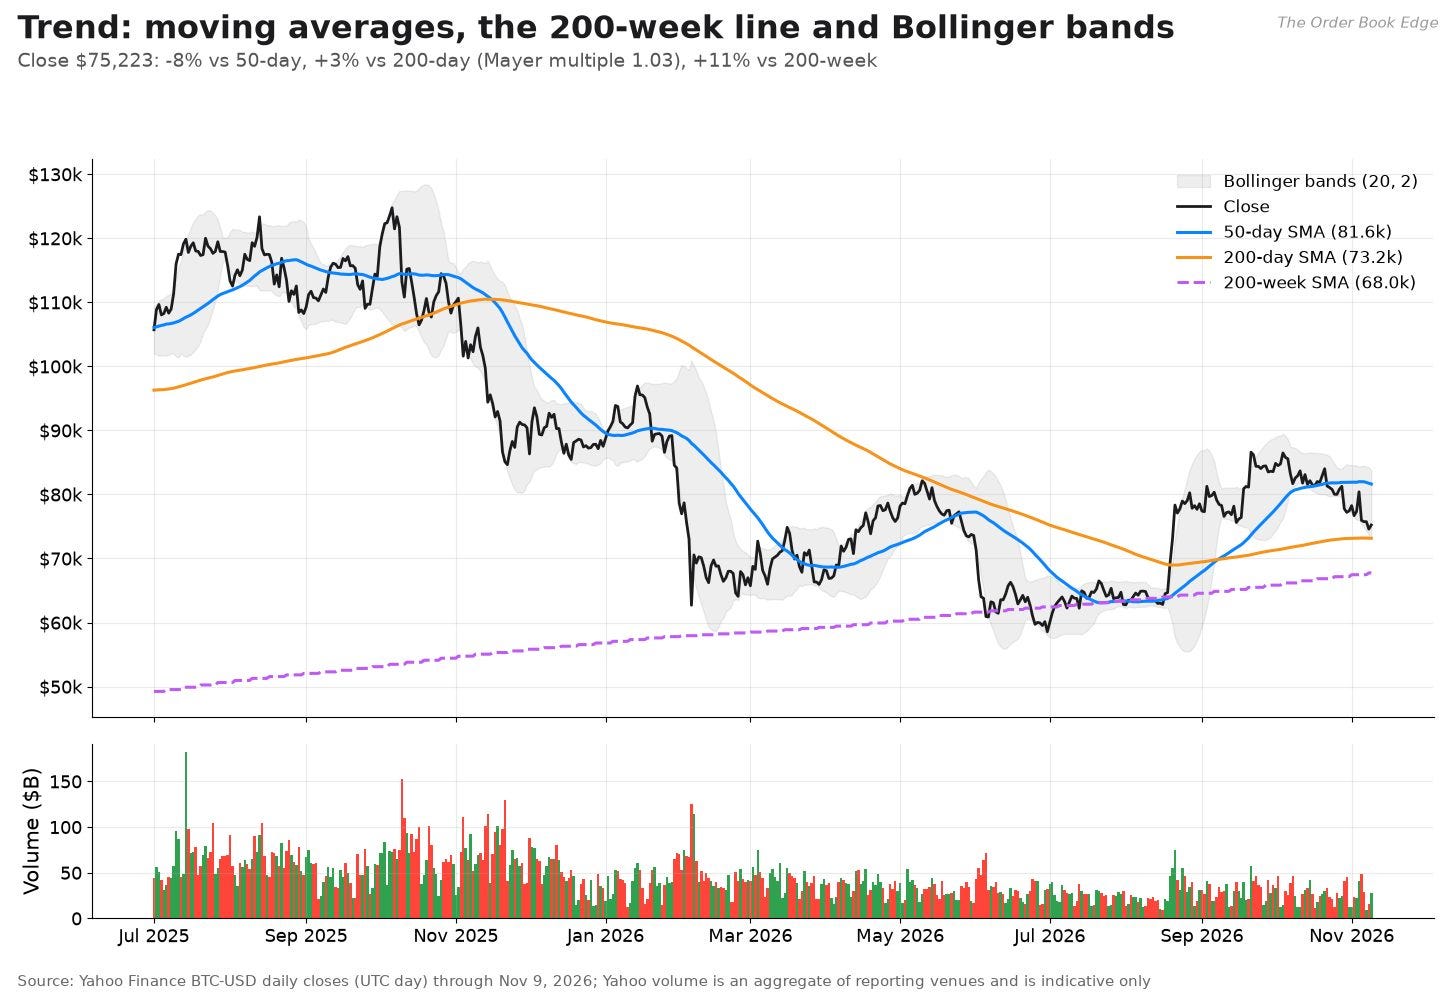
Bitcoin closed at $75,223, 7.8% below its 50-day moving average ($81,620) and 2.8% above its 200-day ($73,154). The 200-day is still rising, up 1.7% over the past 30 days, which is one reason many traders still treat the longer trend as intact. The 50-day crossed above the 200-day (a “golden cross”) on September 8, 2026, after a “death cross” on November 16, 2025. Since the 50-day is now falling toward the 200-day, another death cross is possible within weeks if the price stays below $80,000. Crosses are lagging signals, and in bitcoin they have a poor record as timing tools.
The 200-week moving average, which many long-term investors regard as bitcoin’s bear-market floor, is $68,023. In the 2015, 2018 and 2022 bear markets, the price fell to or below that average near the bottom. In 2026 it fell below it in June but did not stay there. The 50-week average, $75,181, is almost exactly the current price. Cointelegraph reported that CryptoQuant estimates the short-term holders’ average cost basis at about $75,700. That is a level I cannot verify independently, but it matches the cluster of averages here. The Mayer multiple, the price divided by the 200-day average, is 1.03, which is neutral. Historically, readings below 0.8 have marked deep value and readings above 2.4 have marked tops.
Momentum: weak but not washed out
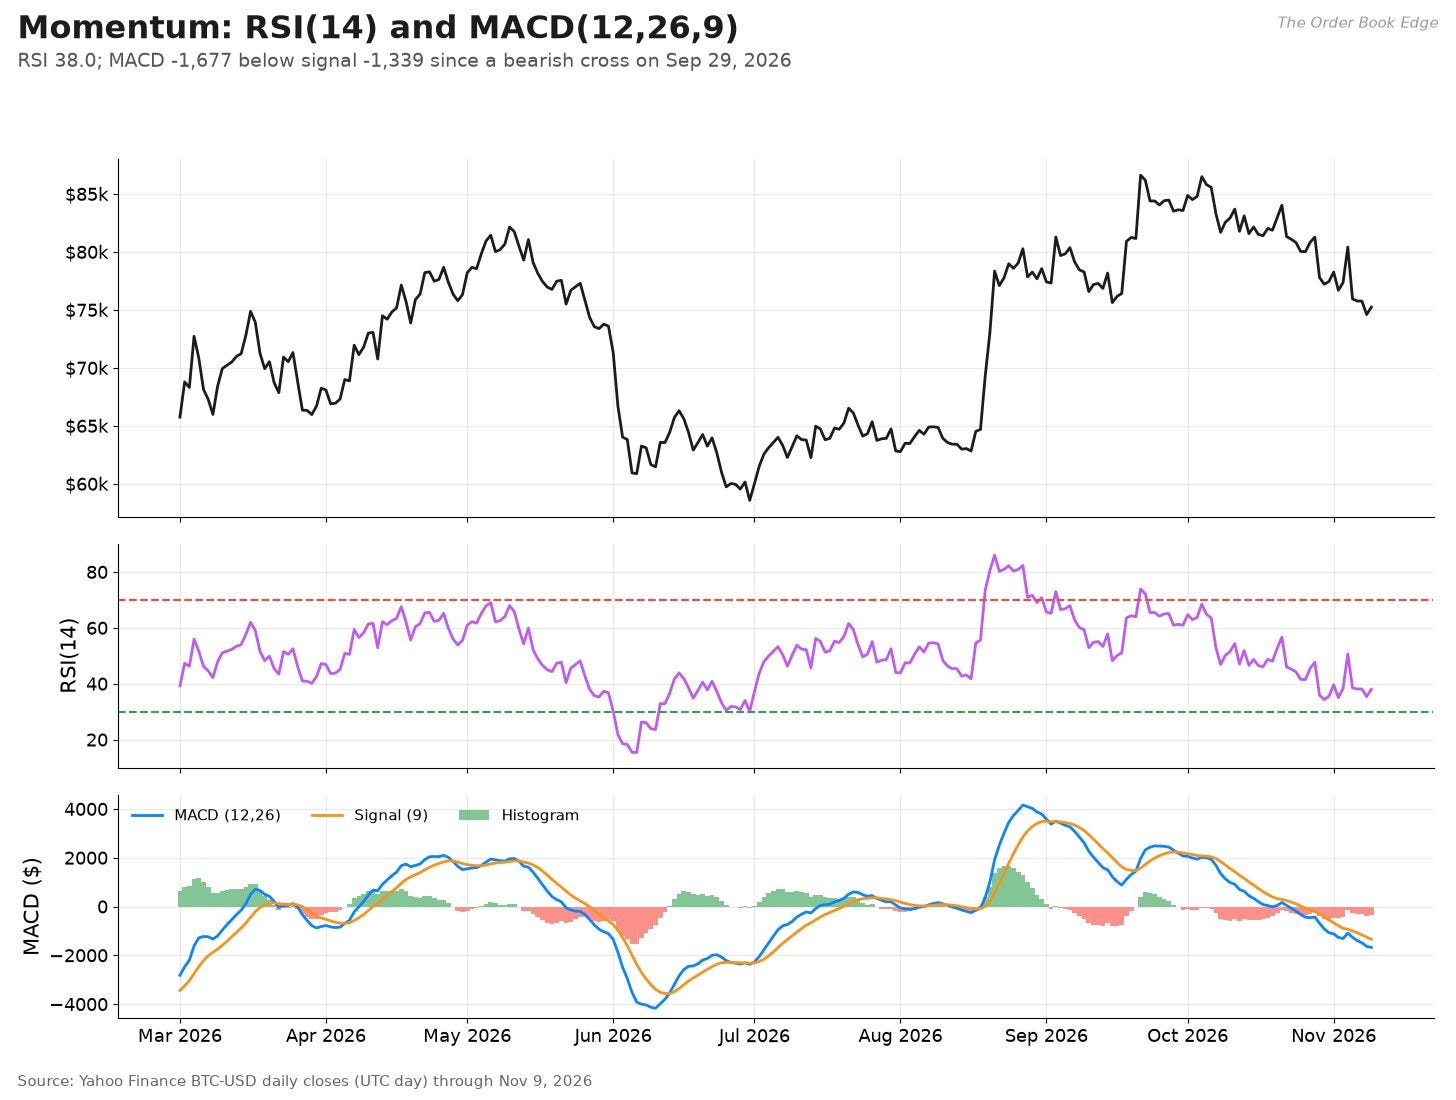
The 14-day RSI is 38. That is weak, but it is not oversold, which is usually defined as below 30. MACD is −1,677, below its signal line at −1,339. It crossed below on September 29 and has stayed there through the October rally attempt. The Bollinger bands are at $73,409 and $83,753 around a 20-day average of $78,581. The price is near the lower band (%B of 0.18), and the snapshot price of $72,739 was below it. The band width is 13.2% of the middle band, around the 61st percentile of the past year, so volatility is neither compressed nor extreme. In short, momentum is negative and the market has room to fall further before indicators would call it oversold.
Support and resistance
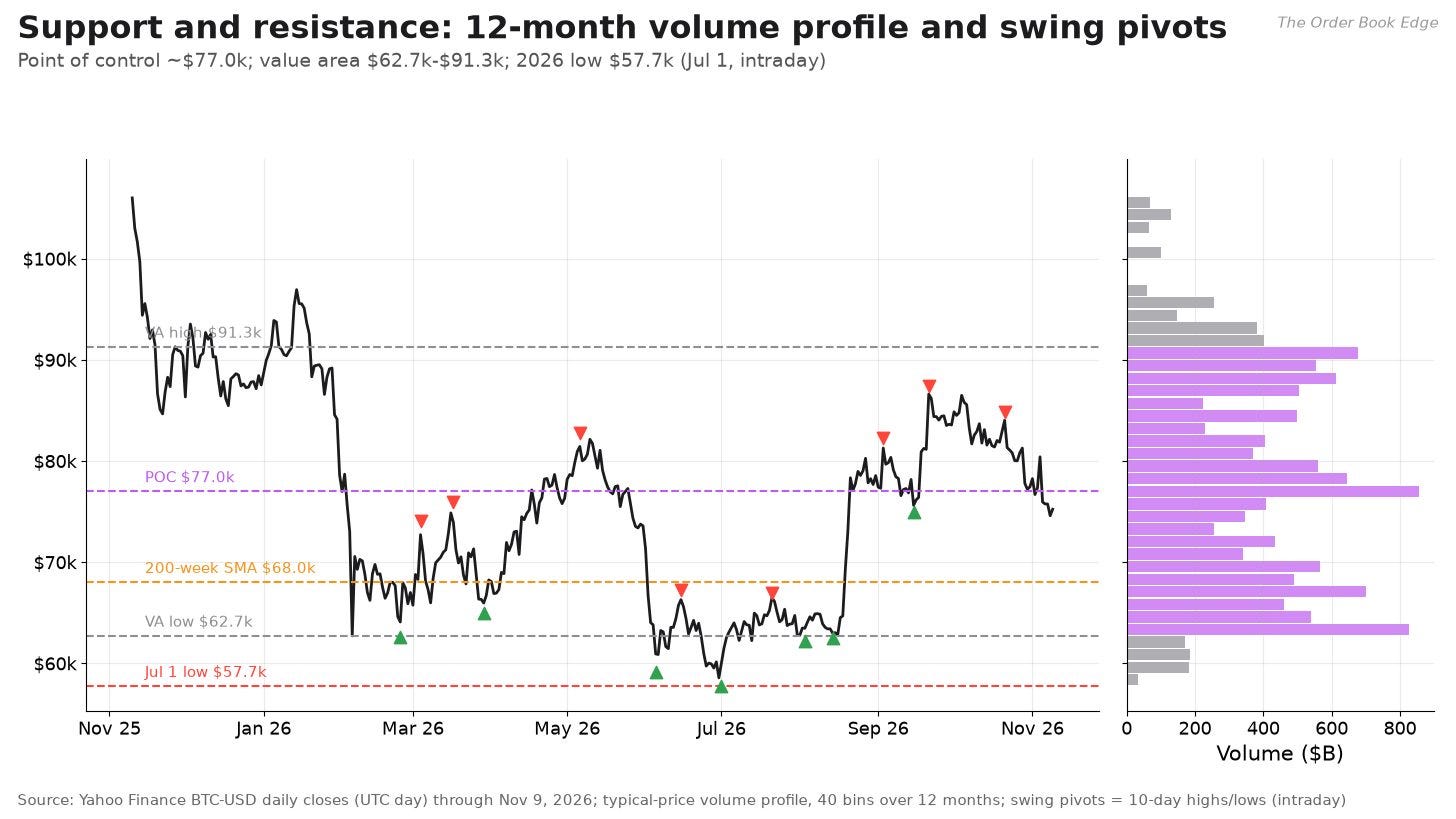
To avoid drawing lines by eye, I derive levels from data in two ways. The first is a volume profile, which adds up 12 months of daily volume by price. The highest-volume price, the point of control, is about $77,000. The value area, which holds 70% of volume, runs from about $62,700 to $91,300. The second is swing pivots, defined as daily highs and lows that are the highest or lowest in a 21-day window. Volume data for bitcoin are an aggregate reported by Yahoo Finance from a set of exchanges, not a complete market total, so the profile shows relative activity rather than precise volume.
Resistance:
$77,000–$78,600: the point of control and the 20-day Bollinger middle band.
$81,600–$82,800: the 50-day average and the May and September swing highs.
$84,800 and $87,400: the October 21 and September 21 swing highs. A close above $87,400 would make a series of higher highs and change the picture.
Support:
$73,000–$73,700: the 200-day average and the November 9 intraday low.
$68,000: the 200-week average.
$62,200–$62,700: the August swing lows and the bottom of the value area.
$57,700–$59,100: the June and July lows, the low of the bear market so far.
Synthesis: three scenarios
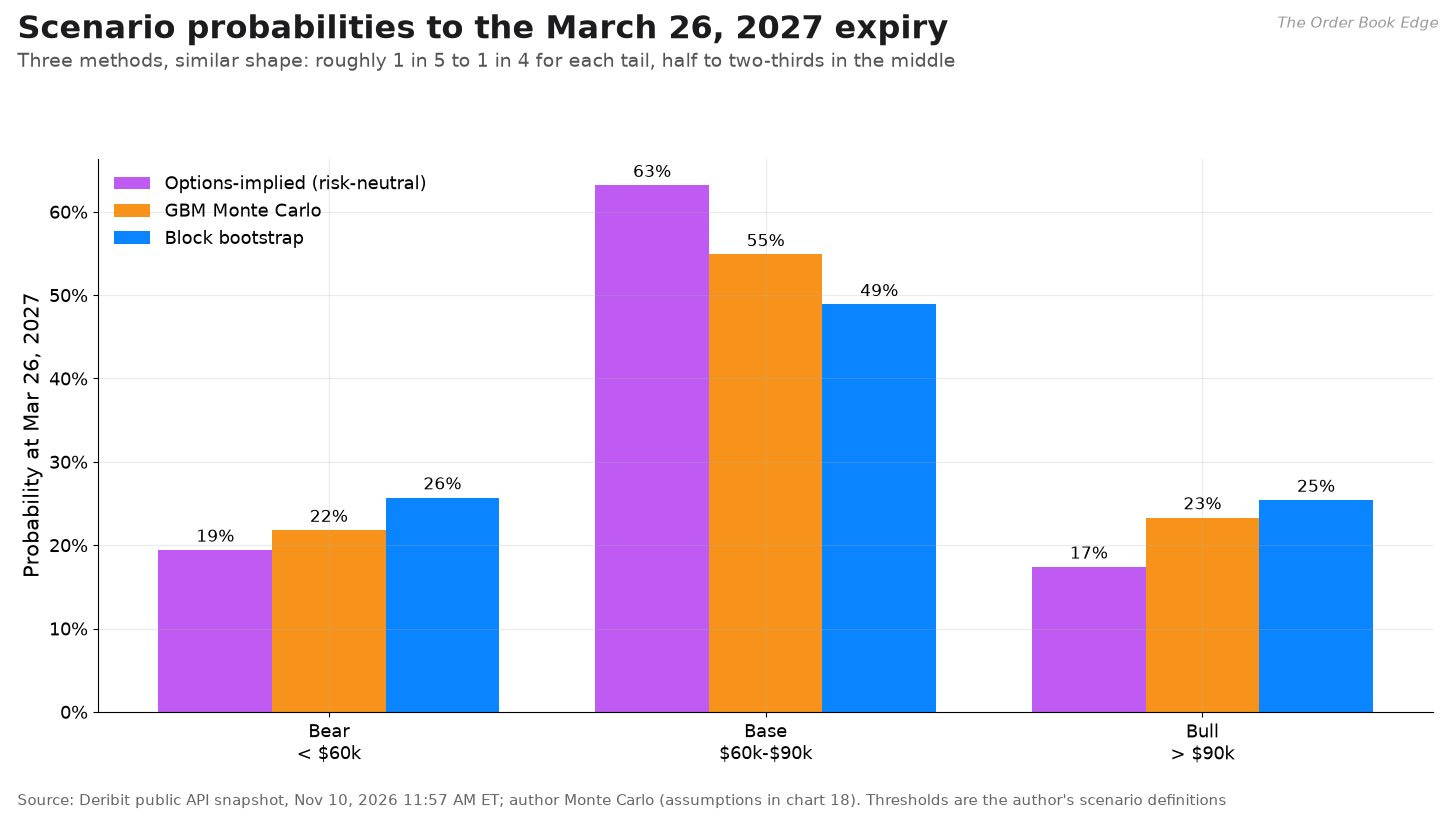
Every method in this article points the same way. The center of the distribution is near today’s price, and the tails are wide. I use three scenarios for the March 26, 2027 quarterly expiry, about four and a half months out, for which there is a liquid options market. The thresholds are my definitions. I estimate probabilities three ways and label them:
Options-implied (risk-neutral): from the Breeden-Litzenberger density, using Deribit marks at the snapshot.
GBM Monte Carlo: 44.3% volatility, T-bill drift, starting from the November 9 close.
Block bootstrap: five years of actual daily returns, recentered to the same drift.
Bear case, below $60,000 (options 19%, GBM 22%, bootstrap 26%). Under this scenario, the Fed hikes in December and signals more, ETF outflows continue, and miners and corporate treasuries keep selling. Some combination of a new Binance shock, a regulatory move under the new Congress, or an equity sell-off as AI stocks re-rate breaks the June lows. The halving-cycle pattern would then point to a final low in the $45,000 to $55,000 range in the first half of 2027. That would be a drawdown of 56% to 64% from the record, in line with a smaller version of earlier cycles. For context, the March 2027 options market puts 7% probability below $50,000.
Base case, $60,000 to $90,000 (options 63%, GBM 55%, bootstrap 49%). Bitcoin chops sideways in a wide range. The June low holds, as the cycle pattern suggests it should, but there is not enough new demand to retake $90,000. ETF flows swing between modest inflows and outflows, funding stays around 5% to 10%, and implied volatility stays near 40%. This is what both the options market and the simulations see as most likely, and it is consistent with bitcoin’s history after cycle troughs, which have usually been followed by many months of basing.
Bull case, above $90,000 (options 17%, GBM 23%, bootstrap 25%). Inflation cools, the Fed holds, and ETF inflows return, as they did in August and September. Leveraged shorts that built up in November are forced to cover. The price clears the $87,400 September high and the market starts to price the next halving. Even in this case, a new record above $126,000 by March is a long shot: about 1% in the options market.
Why do the simulations put more weight on both tails than the options market does? Because I gave them higher volatility (44% and 51%) than the market’s implied 40%, and because neither simulation has a skew. The options market’s higher downside probability relative to its upside probability comes from skew. That is useful information. It tells you the market is more worried about a crash than it is hopeful about a squeeze. Remember, though, that risk-neutral probabilities include an insurance premium, so they may overstate real-world downside.
Risks and catalysts
Near-term catalysts:
November 13: the Friday options expiry ($2.4 billion), and the next difficulty adjustment, estimated at about −7%.
November 27: the monthly options expiry ($5.6 billion, max pain $79,000).
December 9: the Federal Reserve’s decision. A hike, especially a 50-basis-point move, would raise the risk-free rate against which bitcoin’s carry and opportunity cost are measured.
December 25: the year-end quarterly expiry, the largest at $10.3 billion of open interest.
Ongoing: daily ETF flows, Binance’s recovery from the October hack and any new legal action, and the legislative agenda of the incoming Congress, including the stalled CLARITY Act.
April 2028: the next halving, about 17 months away.
Downside risks:
Rates. Inflation surprises and a Fed hiking cycle are the clearest threat.
Equity correlation. With a 0.3 to 0.5 correlation to the Nasdaq, an AI-led stock sell-off would probably take bitcoin with it.
Forced sellers. Miners whose margins are squeezed, listed companies holding bitcoin on their balance sheets, and ETF holders who bought near the top are all potential sources of supply. CNBC reported in June that Strategy, the largest corporate holder, made its first sale since 2022.
Exchange and custody risk. The Binance theft showed that the largest venue is still vulnerable. A second major failure would damage confidence and liquidity.
Regulation. The new Congress could slow or reverse the policy gains of 2025.
Leverage. Open interest is rising as the price falls. A sharp drop could set off another liquidation cascade.
Upside risks:
Short covering. Rising open interest and negative skew mean a lot of traders are positioned for further declines. A positive surprise could force them to buy.
A return of ETF demand. August and September showed how quickly flows can turn.
A softer Fed. Weak economic data or an easing in inflation could bring rate cuts back into view.
Cycle timing. If the June low was the cycle bottom, history suggests the next 12 to 18 months should be better than the last 12.
What to watch
The $73,000 and $68,000 levels: the 200-day and 200-week averages. A sustained break below $68,000 would put the June low back in play.
$87,400: the September high. A close above it would be the first sign of a new uptrend.
ETF flows: a return to steady inflows would be the clearest sign that demand is coming back.
Funding and basis: funding above 15% to 20% annualized or basis above 10% would mean leverage is building again. Persistently negative funding would mean shorts are crowded.
Options skew: a 25-delta risk reversal moving toward zero or positive would mean fear is fading.
DVOL: a move above 55 to 60, as in February, would signal stress. A drop toward the low 30s would be the kind of complacency that came before last year’s top.
Hash rate and hashprice: a capitulation by miners, with the hash rate falling sharply, has often coincided with cycle lows.
Position sizing
Bitcoin’s volatility makes sizing more important than direction. The Kelly criterion gives the fraction of capital that maximizes long-run growth for a given expected return and volatility:

f* is the optimal fraction of wealth to hold in the asset, μ is the expected annual return, r_f is the risk-free rate, σ is annual volatility, and g(f) is the expected long-run growth rate of wealth at fraction f.
The formula is simple, but its input is not. Suppose you believe bitcoin will beat T-bills by 10 percentage points a year with 45% volatility. Kelly says to hold about 49% of your wealth in it. If the true excess return is zero, the right answer is zero. Because the expected return is so uncertain, practitioners usually use a fraction of Kelly, often half or less, and many simply size bitcoin so that a drawdown of 50% or more, which it has delivered at least six times since 2011, would be survivable. This is a framework, not a recommendation for any specific allocation.
Methodology notes
Annualization: 365 days for bitcoin and 252 for exchange-traded assets. Sharpe and Sortino use the 3-month T-bill yield of 4.19% (FRED DGS3MO, November 6, 2026).
Cross-asset statistics: weekly Friday closes to reduce the timing mismatch between bitcoin’s 24/7 trading and U.S. market hours. The 10-year yield enters as weekly changes in percentage points.
Halving cycles: each cycle’s peak is the highest close within 730 days of the halving, and its trough is the lowest close within 1,100 days.
Implied volatility: at-the-money IV is interpolated from out-of-the-money marks at zero log-moneyness. 25-delta volatilities are interpolated by delta from Deribit’s own deltas. Max pain uses dollar payouts.
Risk-neutral density: smoothing cubic spline of mark IVs, Black-76 with r = 0, 1,500-point strike grid, numerical second derivative, light Gaussian smoothing, negative values set to zero, renormalized. Probabilities beyond the outermost listed strikes depend on extrapolation and are less reliable.
Monte Carlo: 20,000 paths per method, 365 daily steps, fixed random seed. Drift and volatility are my assumptions, stated above.
Hashprice: 30-day average miner revenue (blockchain.com, subsidy plus fees, in dollars) divided by the 30-day average hash rate, in dollars per petahash per second per day.
Two as-of points: spot statistics use the November 9 UTC close of $75,223. Derivatives use the November 10, 11:57 a.m. ET snapshot, when the Deribit index was $72,739.
Not verified or not available:
CME data: CME settlement data could not be retrieved, because automated access is blocked.
Trade-weighted dollar: FRED’s DTWEXBGS series timed out, so I used the ICE Dollar Index instead.
ETF holdings: daily holdings in BTC were not available from a free source. I report flows only.
Third-party figures: liquidation totals (CoinGlass), the short-term holder cost basis (CryptoQuant), SoSoValue ETF figures, MARA’s reported sales, and the December rate-hike odds come from news reports and were not independently verified.
Hash rate: daily hash-rate figures are estimates derived from block times and are noisy.
Sources
Prices: Yahoo Finance (BTC-USD, SPY, QQQ, GLD, DX-Y.NYB, ^TNX, BTC=F) and blockchain.com Charts API (market price, hash rate, difficulty, total supply, miner revenue, fees).
On-chain and rates: mempool.space API (block height, hash rate, difficulty adjustment) and Federal Reserve Bank of St. Louis FRED (DGS3MO, DGS10, WALCL).
ETF flows: Farside Investors, Bitcoin ETF flow data.
Derivatives: Deribit public API (options chain, futures, perpetual, DVOL) and the Binance, Bybit and OKX public APIs (funding history, open interest).
News: Binance, incident report; AP; Reuters via Yahoo Finance; Bloomberg via Yahoo Finance; CoinDesk; FXStreet; Cointelegraph; Bitcoin Magazine; The Block; CNBC; CNN; Investing.com. Links appear in the text.
Academic: Black, F. (1976), “The Pricing of Commodity Contracts,” Journal of Financial Economics. Breeden, D. and Litzenberger, R. (1978), “Prices of State-Contingent Claims Implicit in Option Prices,” Journal of Business. Kelly, J. L. (1956), “A New Interpretation of Information Rate,” Bell System Technical Journal. Cornish, E. A. and Fisher, R. A. (1938), “Moments and Cumulants in the Specification of Distributions.”
Stock-to-flow: PlanB (2019), “Modeling Bitcoin Value with Scarcity.”
Final word
Bitcoin’s market is telling a consistent story. The trend is down and demand from the institutions that drove the last rally has stalled. Traders are paying for protection, not for upside. But the system is not overleveraged, the network is healthy, the supply schedule is unchanged, and the cycle that has shaped every previous bear market says the worst may be close to over. The most likely outcome, by every method here, is a wide range around today’s price. The least likely is a quick return to the record. The most useful thing an investor can do is respect the width of that range: size positions for a 50% move in either direction, and watch rates, ETF flows and options skew for the first sign that the balance is shifting.
If you found this useful, subscribing is free.
Disclaimer: This article is for informational and educational purposes only and is not investment, financial, tax or legal advice, or a recommendation to buy, sell or hold any security, cryptocurrency or derivative. Cryptocurrencies and their derivatives are highly volatile, and leveraged products can lose more than the initial margin. The author may or may not hold positions in the assets discussed. Models, scenarios and simulations rest on the author’s assumptions and historical data, which do not guarantee future results. Do your own research and consider consulting a licensed financial professional before making investment decisions.