


Data as of the November 9, 2026 close unless noted. Written November 10, 2026. Not investment advice.
Apple closed Monday, November 9, 2026 at $350.69. That is the highest close in the company’s history. It came one week after a quarter that set September-quarter records for revenue, iPhone sales and earnings per share, and a guide that the company itself called “the best quarter for revenue in the history of the company.” At roughly 14.53 billion shares, the equity is worth about $5.10 trillion.
The stock got there while the market around it stalled. Over the past three months AAPL is up 15.0% while SPY is down 2.1% and QQQ is down 5.3%. Over the past month, while QQQ lost 9.6%, Apple gained 4.2%. Its one-year beta to the S&P 500 has fallen to 0.60, close to the lowest reading of the past decade. For a stock that usually trades as the market’s largest single weight, Apple has been behaving like a defensive asset.
So is this the start of a new leg, or the part of the cycle where a great company becomes an expensive stock? Those are different questions, and they need different tools. Fundamental analysis tells you what the business earns and what the price implies about the future. Quantitative analysis tells you how the stock behaves: how much it moves, how it correlates, how deep its drawdowns get and what a reasonable range of outcomes looks like. Technical analysis tells you where the current trend stands and where supply and demand have clustered.
This piece runs all three. Everything is built from public data that anyone can pull: Apple’s SEC filings, daily prices, Treasury yields from the St. Louis Fed’s FRED database, and the Fama-French factor library. Every chart has its source in the footer. Every quant method comes with plain pseudocode and the formula, so you can rebuild it yourself. Where a number is my assumption rather than a fact, I say so.
Executive summary
The business is at a cyclical high, and it is a high-quality one. Fiscal 2026, which ended September 26, 2026, produced $478.8 billion of revenue (up 15%), a 48.8% gross margin, a 33.0% operating margin, $132.2 billion of net income and diluted EPS of $8.98 (up 20%). iPhone revenue grew 21% to $254.1 billion. Services grew 13% to $123.3 billion and now carries a 76.2% gross margin. Free cash flow (operating cash flow minus capital spending) was $136.1 billion.
The near-term debate is margins, not demand. Management guided the December quarter to 7% to 10% revenue growth, ahead of the 6.1% that analysts polled by LSEG expected, according to CNBC. But it guided gross margin to 45% to 46%, below the 46.3% consensus, citing memory costs it described as “unprecedented” and the cost of rolling out Siri AI. Services growth is guided to 8% to 9%, after September-quarter Services growth of 9.8% had already slipped below 10%, a point Barclays flagged. The stock fell 1.9% the session after the report, then rallied to a record within a week.
The valuation is demanding. At $350.69, Apple trades at 39.1 times trailing EPS, above 95% of quarter-end readings since late 2016 and well above the 10-year median of 26.2 times. The free cash flow yield is 2.7%. My base-case discounted cash flow model, using the author’s assumptions laid out below, gives about $207 per share. A reverse DCF says the price implies roughly 14.5% annual free cash flow growth for ten years at a 9% discount rate. Apple’s actual free cash flow grew 9.8% a year over the past decade.
The stock’s behavior has changed. Ten-year annualized volatility is 29.2% and the daily return distribution has fat tails (excess kurtosis 6.8). But the rolling one-year beta has dropped from above 1.5 at its peak to 0.60, and the one-year correlation with SPY is only 0.33. Factor regressions show Apple loads heavily on profitability and conservative investment and negatively on value and momentum. Its five-year alpha is positive but not statistically significant.
The trend is up, with short-term momentum cooling. Price is 17% above a rising 200-day average, and the 50-day has been above the 200-day since a golden cross on September 15, 2025. RSI is a neutral 58. MACD crossed below its signal line on October 28 and the Bollinger bands are the tightest they have been in about a year, which often precedes a larger move in either direction.
Bottom line, framed as scenarios rather than a call:
Bull view: iPhone Duo and the foldable cycle extend double-digit iPhone growth into fiscal 2027 and 2028, memory costs peak, Siri AI opens new Services revenue, and buybacks keep shrinking the share count about 2% a year. In that world EPS can compound in the mid-teens, and a premium multiple holds.
Base view: a strong but ordinary upgrade cycle, gross margin settling back to the mid-40s for several quarters, Services growing high single digits. Earnings grow, but the multiple has little room to expand, so returns depend mostly on earnings growth and buybacks.
Bear view: memory inflation and Siri AI costs compress margins for longer, regulators in the US and EU cut into App Store and search-licensing income, and the multiple drifts back toward its 5-year median of about 30 times. Even with earnings growth, that alone would imply meaningful downside from here.
None of this is a recommendation. It is a map of what the price is assuming, how the stock behaves, and what to watch.
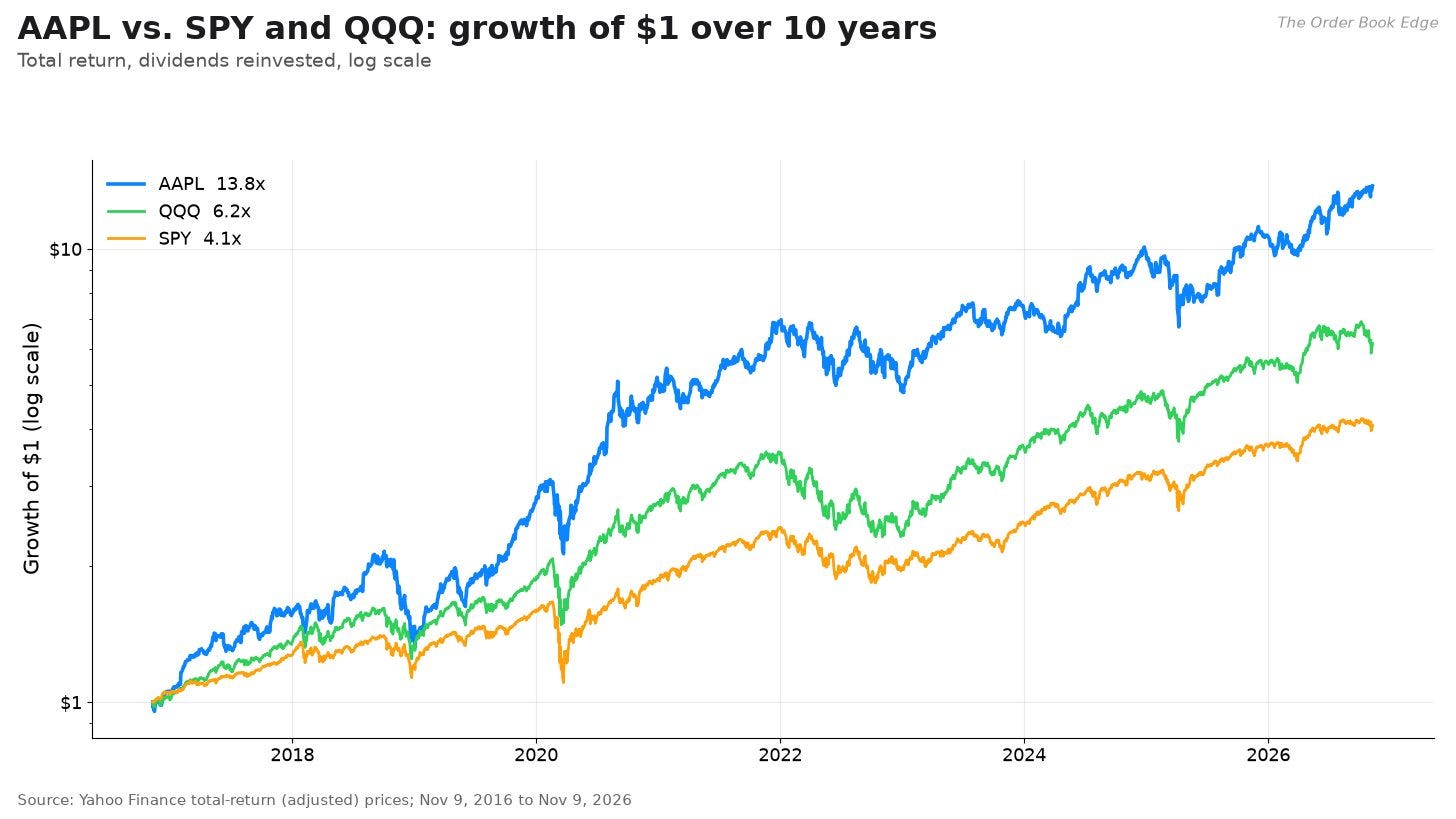
The 10-year record frames the debate. One dollar in AAPL in November 2016, with dividends reinvested, became $13.80 by November 9, 2026. The same dollar in QQQ became $6.20, and in SPY $4.10. That is a 30.0% compound annual return for Apple against 20.0% for QQQ and 15.1% for SPY. The question for the next ten years is how much of that outperformance came from earnings growth, which can continue, and how much came from multiple expansion, which cannot continue forever.
How this analysis was built
A few ground rules before the numbers.
Prices are daily bars from Yahoo Finance pulled through the yfinance library. Returns use split- and dividend-adjusted closes, so they are total returns. Technical indicators use the regular close. The last completed session is November 9, 2026. The partial November 10 bar is excluded.
Fundamentals come from Apple’s Form 10-K filings on SEC EDGAR, both from the XBRL “companyfacts” API and from the category and segment tables in the fiscal 2020, 2023 and 2026 annual reports. Apple filed its fiscal 2026 10-K on November 3, 2026. Quarterly figures come from the earnings release Apple filed as an 8-K exhibit on November 2, 2026.
Guidance and reaction come from the November 2 earnings call transcript and from reporting by CNBC and Reuters, cited inline.
Risk-free rates come from FRED: the 10-year Treasury yield (DGS10) was 4.86% and the 3-month bill (DGS3MO) was 4.19%, both as of November 6, 2026, the latest FRED observation available when this was written.
Factor returns come from Kenneth French’s data library (five-factor model plus momentum, daily), which currently runs through September 30, 2026.
Valuation models (DCF, reverse DCF, scenarios, and the drift used in the Monte Carlo) rest on the author’s assumptions. They are labeled that way every time. They are tools for thinking, not forecasts.
Apple’s fiscal year ends on the last Saturday of September. “FY2026” means the 52 weeks ended September 26, 2026.
Part 1: Fundamental analysis
Revenue and the product mix
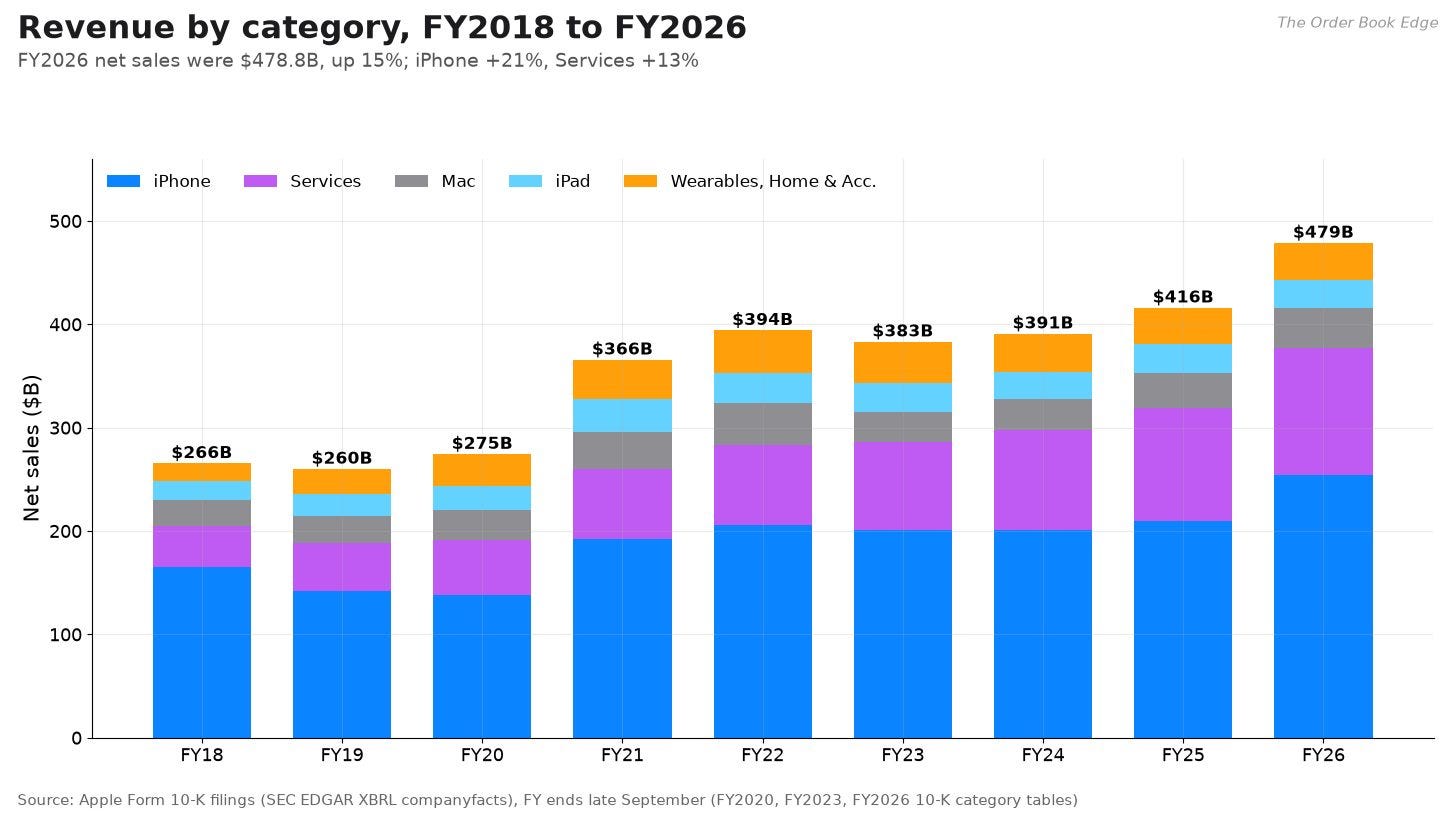
Apple reports revenue in five categories. Here is how fiscal 2026 broke down, with the change from fiscal 2025, from the 10-K:
iPhone: $254.1 billion, up 21%. Apple attributes the growth to “higher net sales of Pro models.” It is 53% of total revenue.
Services: $123.3 billion, up 13%. Apple cites advertising and cloud services as the main drivers. It is 26% of revenue.
Mac: $37.9 billion, up 13%, driven by laptops.
iPad: $27.9 billion, flat.
Wearables, Home and Accessories: $35.6 billion, flat.
Total net sales were $478.8 billion, up 15%. That is the fastest annual growth since fiscal 2021, when revenue jumped 33% on the pandemic upgrade wave. The longer arc is less dramatic. Revenue compounded at 8.3% a year from fiscal 2016 to fiscal 2026, and at 5.5% a year over the five years from fiscal 2021. Fiscal 2023 and fiscal 2024 were essentially flat years ($383.3 billion and $391.0 billion). Fiscal 2026 is a cycle peak in growth, not a new normal, unless the new iPhone lineup proves otherwise.
The geographic split tells a similar story. Greater China revenue jumped 28% to $82.4 billion after falling 4% in fiscal 2025. The Americas grew 11% to $198.1 billion, Europe 15% to $127.6 billion, Japan 8% to $30.9 billion and the rest of Asia Pacific 18% to $39.9 billion. Apple noted that stronger foreign currencies helped European sales.
The fourth quarter (July through September 2026) showed where the momentum is and where it is fading:
Total revenue $114.5 billion, up 12% year over year.
iPhone $57.6 billion, up 17%.
Mac $10.8 billion, up 24%.
Services $31.6 billion, up 10%.
iPad $6.2 billion, down 10%.
Wearables, Home and Accessories $8.3 billion, down 8%.
Greater China $17.5 billion, up 21%. Japan $6.5 billion, down 1%.
CFO Kevan Parekh said on the call that the quarter faced foreign exchange headwinds of nearly 2 percentage points sequentially and supply constraints on iPhone, Mac and iPad. CEO John Ternus told Reuters that the new iPhone Duo is “constrained as of today” and that Apple could not yet predict when supply and demand would balance. Demand outrunning supply is a better problem than the reverse, but it also means some of the near-term revenue path depends on component availability rather than on customers.
Margins and the Services flywheel
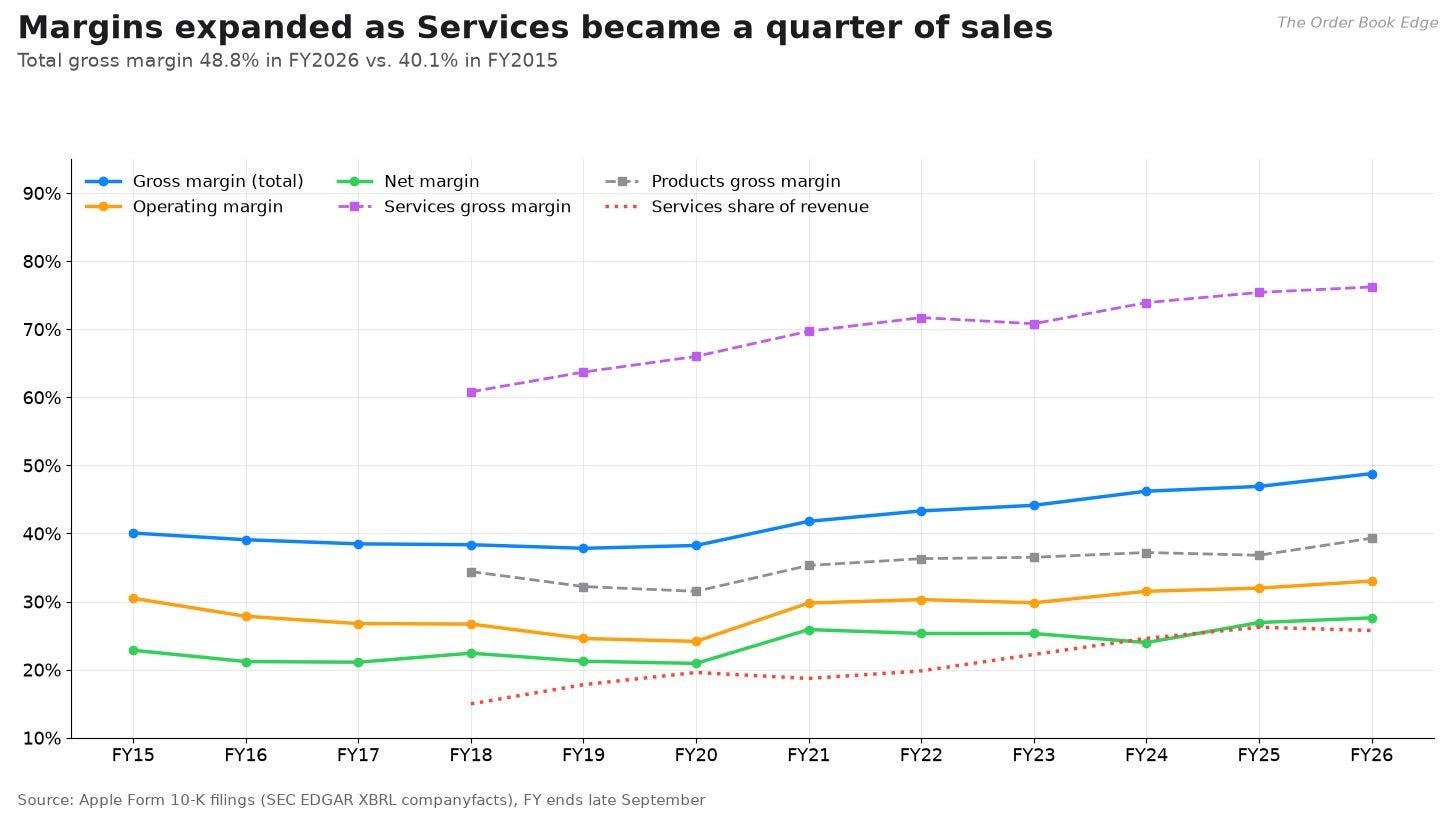
The margin story of the past decade is mix. Services carried a 60.8% gross margin in fiscal 2018 and 76.2% in fiscal 2026. Products went from 34.4% to 39.3% over the same years. As Services grew from 15% of revenue in fiscal 2018 to 26% in fiscal 2026, the blended gross margin rose from 38.3% to 48.8%.
Put another way: Services was about a quarter of revenue in fiscal 2026 but produced $93.9 billion of the $233.6 billion gross profit, about 40%. That is why investors care so much about Services growth. A slowdown there does more damage to profits than its revenue share suggests.
Fiscal 2026 margins also had help that will not repeat. Apple said products gross margin rose “primarily due to product mix and tariff refunds, partially offset by higher costs, including memory.” In the fourth quarter, tariff refunds added about 1 percentage point to gross margin and $0.05 to EPS. Parekh said on the call that Apple has received “the vast majority” of the refunds it was owed. Excluding refunds in both the June and September quarters, company and products gross margins both fell about 1 point sequentially, mainly because of memory.
That sets up the December-quarter guide of 45% to 46%, down from 47.9% in the September quarter and 50.1% in the June quarter (which CNBC reported). Management said memory costs would keep rising into next year. Reuters reported that Apple’s purchase commitments rose by $33 billion during the quarter as it worked to lock in supply. The balance sheet shows the same thing: inventory went from $5.7 billion to $14.5 billion over fiscal 2026.
Operating expenses are also rising fast. Research and development reached $45.8 billion in fiscal 2026, up 32% from $34.6 billion, and equal to 9.6% of revenue. December-quarter operating expenses are guided to $20.4 billion to $20.8 billion, up 11% to 13% from $18.4 billion in the same quarter a year earlier (per Apple’s 10-Q). This is the cost of Apple’s AI push. The bull case says it is an investment that will be monetized. The bear case says it is a permanent increase in the cost of staying competitive.
Operating margin was 33.0% in fiscal 2026 and net margin 27.6%, both the highest of the past decade. The effective tax rate was 17.0%. Fiscal 2024’s net margin of 24.0% was depressed by a one-time $10.2 billion tax charge tied to the European Commission’s Irish state-aid decision.
Earnings per share and the shrinking share count
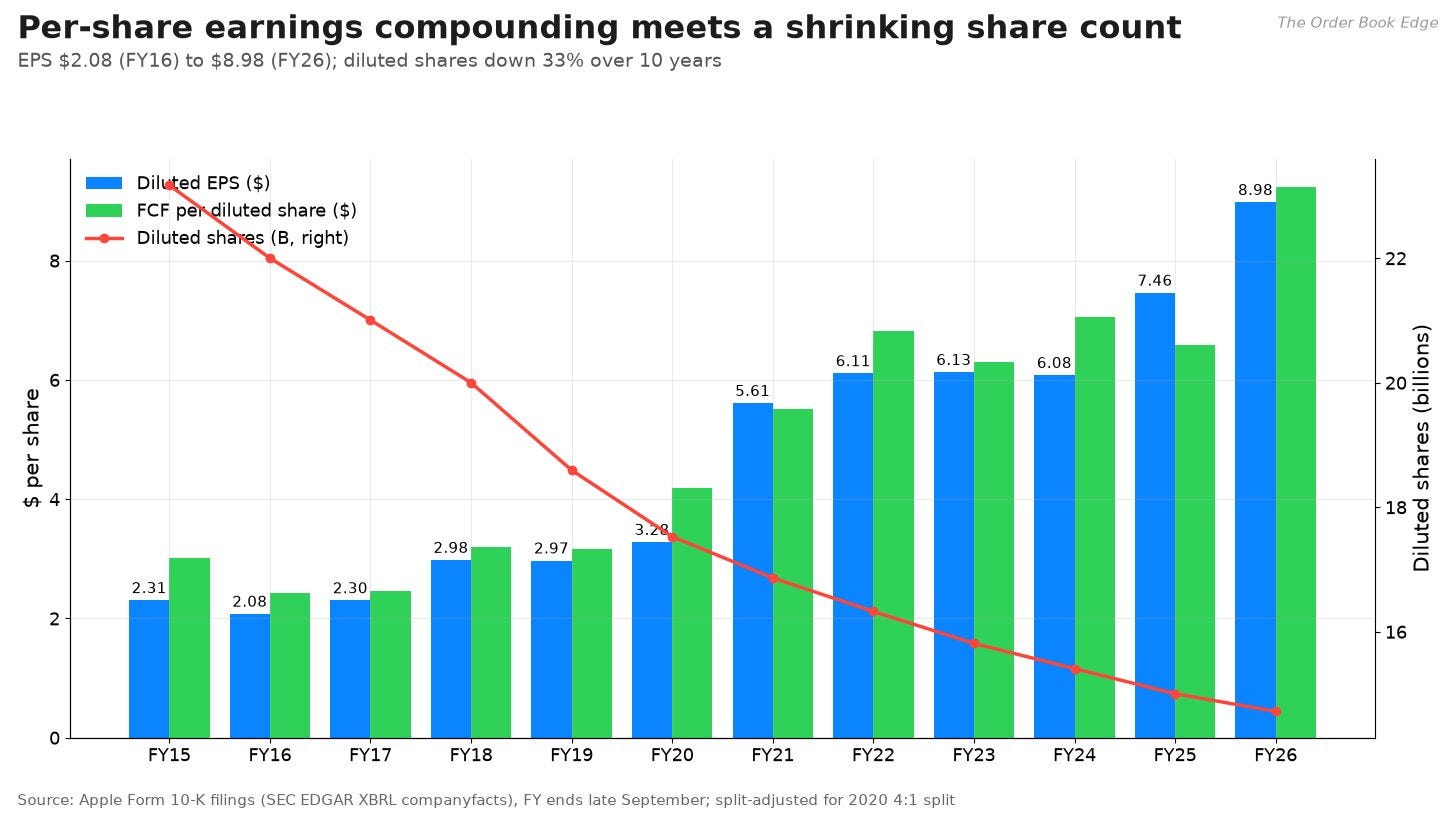
Diluted EPS rose from $2.08 in fiscal 2016 to $8.98 in fiscal 2026 (split-adjusted), a 15.8% compound annual growth rate. Revenue grew 8.3% a year over the same period. The gap comes from two sources: margins rose, and the share count fell. Diluted weighted shares went from about 22.0 billion in fiscal 2016 to 14.72 billion in fiscal 2026, a 33% reduction. In fiscal 2026 alone the diluted count fell 1.9%.
Over the past five years the numbers are tamer. EPS grew 9.9% a year from fiscal 2021 to fiscal 2026, and free cash flow grew 7.9% a year. That five-year window is probably the more honest benchmark for a $5 trillion company, because it includes both the post-pandemic hangover and the current upcycle.
Free cash flow and capital return
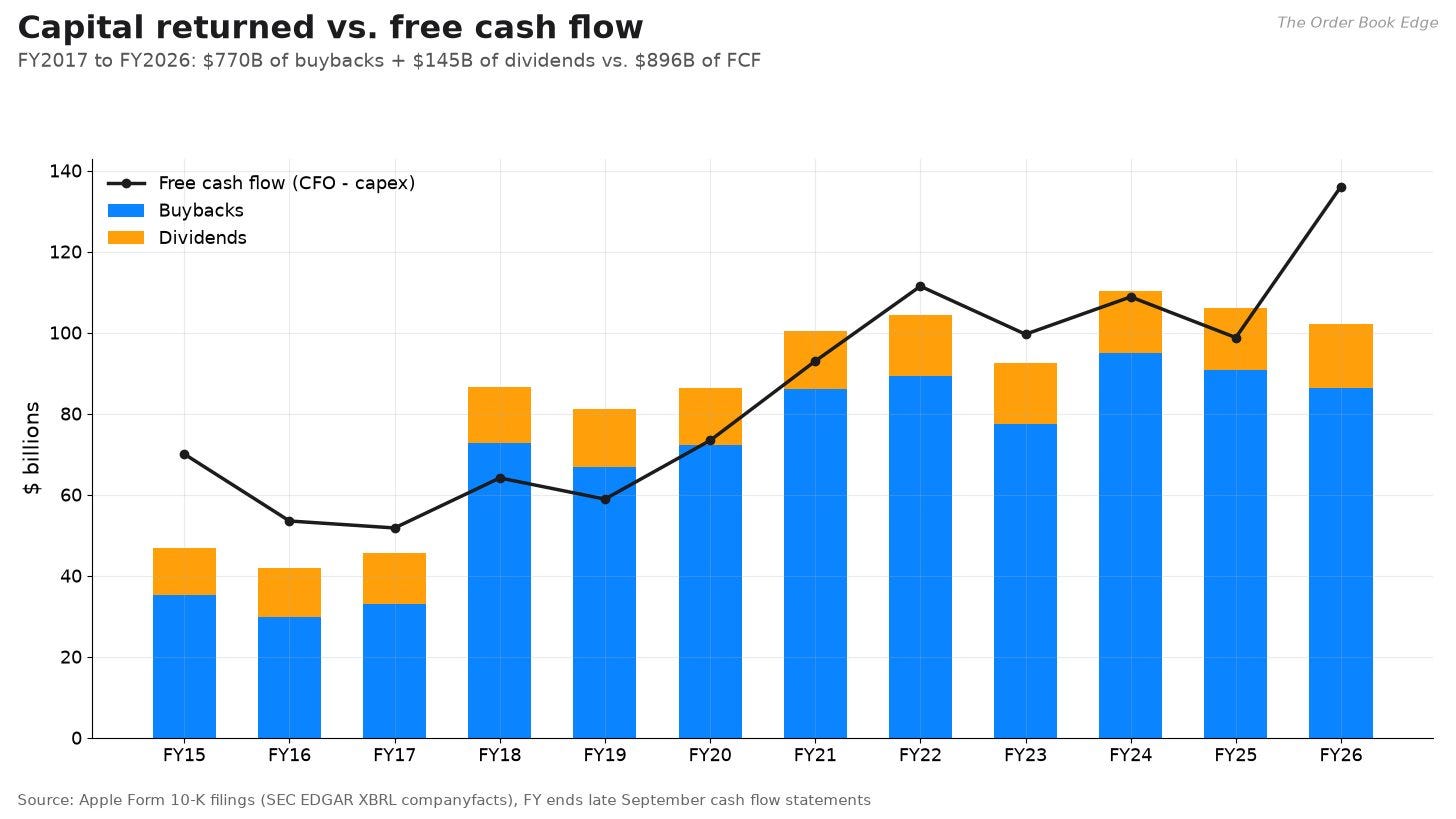
Apple’s cash machine is the core of the investment case. Operating cash flow was $145.1 billion in fiscal 2026 and capital spending was $9.0 billion, leaving $136.1 billion of free cash flow. Stock-based compensation was $13.8 billion. Because that is a real cost to shareholders (it is offset with buybacks), I also use “free cash flow less SBC,” which was $122.3 billion, as the conservative base in the valuation work.
One caveat on fiscal 2026 cash flow: working capital moved a lot. Inventory rose by $8.9 billion, vendor receivables by $6.7 billion and other assets by $21.1 billion, offset by $12.2 billion more payables and $13.7 billion more other liabilities. Free cash flow in fiscal 2025 was $98.8 billion. A blend of the two years, or the fiscal 2026 figure net of SBC, is a sensible starting point.
Over the ten fiscal years from 2017 through 2026, Apple generated $896 billion of free cash flow. It spent $770 billion on buybacks and $145 billion on dividends, which is more than 100% of free cash flow. The difference came from running down the net cash position. In fiscal 2026 Apple repurchased $86.4 billion of stock (cash-flow basis) and paid $15.7 billion of dividends. In April 2026 it authorized a new buyback program of up to $100 billion and raised the quarterly dividend from $0.26 to $0.27. The board declared another $0.27 dividend payable November 16, 2026 to holders of record on November 12.
At today’s price, those flows are worth less to shareholders than they used to be. The dividend yield is 0.31%. Fiscal 2026 buybacks equal 1.7% of the current market value. Together that is about a 2.0% shareholder yield, below the 4.19% yield on 3-month Treasury bills.
The balance sheet
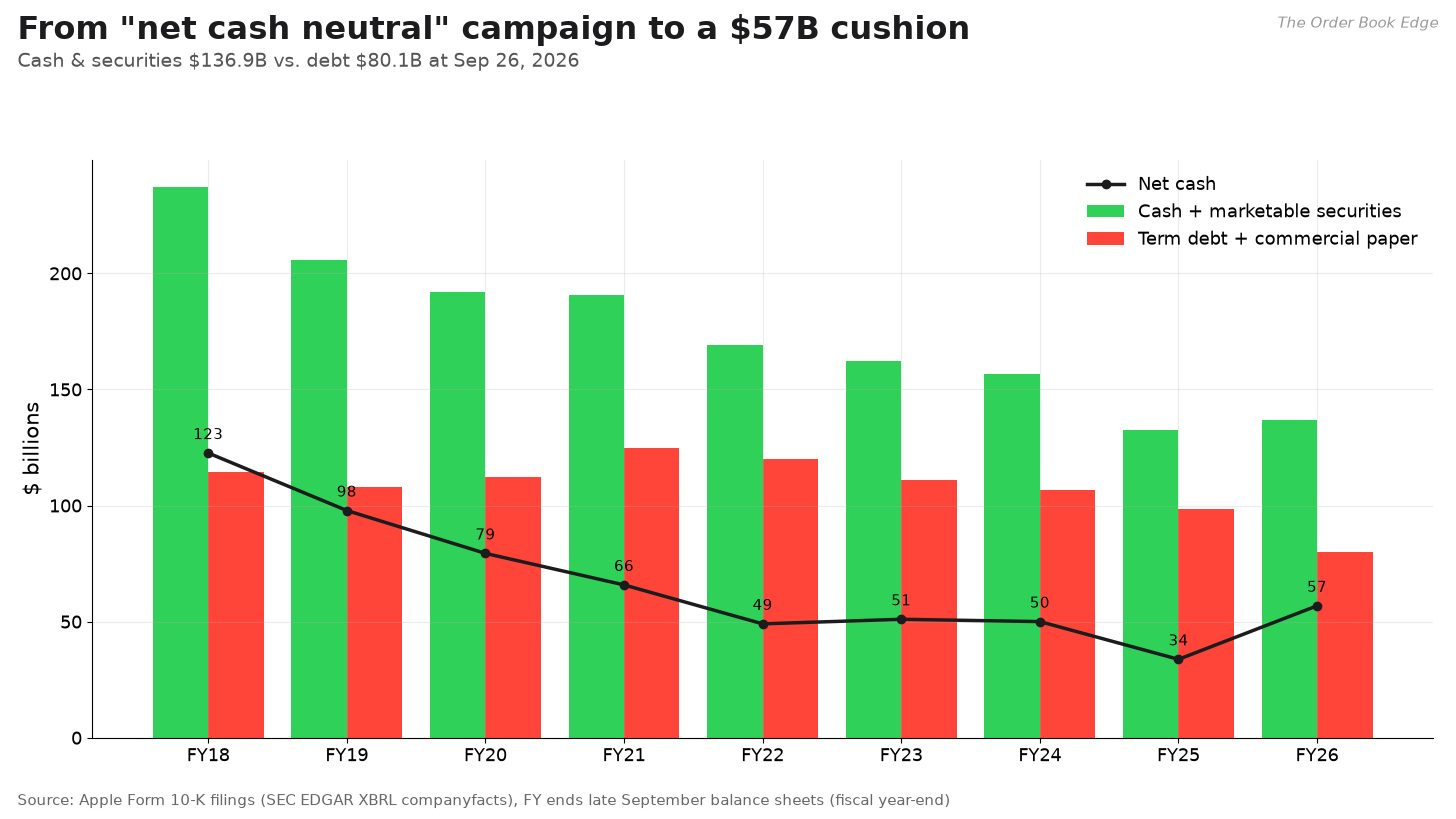
At September 26, 2026, Apple held $36.3 billion of cash, $20.4 billion of current marketable securities and $80.2 billion of non-current marketable securities: $136.9 billion in total. Debt was $78.1 billion of term debt plus $2.0 billion of commercial paper, $80.1 billion in total. Net cash was $56.8 billion, up from $33.8 billion a year earlier.
For years Apple said it aimed to be “net cash neutral” over time. Net cash fell from $123 billion in fiscal 2018 to $34 billion in fiscal 2025, then rebuilt in fiscal 2026 as free cash flow outran capital returns. On November 9, 2026, Apple also sold $7.5 billion of new notes, including fixed-rate notes due 2028 through 2036 with coupons from 4.65% to 5.35%, according to an 8-K filed that day. Borrowing at those rates while holding $137 billion of securities is a treasury-management choice, not a sign of stress.
Shareholders’ equity was $112.1 billion, up from $73.7 billion. Years of buybacks larger than earnings shrank equity, which is why Apple’s return on equity looks absurd.
Returns on capital
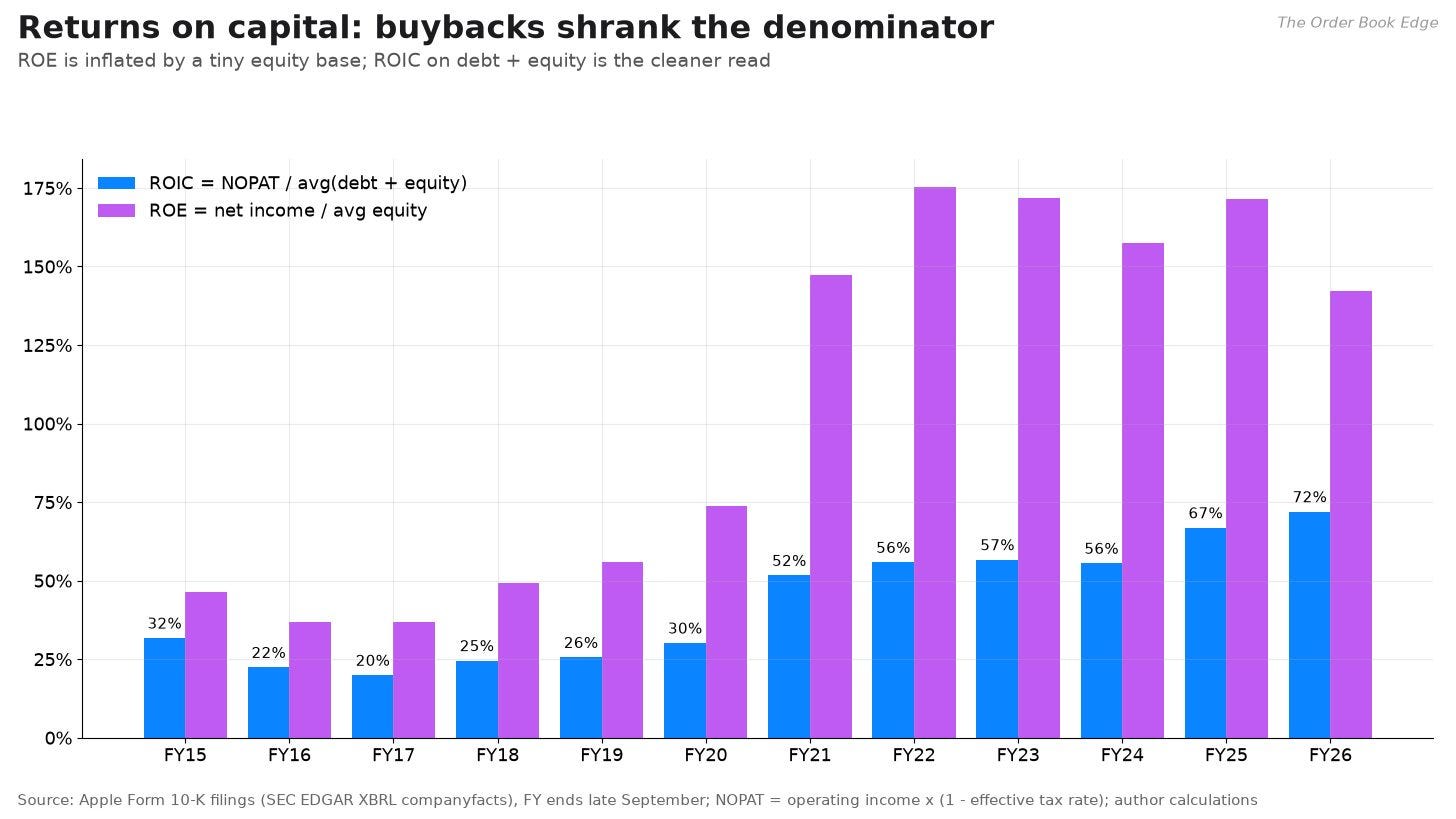
Return on equity was 142% in fiscal 2026 and above 140% every year from fiscal 2021. That number mostly measures how small the equity base has become, not how good the business is.
A cleaner measure is return on invested capital, defined here as after-tax operating income (NOPAT, or operating income times one minus the effective tax rate) divided by average debt plus equity. On that basis Apple earned 72% in fiscal 2026, up from 56% in fiscal 2024 and about 25% to 30% in fiscal 2018 through 2020. If you subtract Apple’s cash and securities from invested capital, the denominator becomes close to zero or negative, which makes the ratio meaningless. That is itself a fact worth knowing: Apple’s operating business needs almost no net capital.
High ROIC is the reason the market is willing to pay a premium. A company that can grow without reinvesting much converts nearly all of its earnings into cash it can hand back. The catch is growth. ROIC tells you how efficiently a business compounds, but at a 2.7% free cash flow yield, the price only works if that compounding continues for a long time.
Valuation versus history
Here are the current multiples, using the November 9 close of $350.69, 14.532 billion shares outstanding (the October 23, 2026 count from the 10-K cover) and fiscal 2026 results:
Market value: about $5.10 trillion. Enterprise value (market value minus $56.8 billion net cash): about $5.04 trillion.
Trailing P/E: 39.1 times EPS of $8.98.
EV to free cash flow: 37.0 times. Free cash flow yield: 2.67%.
EV to sales: 10.5 times. EV to operating income: 31.9 times.
Price to book: about 45 times (not very informative, for the reasons above).
Dividend yield: 0.31%. Buyback yield (fiscal 2026 buybacks over market value): 1.70%.
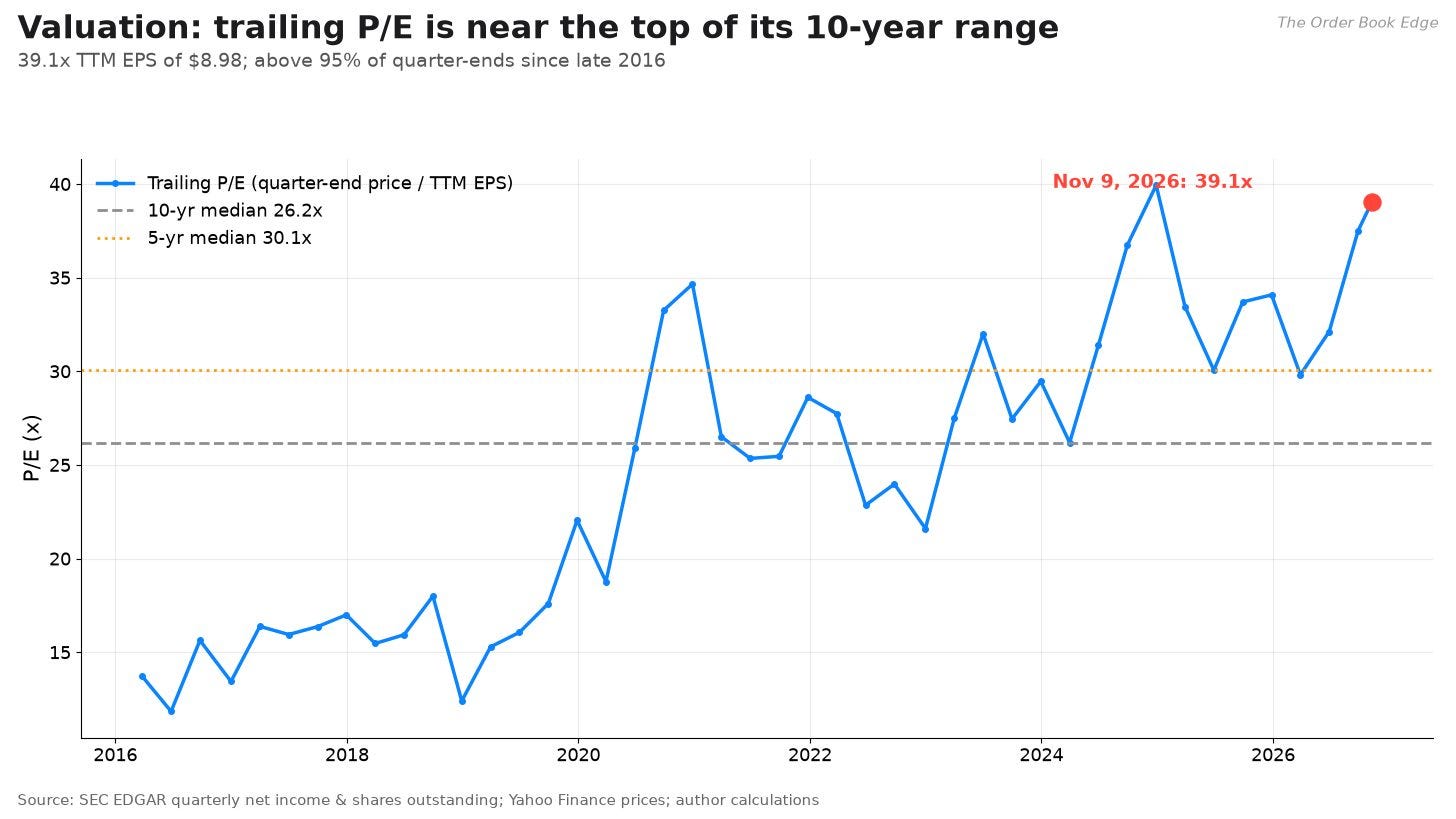
The chart shows trailing P/E at each fiscal quarter-end since 2016, using trailing-twelve-month net income and shares outstanding from SEC filings. The 10-year median is 26.2 times and the 5-year median is 30.1 times. The low was about 12.4 times at the end of December 2018. Today’s 39.1 times is above 95% of those quarter-end readings and only slightly below the decade high of about 39.9 times.
Multiple expansion has been a large part of Apple’s return. In late 2016 investors paid about 13 to 15 times earnings. Today they pay 39. Had the multiple stayed flat, the stock would have returned roughly the 15.8% EPS growth rate plus the dividend, still excellent but about half of what it actually delivered. Investors buying today are not buying that tailwind. If anything, they are exposed to it running in reverse.
A discounted cash flow model
A DCF values a company as the present value of the cash it will produce. It is only as good as its inputs, and every input below is the author’s assumption, chosen to be reasonable and transparent, not to hit a target.
Assumptions (author’s):
Starting cash flow: fiscal 2026 free cash flow less stock-based compensation, $122.3 billion.
Stage 1 growth: 9% a year for years 1 to 5. That sits between the 7.9% five-year and 9.8% ten-year historical free cash flow growth rates, and roughly matches the 7% to 10% revenue guide for the December quarter.
Fade: growth declines in a straight line from 9% to the terminal rate over years 6 to 10.
Terminal growth: 3% a year after year 10, roughly nominal GDP growth.
Discount rate: 9.0%. Built from the 4.86% 10-year Treasury yield plus a beta of about 0.9 times an assumed 4.5% equity risk premium. The beta of 0.9 is a blend: Apple’s five-year beta against SPY is 1.15 and its one-year beta is 0.60. Apple’s debt is small relative to its market value (about 1.6%), so the weighted cost of capital and the cost of equity are almost the same.
Net cash: $56.8 billion added to the value. Shares: 14.532 billion.
Result: the present value of the ten years of cash flows is about $1.18 trillion, and the present value of the terminal value is about $1.77 trillion. The terminal value is 60% of the total, which is typical and is the reason small changes in long-run assumptions move the answer so much. Adding net cash and dividing by shares gives about $207 per share, against a price of $350.69. Using reported free cash flow without the SBC deduction raises the base case to about $230.
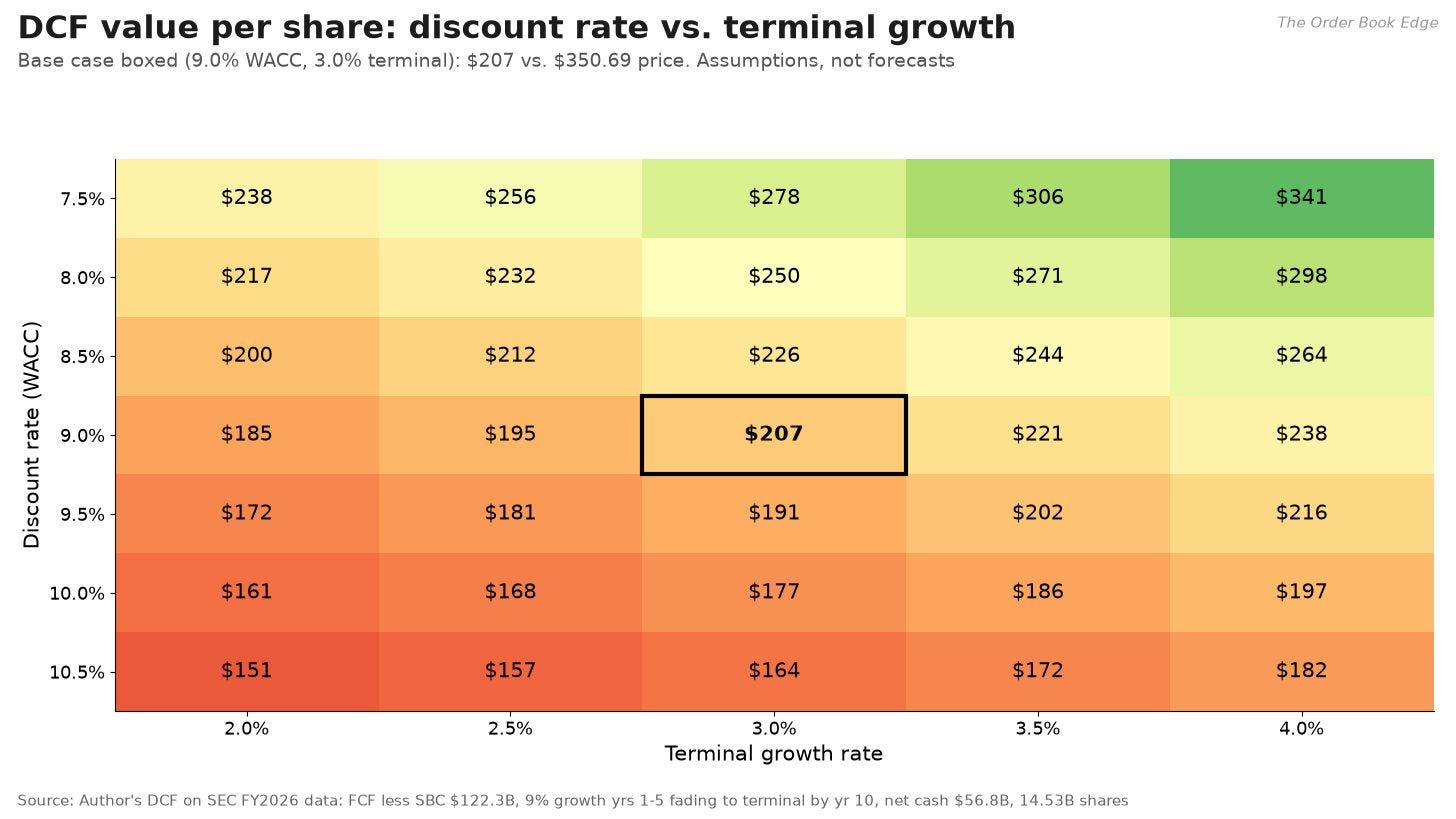
The sensitivity grid shows how the answer moves with the discount rate and the terminal growth rate, holding 9% stage-one growth. The range runs from about $151 (10.5% discount rate, 2% terminal growth) to about $341 (7.5% discount rate, 4% terminal growth). Not one cell in the grid reaches the current price. To get there with these growth assumptions you need a discount rate around 7.5% and terminal growth of 4%, which is aggressive.
Holding terminal growth at 3% and varying stage-one growth instead:
At 9% growth: $177 (10% discount rate) to $278 (7.5%).
At 13% growth: $219 (10%) to $349 (7.5%).
At 15% growth: $243 (10%), $287 (9%) and $391 (7.5%).
A reverse DCF: what is the price assuming?
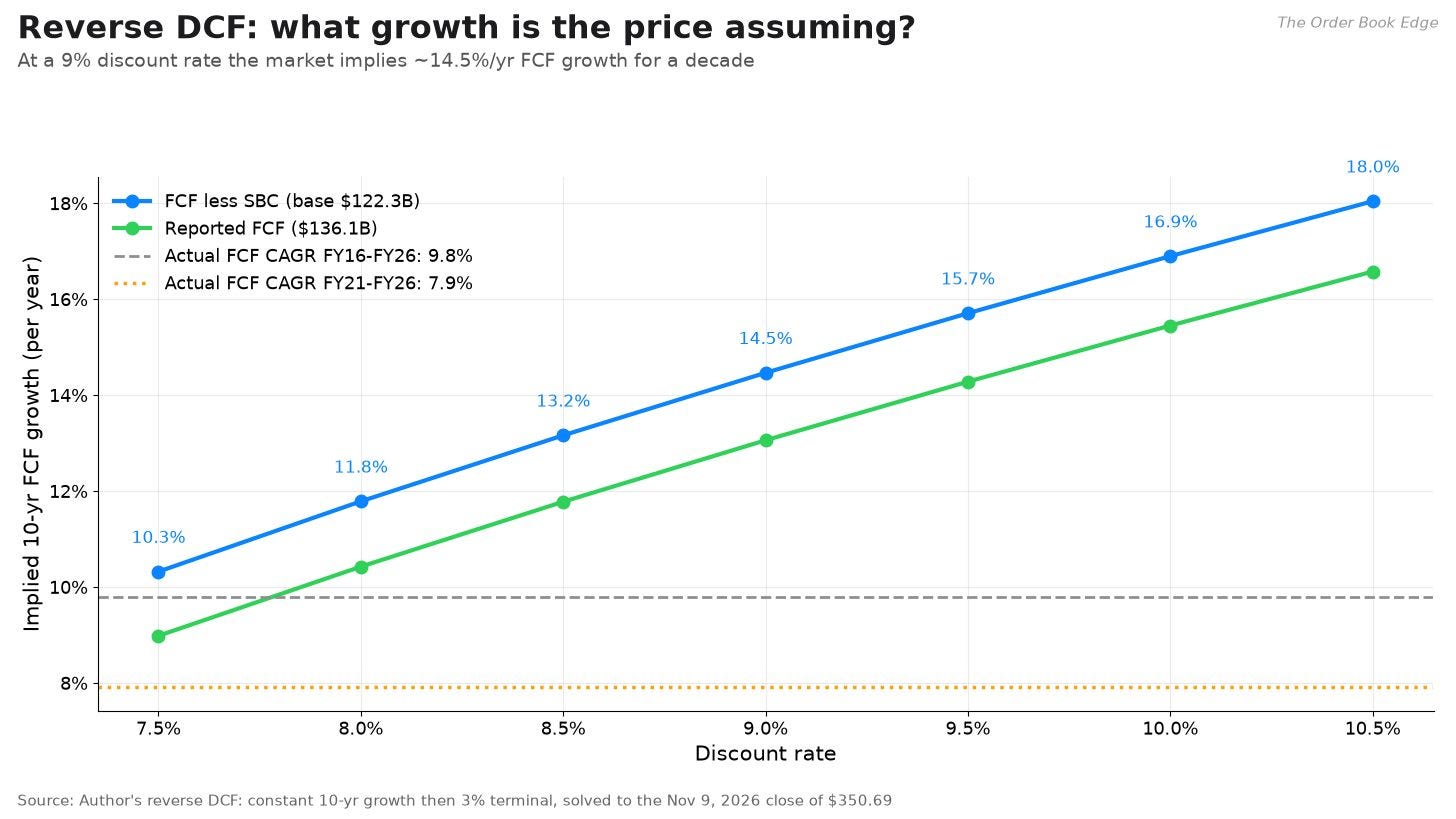
A reverse DCF flips the question. Instead of estimating value from growth, it solves for the growth rate that makes the model equal today’s price. I used a simple version: one constant growth rate for ten years, then 3% forever, starting from the $122.3 billion base.
The implied ten-year annual free cash flow growth rate is:
10.3% at a 7.5% discount rate
11.8% at 8.0%
13.2% at 8.5%
14.5% at 9.0%
15.7% at 9.5%
16.9% at 10.0%
Starting from reported free cash flow ($136.1 billion, no SBC deduction), the implied growth at a 9% discount rate is 13.1%. If you assume a five-year burst then a fade (the same shape as the base DCF), the price implies about 18.7% a year for the first five years.
Compare that with history. Free cash flow grew 9.8% a year over the past ten years and 7.9% a year over the past five. The price therefore assumes Apple’s cash generation grows about 1.5 times faster over the next decade than it did over the last, from a base that is now more than $120 billion a year. That can happen if a new product category or an AI-driven Services layer takes off. But it is a high bar, and it is the single most important number in this article.
The DCF and reverse DCF in pseudocode
Formulas, in LaTeX-style notation:
FCF_t = FCF_0 \prod_{k=1}^{t} (1 + g_k)
g_k = g_1                                   for k <= 5
g_k = g_1 + (g_T - g_1)(k - 5)/5             for 5 < k <= 10
PV = \sum_{t=1}^{10} FCF_t / (1 + r)^t
TV_{10} = FCF_{10} (1 + g_T) / (r - g_T)
Value per share = (PV + TV_{10}/(1 + r)^{10} + NetCash) / Shares
Reverse DCF: find g such that Value(g) = Price
function DCF(fcf0, g1, r, gT, netCash, shares, highYears = 5, years = 10):
    pv = 0
    fcf = fcf0
    for t in 1..years:
        if t <= highYears:
            g = g1
        else:
            g = g1 + (gT - g1) * (t - highYears) / (years - highYears)
        fcf = fcf * (1 + g)
        pv = pv + fcf / (1 + r)^t
    terminal = fcf * (1 + gT) / (r - gT)        # requires r > gT
    pv = pv + terminal / (1 + r)^years
    return (pv + netCash) / shares

function REVERSE_DCF(price, fcf0, r, gT, netCash, shares):
    # constant growth for all 10 years, then gT
    f(g) = DCF(fcf0, g, r, gT, netCash, shares, highYears = 10) - price
    return ROOT_FIND(f, low = -0.20, high = 0.60)   # bisection or Brent's method

grid = for r in [7.5%, 8.0%, ..., 10.5%]:
           for gT in [2.0%, 2.5%, ..., 4.0%]:
               DCF(122.3e9, 0.09, r, gT, 56.8e9, 14.532e9)
Fundamental takeaways
The business has rarely been stronger: record revenue, margins and cash flow, a dominant installed base Apple says is now over 2.5 billion active devices, and a fortress balance sheet.
The near-term earnings path has a visible headwind. Gross margin is guided down about 2 to 3 points from the September quarter, operating expenses are rising more than 20% a year, and fiscal 2026 had one-time tariff-refund help.
The valuation already assumes years of strong growth. At 39 times trailing earnings and a 2.7% free cash flow yield, the stock is priced for something close to the best decade of its history.
Part 2: Quantitative analysis
Fundamentals tell you what you own. Quant tells you what owning it feels like: how far it swings, how it moves with everything else, and how bad the bad days get. All statistics below use daily total returns through November 9, 2026.
Returns and volatility
The building blocks are simple. A daily simple return is today’s adjusted close divided by yesterday’s, minus one. A log return is the natural log of that ratio. Log returns add up over time, which makes them convenient for modeling. Annualized volatility is the standard deviation of daily returns times the square root of 252, the approximate number of trading days in a year.
r_t = P_t / P_{t-1} - 1                 (simple return)
\ell_t = \ln(P_t / P_{t-1})             (log return)
\sigma_{ann} = \sigma_{daily} \sqrt{252}
CAGR = (P_end / P_start)^{1/years} - 1
function RETURNS_AND_VOL(adjClose[], window = 252):
    r[t]  = adjClose[t] / adjClose[t-1] - 1          for t = 1..N-1
    lr[t] = ln(adjClose[t] / adjClose[t-1])
    volAnn = stdev(r) * sqrt(252)
    rollingVol[t] = stdev(r[t-window+1 .. t]) * sqrt(252)
    cagr = (adjClose[N-1] / adjClose[0]) ^ (1 / years) - 1
    return r, lr, volAnn, rollingVol, cagr
Here is how AAPL compares with SPY and QQQ across four windows ending November 9, 2026. Each line gives compound annual total return, annualized volatility and Sharpe ratio (explained below):
1 year: AAPL 31.1% return, 24.9% volatility, Sharpe 1.06. SPY 13.4%, 13.7%, 0.71. QQQ 11.9%, 21.5%, 0.46.
3 years: AAPL 24.9%, 27.0%, 0.80. SPY 21.6%, 15.5%, 1.06. QQQ 23.1%, 21.0%, 0.89.
5 years: AAPL 18.9%, 28.2%, 0.62. SPY 11.5%, 17.3%, 0.49. QQQ 12.1%, 23.3%, 0.44.
10 years: AAPL 30.0%, 29.2%, 0.96. SPY 15.1%, 18.0%, 0.73. QQQ 20.0%, 22.8%, 0.80.
Two things stand out. First, Apple is consistently more volatile than either index, running about 1.6 times SPY’s volatility over ten years. Second, its risk-adjusted performance beat both benchmarks over one, five and ten years, but lagged them over three years. The three-year window includes the 33% drawdown from December 2024 to April 2025, when the stock fell harder than the market.
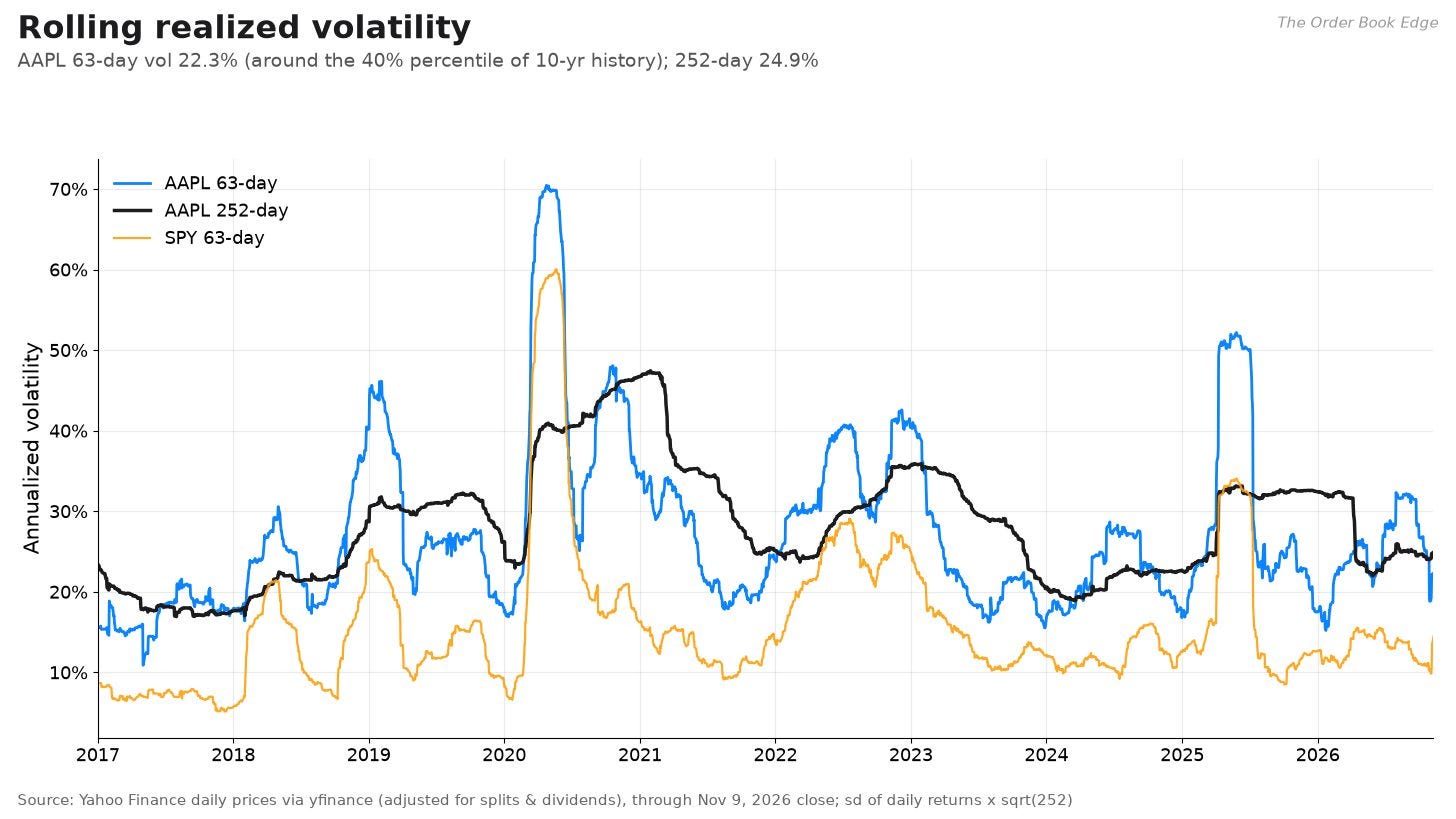
Volatility is not constant. Apple’s 63-day (roughly three-month) realized volatility has ranged from 10.9% to 70.5% over the past ten years, peaking on April 24, 2020. Today it is 22.3%, around the 40th percentile of its 10-year history: calm, but not unusually so. The 21-day reading is 26.5%, a little higher, reflecting the post-earnings swings. The 252-day reading is 24.9%. Volatility clusters: high-volatility periods tend to follow high-volatility periods. That is why the rolling chart looks like a series of spikes rather than a flat line, and it is why the bootstrap simulation later in this article samples returns in blocks.
The shape of the distribution
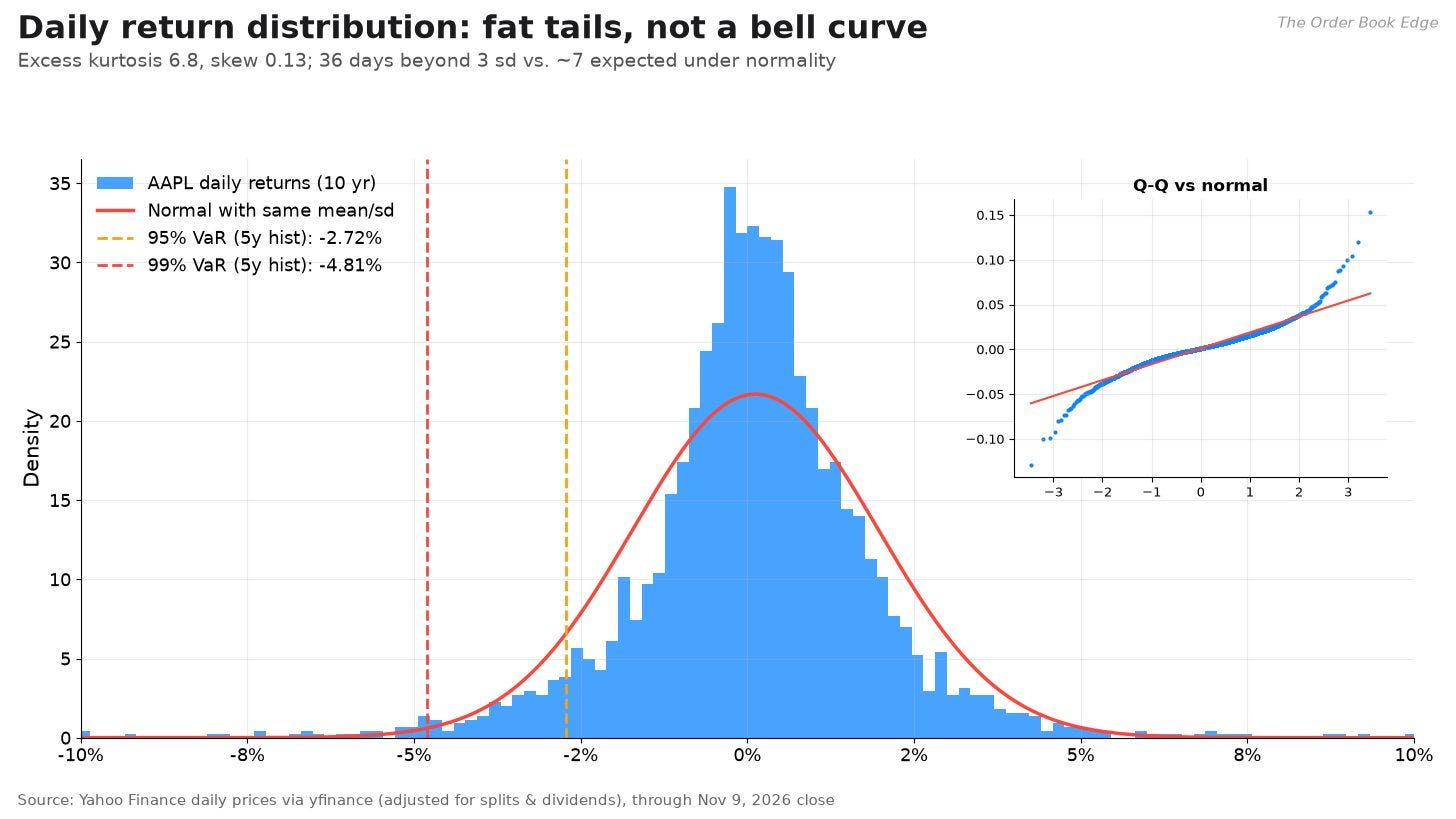
Over the past ten years (2,512 trading days), Apple’s average daily return was 0.12% with a standard deviation of 1.84%. It rose on 53.7% of days. The best day was +15.3% on April 9, 2025, the day the US paused most of its new tariffs. The worst was -12.9% on March 16, 2020.
The distribution is not normal. Excess kurtosis is 6.8, where a normal distribution would show zero. Skewness is a slightly positive 0.13. The Jarque-Bera test statistic, which measures departure from normality, is about 4,786, far beyond any conventional threshold. In practical terms: 36 days moved more than three standard deviations from the mean. A normal distribution would predict about 7.
The quantile-quantile plot in the chart makes this visible. If returns were normal, the dots would sit on the red line. Instead they curl away at both ends. Big moves happen several times more often than a bell curve says. Any risk model that assumes normality will understate tail risk for this stock, and the VaR section below quantifies by how much.
Beta and correlation
Beta measures how much a stock tends to move when the market moves. A beta of 1.2 means that, on average, a 1% move in the benchmark has come with a 1.2% move in the stock. It is estimated with an ordinary least squares regression of the stock’s excess return (return minus the risk-free rate) on the benchmark’s excess return. The intercept of that regression, alpha, is the average return not explained by the benchmark.
r_{i,t} - r_{f,t} = \alpha + \beta (r_{m,t} - r_{f,t}) + \epsilon_t
\beta = Cov(r_i, r_m) / Var(r_m)
R^2 = 1 - SS_{resid} / SS_{total}
function BETA_REGRESSION(stockRet[], mktRet[], rf[]):
    y = stockRet - rf
    x = mktRet - rf
    X = [ones(len(x)), x]                       # add intercept column
    (alpha, beta) = solve_least_squares(X, y)   # (X'X)^-1 X'y
    resid = y - (alpha + beta * x)
    r2 = 1 - sum(resid^2) / sum((y - mean(y))^2)
    alphaAnn = alpha * 252
    return alpha, alphaAnn, beta, r2

function ROLLING_BETA(stockRet[], mktRet[], window = 252):
    for t in window..N-1:
        s = stockRet[t-window+1 .. t]
        m = mktRet[t-window+1 .. t]
        beta[t] = covariance(s, m) / variance(m)
    return beta
Apple’s beta against SPY, with the R-squared (share of daily variance explained by the market) in parentheses:
10 years: 1.20 (R-squared 0.54)
5 years: 1.15 (0.50)
3 years: 1.03 (0.35)
1 year: 0.60 (0.11)
Against QQQ, the betas are 0.98, 0.83, 0.68 and 0.24 over the same windows. The one-year correlation with SPY is just 0.33, compared with 0.74 over ten years.
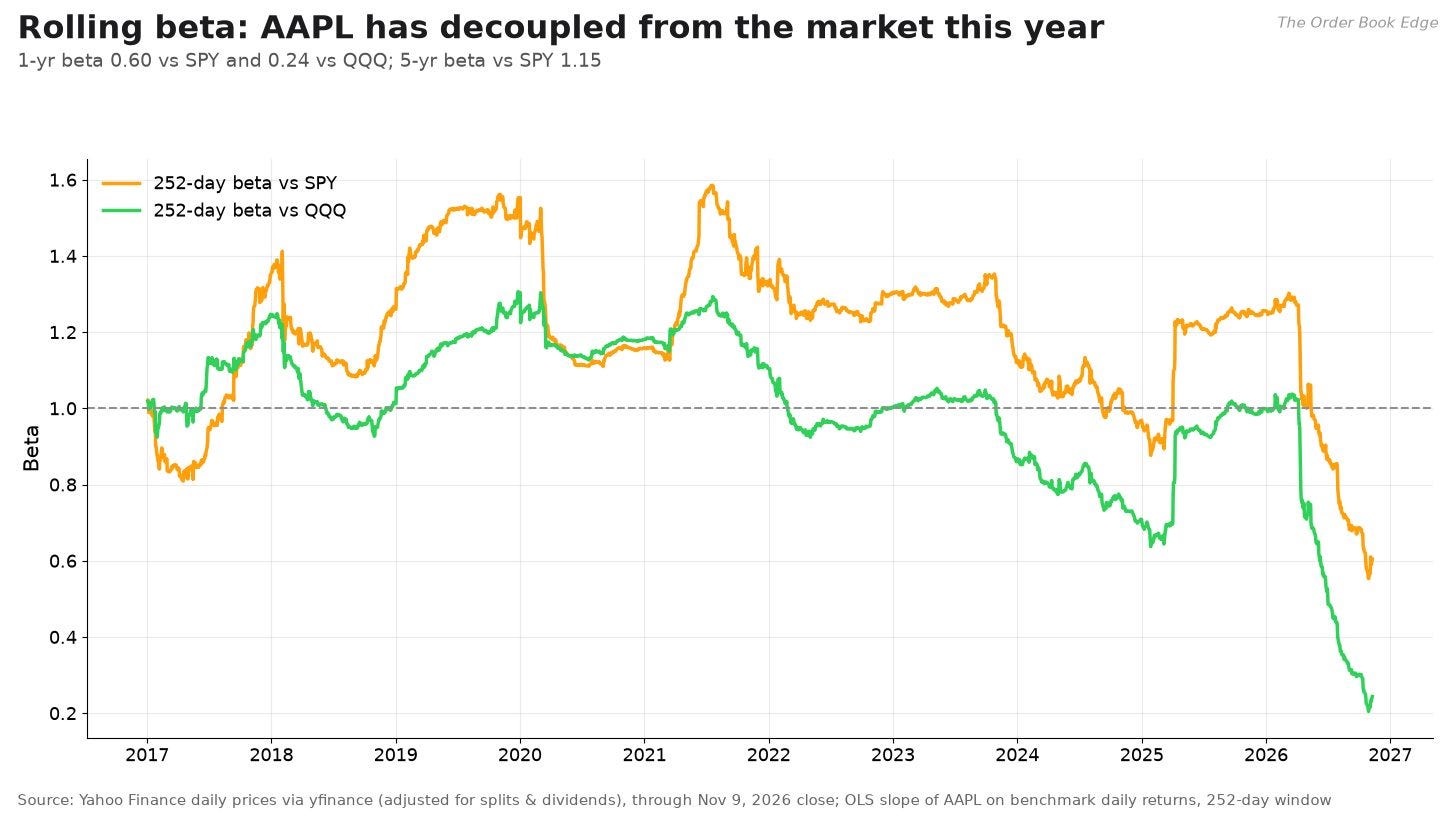
The rolling 252-day beta against SPY ranged from 0.55 to 1.59 over the past ten years, and today’s 0.60 is near the bottom of that range. Against QQQ the one-year beta is 0.24, which is extraordinary for a stock that is one of QQQ’s largest holdings.
What happened? The regression cannot say, but the pattern is consistent with Apple trading on its own news over the past year (tariff refunds, the iPhone cycle, legal rulings, earnings) while the indexes moved on other drivers. The one-month numbers illustrate it: QQQ fell 9.6% while Apple rose 4.2%. When a stock’s moves are mostly idiosyncratic, its beta falls even if it is still a large index weight. Two warnings apply. First, one year of data gives a noisy beta estimate. The R-squared of 0.11 means the market explained only 11% of Apple’s daily variance. Second, low beta regimes tend not to last. Correlations across large-cap stocks tend to rise sharply in sell-offs, which is exactly when a diversification benefit would matter.
Alpha deserves the same caution. The annualized CAPM alpha against SPY was about 7.7% over five years, with a t-statistic of 0.86. Over ten years it was 12.3% with a t-statistic of 1.96, right on the edge of conventional significance. Even a decade of daily data cannot cleanly separate skill-like outperformance from luck when volatility is near 30%.
Factor exposures: Fama-French five factors plus momentum
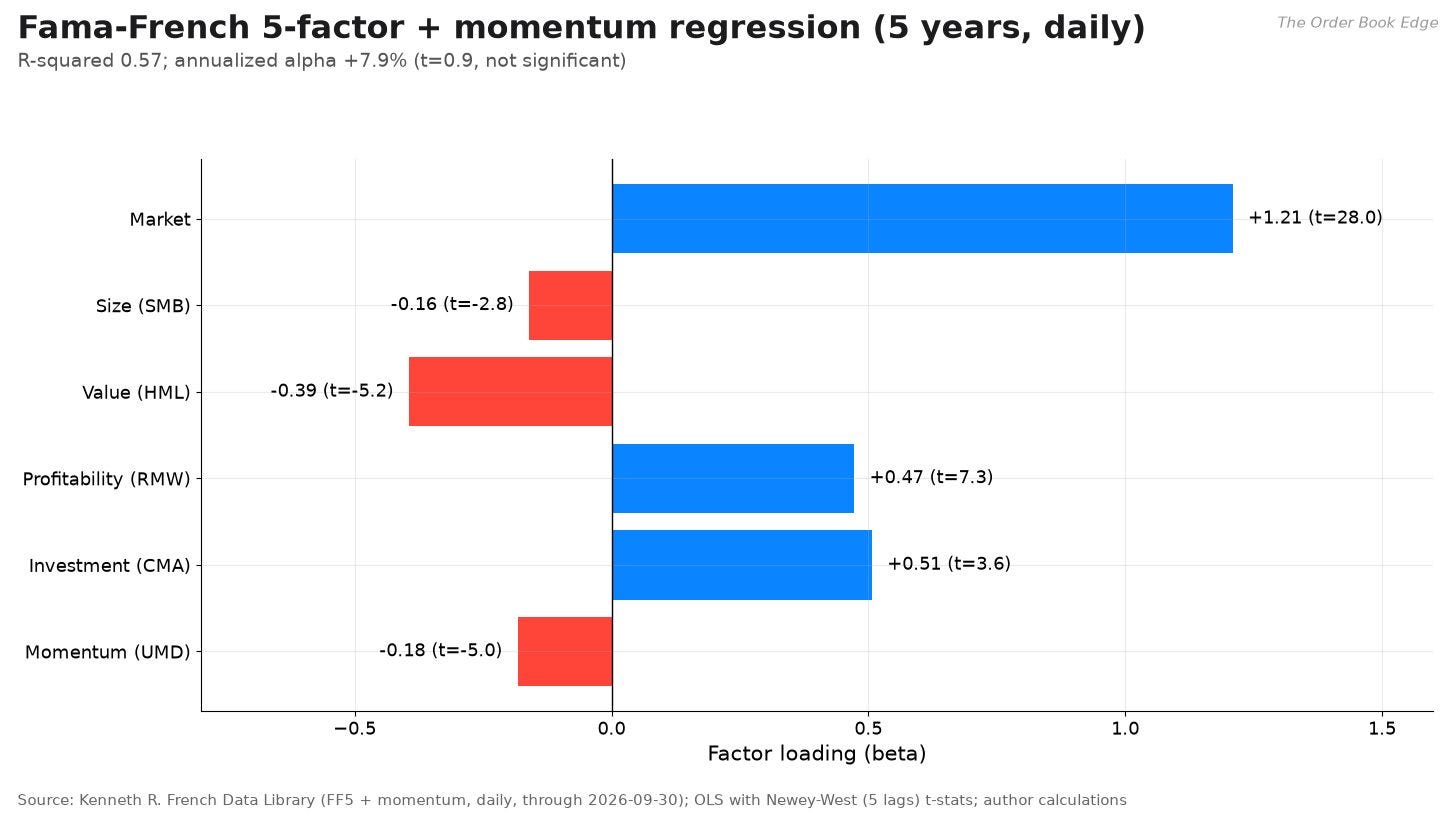
A single market beta hides a lot. The Fama-French five-factor model adds four characteristics that explain returns across stocks: size (SMB, small minus big), value (HML, high book-to-market minus low), profitability (RMW, robust minus weak) and investment (CMA, conservative minus aggressive asset growth). I added Carhart momentum (UMD, up minus down). The regression uses daily data from October 1, 2021 to September 30, 2026, the latest month in Ken French’s library, with Newey-West standard errors (five lags) to account for autocorrelation and changing volatility.
r_{i,t} - r_{f,t} = \alpha + \beta_{M} MKT_t + s SMB_t + h HML_t + r RMW_t + c CMA_t + m UMD_t + \epsilon_t
function FACTOR_REGRESSION(stockRet[], factors[][], rf[]):
    y = stockRet - rf
    X = [ones, MKT_RF, SMB, HML, RMW, CMA, UMD]   # aligned by date
    coef = solve_least_squares(X, y)
    resid = y - X * coef
    se = NEWEY_WEST_STDERR(X, resid, lags = 5)    # robust to autocorrelation
    t = coef / se
    return coef, t, r2(y, resid)
The results:
Market: 1.21 (t-statistic 28.0). Once the other factors are controlled for, Apple’s market sensitivity rises.
Size (SMB): -0.16 (t = -2.8). Apple behaves like the mega-cap stock it is.
Value (HML): -0.39 (t = -5.2). A strong growth tilt.
Profitability (RMW): +0.47 (t = 7.3). Apple trades like a high-quality, highly profitable company, which it is.
Investment (CMA): +0.51 (t = 3.6). Apple trades with companies that grow their asset base conservatively, consistent with a business that returns most of its cash rather than reinvesting it.
Momentum (UMD): -0.18 (t = -5.0). Over this window Apple tended to lag when momentum stocks led.
R-squared: 0.57. Alpha: +7.9% a year, t = 0.9, not statistically significant.
The factor profile is the quant version of the fundamental story: a growth-priced, very profitable, capital-light compounder. The positive profitability and investment loadings partly offset the negative value loading. That mix is part of why Apple has held up during periods when speculative growth stocks were hit. The negative momentum loading is unusual given the stock’s strong recent run, and it reflects the stretches over this five-year window when Apple lagged the market’s leaders.
Sharpe and Sortino ratios
The Sharpe ratio is average excess return divided by volatility. The Sortino ratio uses only downside volatility in the denominator, so it does not penalize a stock for big up days. I use the 3-month Treasury bill yield from FRED as the risk-free rate.
Sharpe = \frac{E[r - r_f]}{\sigma(r)} \sqrt{252}
Sortino = \frac{E[r - r_f] \times 252}{\sqrt{E[\min(r - r_f, 0)^2]} \sqrt{252}}
function SHARPE_SORTINO(r[], rfDaily[]):
    ex = r - rfDaily
    sharpe = mean(ex) / stdev(r) * sqrt(252)
    downside = [min(e, 0) for e in ex]
    downDev = sqrt(mean(downside^2)) * sqrt(252)
    sortino = mean(ex) * 252 / downDev
    return sharpe, sortino
Apple’s Sortino ratio was 1.55 over one year, 1.19 over three years, 0.91 over five years and 1.42 over ten years. SPY’s were 0.99, 1.55, 0.69 and 1.02. QQQ’s were 0.63, 1.28, 0.62 and 1.14. The pattern matches the Sharpe ratios: Apple has delivered better risk-adjusted returns than the indexes over most windows, but not every one, and the past year was unusually good.
Drawdowns
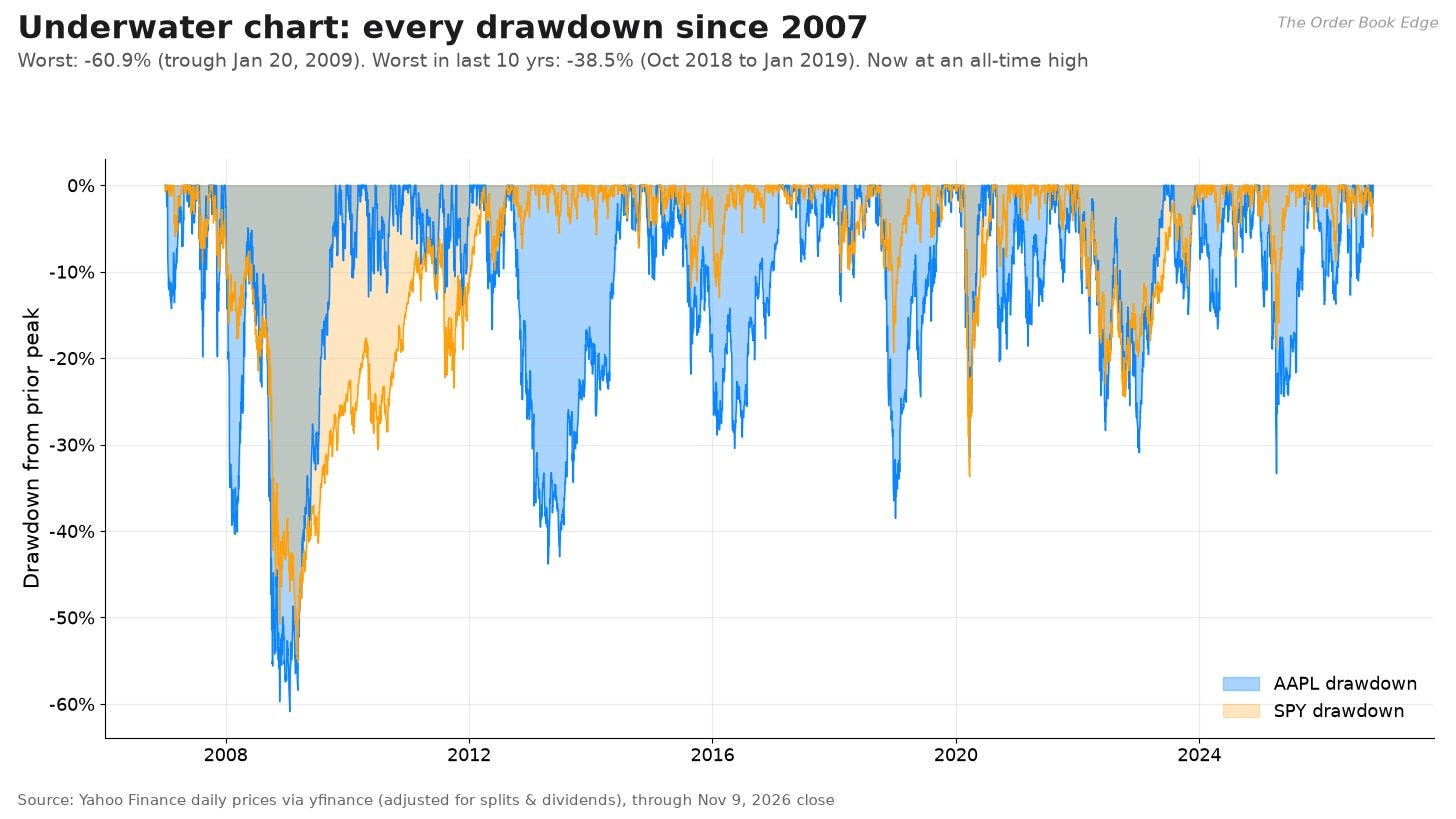
A drawdown is the percentage decline from the highest prior value. Maximum drawdown is the worst such decline over a period. It is the statistic that best captures what holding a stock feels like during a bad stretch.
DD_t = \frac{P_t}{\max_{s \le t} P_s} - 1
MDD = \min_t DD_t
function DRAWDOWNS(adjClose[]):
    peak = adjClose[0]
    for t in 0..N-1:
        peak = max(peak, adjClose[t])
        dd[t] = adjClose[t] / peak - 1
    mdd = min(dd)
    # episodes: start when dd leaves 0, trough at min, end when dd returns to 0
    return dd, mdd, EPISODES(dd)
The worst drawdown in the data, which starts in 2005, was -60.9%, bottoming on January 20, 2009. Since 2015 Apple has had five drawdowns of more than 30%:
-38.5%: peak October 4, 2018, trough January 3, 2019, recovered October 10, 2019. The trough came the day after Apple cut its revenue guidance, citing China.
-33.4%: peak December 27, 2024, trough April 8, 2025, recovered October 20, 2025. This was the tariff shock.
-31.4%: peak February 13, 2020, trough March 23, 2020, recovered June 5, 2020. The Covid crash.
-30.9%: peak January 4, 2022, trough January 5, 2023, recovered June 2, 2023. The rate shock.
-30.4%: peak May 26, 2015, trough May 12, 2016, recovered February 1, 2017. The iPhone 6 cycle hangover.
That is five drawdowns of 30% or more in about eleven years, roughly one every two years. Getting from the trough back to a new high took anywhere from about two and a half months (2020) to about nine months (2016 to 2017, and again in 2019). Measured from the original peak, the 2015 episode lasted more than twenty months. Over the past year the maximum drawdown was 13.8%. Today the stock is at an all-time high, so the current drawdown is zero. Anyone buying Apple should expect to sit through a 30% decline at some point. History says it is not a question of whether.
Value at Risk and Expected Shortfall
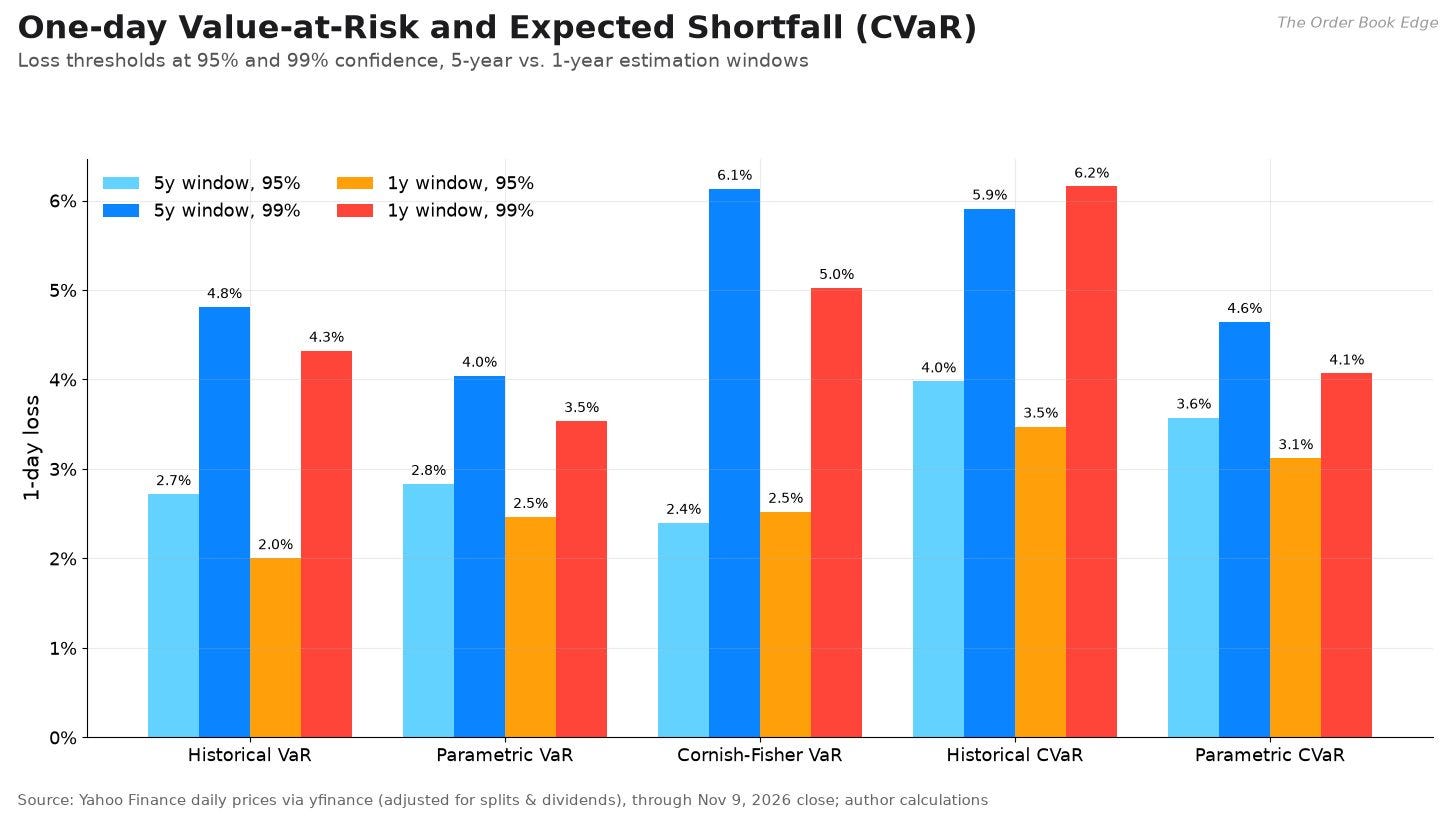
Value at Risk (VaR) answers: on a bad day, how much might I lose? A one-day 95% VaR of 2.7% means that on 95% of days the loss should be smaller than 2.7%. Conditional VaR (CVaR, also called Expected Shortfall) answers the next question: when you do land in that worst 5%, how bad is the average day?
There are several ways to estimate them:
Historical: take the actual 5th (or 1st) percentile of past returns. No distribution is assumed.
Parametric (normal): assume returns are normal and use the mean and standard deviation.
Cornish-Fisher: adjust the normal quantile for the skewness and kurtosis actually observed.
VaR_{\alpha}^{hist} = Quantile(r, 1 - \alpha)
CVaR_{\alpha}^{hist} = E[r \mid r \le VaR_{\alpha}]
VaR_{\alpha}^{norm} = \mu + z_{1-\alpha} \sigma
CVaR_{\alpha}^{norm} = \mu - \sigma \phi(z_{1-\alpha}) / (1 - \alpha)
z_{CF} = z + (z^2 - 1)S/6 + (z^3 - 3z)K/24 - (2z^3 - 5z)S^2/36
function VAR_CVAR(r[], conf = 0.95):
    # historical
    hVaR  = quantile(r, 1 - conf)
    hCVaR = mean([x for x in r if x <= hVaR])
    # parametric normal
    mu = mean(r); sd = stdev(r); z = normal_inverse_cdf(1 - conf)
    pVaR  = mu + z * sd
    pCVaR = mu - sd * normal_pdf(z) / (1 - conf)
    # Cornish-Fisher (S = skew, K = excess kurtosis)
    S = skew(r); K = excess_kurtosis(r)
    zcf = z + (z^2 - 1)*S/6 + (z^3 - 3*z)*K/24 - (2*z^3 - 5*z)*S^2/36
    cfVaR = mu + zcf * sd
    return hVaR, hCVaR, pVaR, pCVaR, cfVaR
Results for one-day losses, estimated on five years of data:
95% confidence: historical VaR 2.72%, normal VaR 2.83%, Cornish-Fisher VaR 2.40%. Historical CVaR 3.98%, normal CVaR 3.57%.
99% confidence: historical VaR 4.81%, normal VaR 4.04%, Cornish-Fisher VaR 6.13%. Historical CVaR 5.91%, normal CVaR 4.64%.
And on one year of data:
95%: historical VaR 2.00%, normal VaR 2.46%. Historical CVaR 3.47%.
99%: historical VaR 4.32%, normal VaR 3.54%. Historical CVaR 6.16%.
At the 95% level, the methods roughly agree. At 99%, the normal model understates the risk: its 99% CVaR of 4.64% compares with 5.91% in the actual five-year data. In the one-year data the gap is wider, 4.07% for the normal model against 6.16% historically, because a handful of very large days dominate the tail. On a $350.69 share, a 99% historical one-day VaR from the five-year window is about $16.90. On a $100,000 position it is about $4,800, and the average loss on the worst 1% of days is about $5,900.
A note on scaling: people often multiply one-day VaR by the square root of the number of days to get a multi-day figure. That only works if returns are independent and identically distributed, which the volatility clustering above says they are not. The Monte Carlo section handles multi-day risk more honestly.
Monte Carlo: one-year price cones
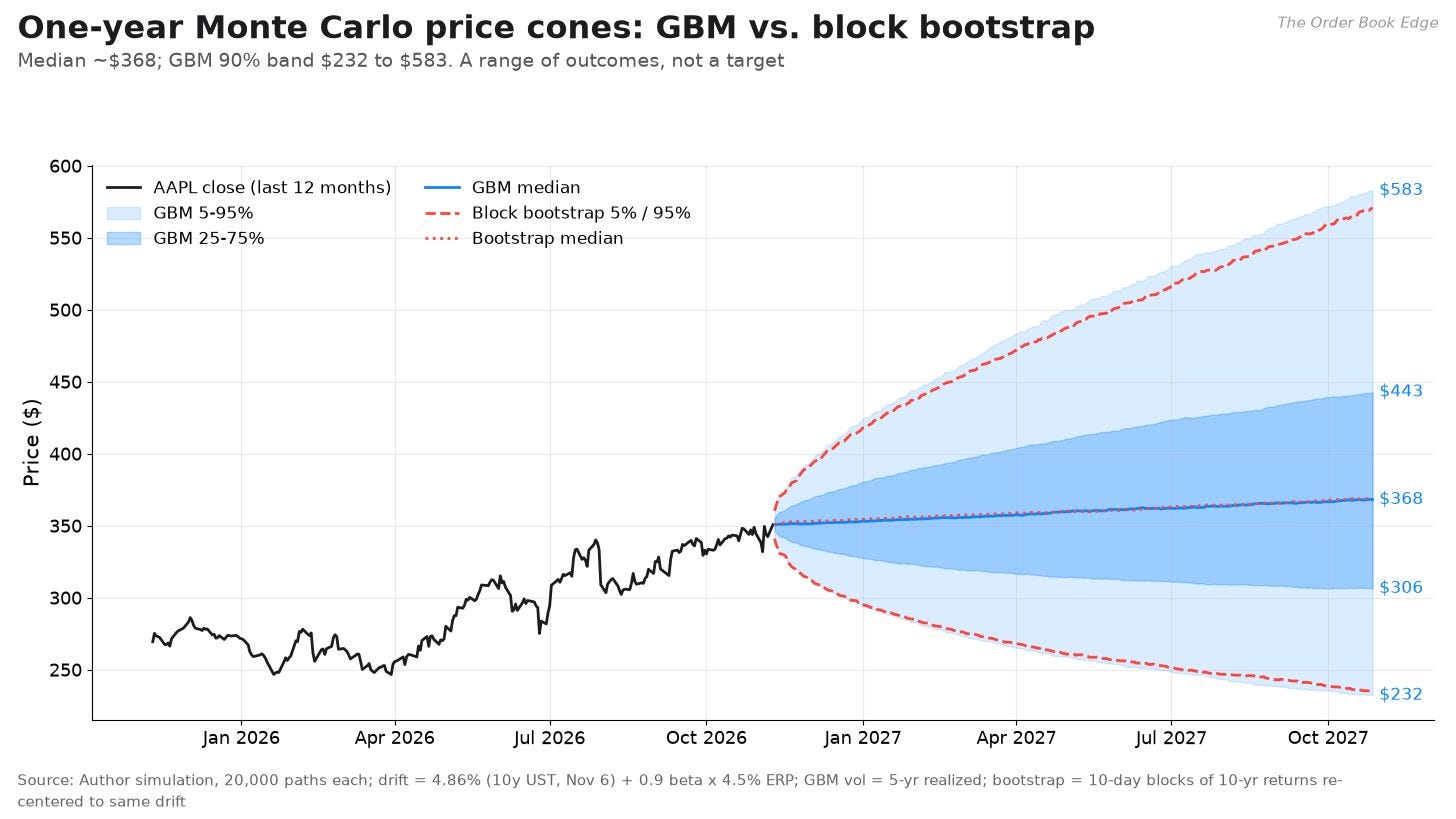
Monte Carlo simulation generates thousands of possible price paths and reads off the distribution of outcomes. I ran two versions, each with 20,000 one-year (252-day) paths starting from $350.69.
Geometric Brownian motion (GBM) is the textbook model behind Black-Scholes. Each day’s log return is drawn from a normal distribution. It is clean, but it has thin tails and constant volatility.
Block bootstrap resamples actual Apple daily log returns from the past ten years, drawn in consecutive 10-day blocks. Sampling blocks rather than single days keeps some of the real data’s volatility clustering and fat tails. I re-centered the historical returns so that both models share the same expected drift. That way the difference between them comes only from the shape of returns, not from assuming Apple repeats its 30% a year decade.
Assumptions (author’s): expected annual return (drift) of 8.91%, equal to the 4.86% 10-year Treasury yield plus 0.9 beta times a 4.5% equity risk premium. Volatility for GBM is the five-year realized log-return volatility of 28.1%.
S_{t+\Delta t} = S_t \exp\left[(\mu - \tfrac{1}{2}\sigma^2)\Delta t + \sigma \sqrt{\Delta t}\, Z\right],\quad Z \sim N(0,1)
Bootstrap: \ell^*_{t} = \ell_{b(t)} - \bar{\ell} + (\mu - \tfrac{1}{2}\sigma^2)/252
function MONTE_CARLO_GBM(S0, mu, sigma, days = 252, paths = 20000):
    dt = 1 / 252
    for p in 1..paths:
        S = S0
        for d in 1..days:
            Z = random_normal(0, 1)
            S = S * exp((mu - 0.5*sigma^2)*dt + sigma*sqrt(dt)*Z)
            path[p][d] = S
    return percentiles(path[:, days], [5, 25, 50, 75, 95])

function MONTE_CARLO_BLOCK_BOOTSTRAP(S0, logRets[], mu, days = 252, paths = 20000, block = 10):
    centered = logRets - mean(logRets) + (mu - 0.5*var(logRets)*252) / 252
    for p in 1..paths:
        seq = []
        while len(seq) < days:
            start = random_int(0, len(centered) - block)
            seq.append(centered[start .. start + block - 1])
        path[p] = S0 * exp(cumulative_sum(seq[0 .. days-1]))
    return percentiles(path[:, days], [5, 25, 50, 75, 95])
One-year results:
GBM: 5th percentile $232, 25th $306, median $368, 75th $443, 95th $583.
Block bootstrap: 5th percentile $234, 25th $308, median $369, 75th $442, 95th $571.
Chance of finishing below today’s price: 42.5% (GBM), 42.3% (bootstrap).
Chance of finishing below $300: 22.8% and 22.2%.
Chance of finishing above $400: 38.2% and 38.3%.
Chance of a drawdown of 20% or more at some point during the year: 70.8% and 67.9%.
The headline is how wide the cone is. With volatility near 28%, the middle half of outcomes spans more than $130, and the 90% band runs from about $230 to about $580. The two models agree closely at one year. The bootstrap cone is wider in the first few weeks, because real returns come in volatile bursts, and slightly narrower at the top end after a year.
The drawdown figure is the one to remember. Even with a positive expected return, a stock with Apple’s volatility will usually fall 20% from a high at some point within a year. That matches history: in four of the past eight calendar years Apple suffered an intra-year decline of 30% or more from a prior peak. None of this tells you the direction. It tells you how much room to give a position and why sizing matters more than conviction.
Momentum and mean reversion
Does Apple trend or snap back? Several simple tests, all on ten years of daily data unless noted:
Daily autocorrelation: -0.061 at lag 1, +0.018 at lag 2, +0.012 at lag 5. A small negative lag-1 value means up days are slightly more likely to be followed by down days, and the reverse. This is a very short-term reversal effect, too small to trade after costs for most investors.
Weekly autocorrelation: -0.052. Monthly autocorrelation: +0.083.
Variance ratios: 0.90 at 5 days, 0.88 at 21 days and 0.84 at 63 days. A variance ratio below 1 means multi-day returns are less volatile than daily volatility would imply, a sign of mild mean reversion.
12-1 momentum (return over the past 12 months excluding the most recent month): currently +25.2%, firmly positive. Since 2006, in the 202 months when Apple’s own 12-1 momentum was positive, the next month averaged +2.0%. In the 48 months when it was negative, the next month averaged +4.0%. In other words, Apple’s own past trend has not helped predict its next month. The “buy the dip” pattern has worked better, though 48 months is a small sample.
RSI extremes: when the 14-day RSI was below 30 (50 days in ten years), the next 20 trading days averaged +2.9% and were positive 66% of the time. When it was above 70 (338 days), the next 20 days averaged +2.1%, positive 68% of the time. The unconditional average was +2.4%, positive 66% of the time. Overbought readings have not been a reliable sell signal for Apple, and oversold readings have only slightly improved forward returns.
\rho_k = Corr(r_t, r_{t-k})
VR(q) = \frac{Var(\sum_{i=1}^{q} r_{t-i+1})}{q \cdot Var(r_t)}
MOM_{12-1} = P_{t-21} / P_{t-252} - 1
function MOMENTUM_TESTS(lr[], price[]):
    for k in [1, 2, 5]: ac[k] = correlation(lr[k..], lr[..N-k])
    for q in [5, 21, 63]:
        rq = rolling_sum(lr, q)
        vr[q] = variance(rq) / (q * variance(lr))
    mom121[t] = price[t-21] / price[t-252] - 1
    # conditional forward returns
    fwd20[t] = price[t+20] / price[t] - 1
    avg_when_oversold = mean(fwd20[t] for t where RSI[t] < 30)
    avg_when_overbought = mean(fwd20[t] for t where RSI[t] > 70)
    return ac, vr, mom121, avg_when_oversold, avg_when_overbought
The overall picture: mild mean reversion at short horizons, no reliable time-series momentum in Apple by itself, and overbought conditions that tend to persist rather than reverse. That is typical of a heavily traded mega-cap, where obvious patterns get competed away.
Seasonality
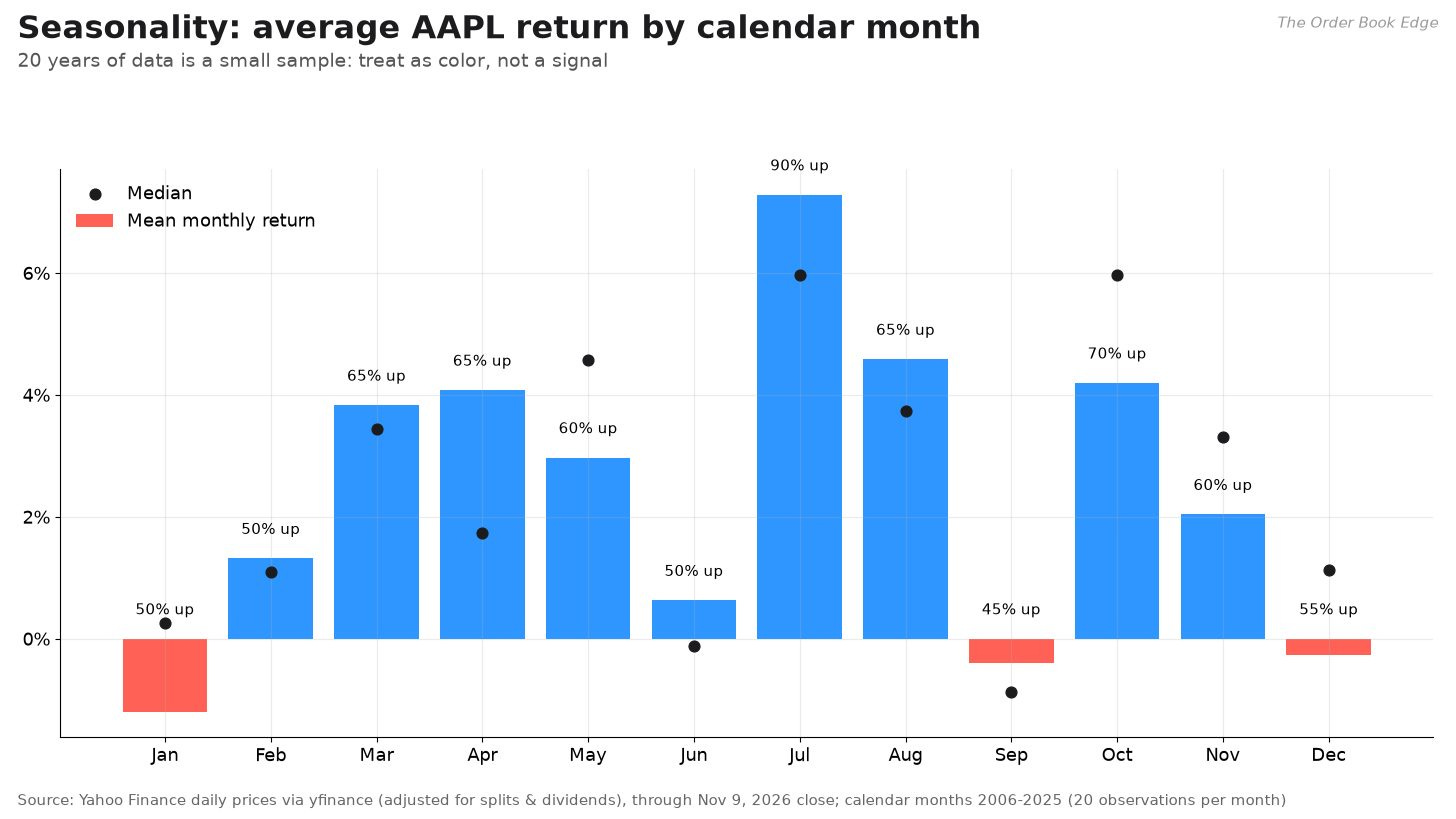
Calendar patterns are the weakest evidence in this article, and the chart says so. With only 20 observations per month (2006 through 2025), a couple of extreme years can dominate. Still, the data:
July has been Apple’s best month: an average return of +7.3%, positive in 18 of 20 years (90%).
August (+4.6%), October (+4.2%), April (+4.1%) and March (+3.8%) have also been strong.
September has been the weakest: -0.4% on average, positive only 45% of the time, even though it is iPhone launch month.
January has averaged -1.2%, though its median is slightly positive.
November, the month we are in, has averaged +2.0% (median +3.3%), positive 60% of the time, and roughly in line with SPY on average.
December has averaged -0.3% (median +1.1%), positive 55% of the time.
Treat this as color, not a signal. The July effect lines up with the run-up into the fiscal third-quarter report, but a pattern found by looking at 12 months is likely to contain at least one false positive by chance.
Earnings-day reactions
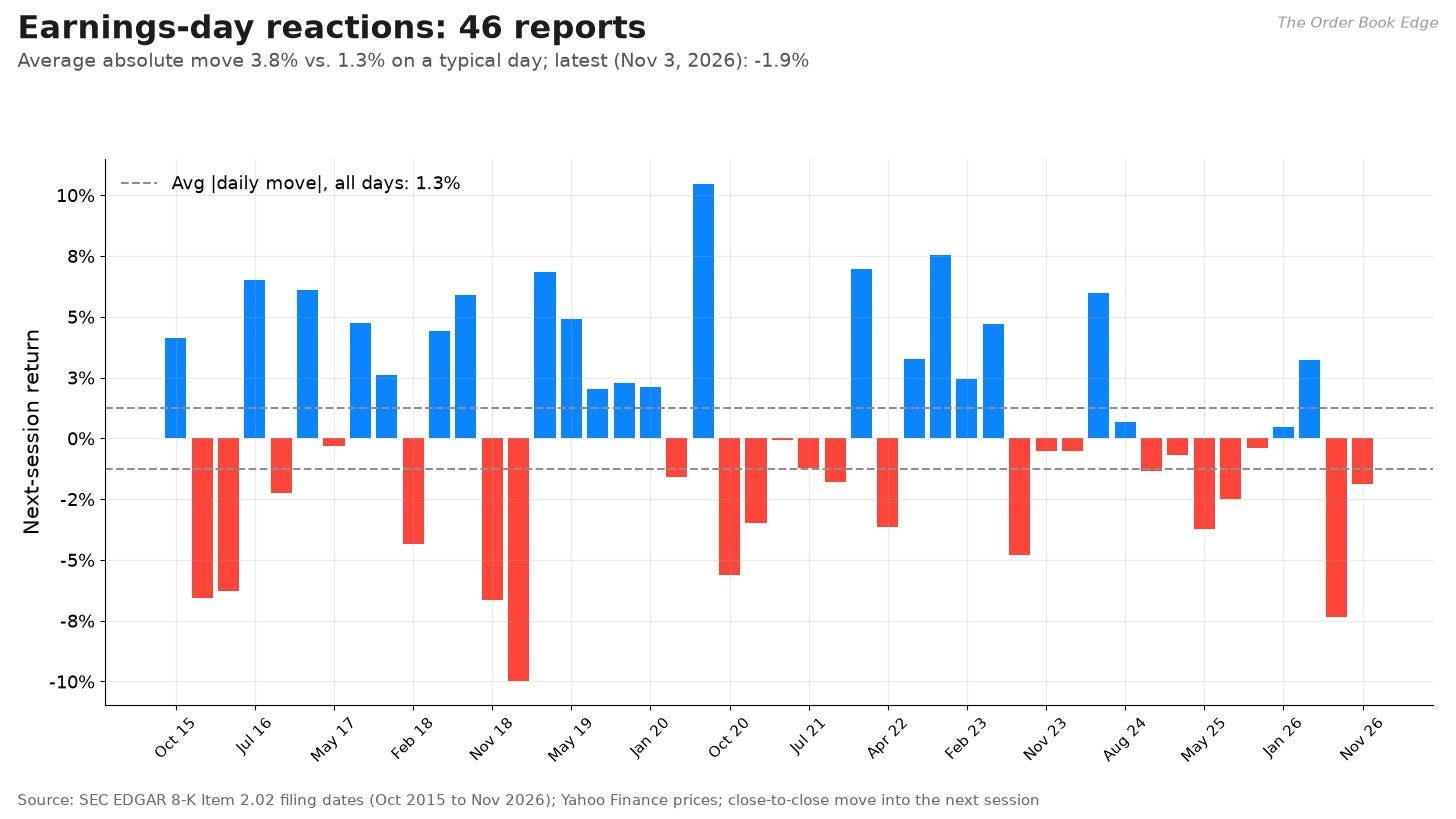
I identified 46 earnings reports from October 2015 to November 2026 using Apple’s 8-K filings under Item 2.02 (”Results of Operations”). Apple reports after the market close, so the reaction is measured from the close on the filing date to the close of the next session. One entry, January 2, 2019, was the mid-quarter revenue warning rather than a regular report, and it is included because it was filed under the same item.
Average absolute move: 3.8% (median 3.6%), about three times the 1.3% average absolute move on all trading days since October 2015.
Direction: up 48% of the time, with an average move of +0.45%. There is no consistent post-earnings drift either way.
Largest gain: +10.5% on July 31, 2020.
Largest loss: -10.0% on January 3, 2019, after the guidance cut.
Recent moves are smaller: the average absolute move over the last eight reports was 2.5%.
Latest: -1.9% on November 3, 2026, while SPY rose 0.3%. Five sessions later the stock was up 3.7% from the pre-report close.
function EARNINGS_REACTIONS(reportDates[], adjClose[]):
    for d in reportDates:                 # 8-K Item 2.02 filing dates, after close
        t0 = index_of_session(d)
        ret[d] = adjClose[t0 + 1] / adjClose[t0] - 1
    return mean(abs(ret)), median(abs(ret)), share_positive(ret)
For options traders, the comparison that matters is the implied move priced before each report versus this realized history. That data is not public in a free, verifiable form, so I have left it out. For position sizing, the takeaway is simpler: four days a year carry about three times the normal daily risk, and the next one is the fiscal first-quarter report, which Apple typically releases in late January.
Part 3: Technical analysis
Technical analysis is the study of price and volume themselves. It does not tell you what a business is worth. What it does well is describe the current trend, show where buyers and sellers have been active, and flag when momentum is changing. For a stock with Apple’s liquidity, those levels matter because so many participants watch the same ones. All figures use regular (not dividend-adjusted) daily closes through November 9, 2026.
Trend: moving averages and crosses
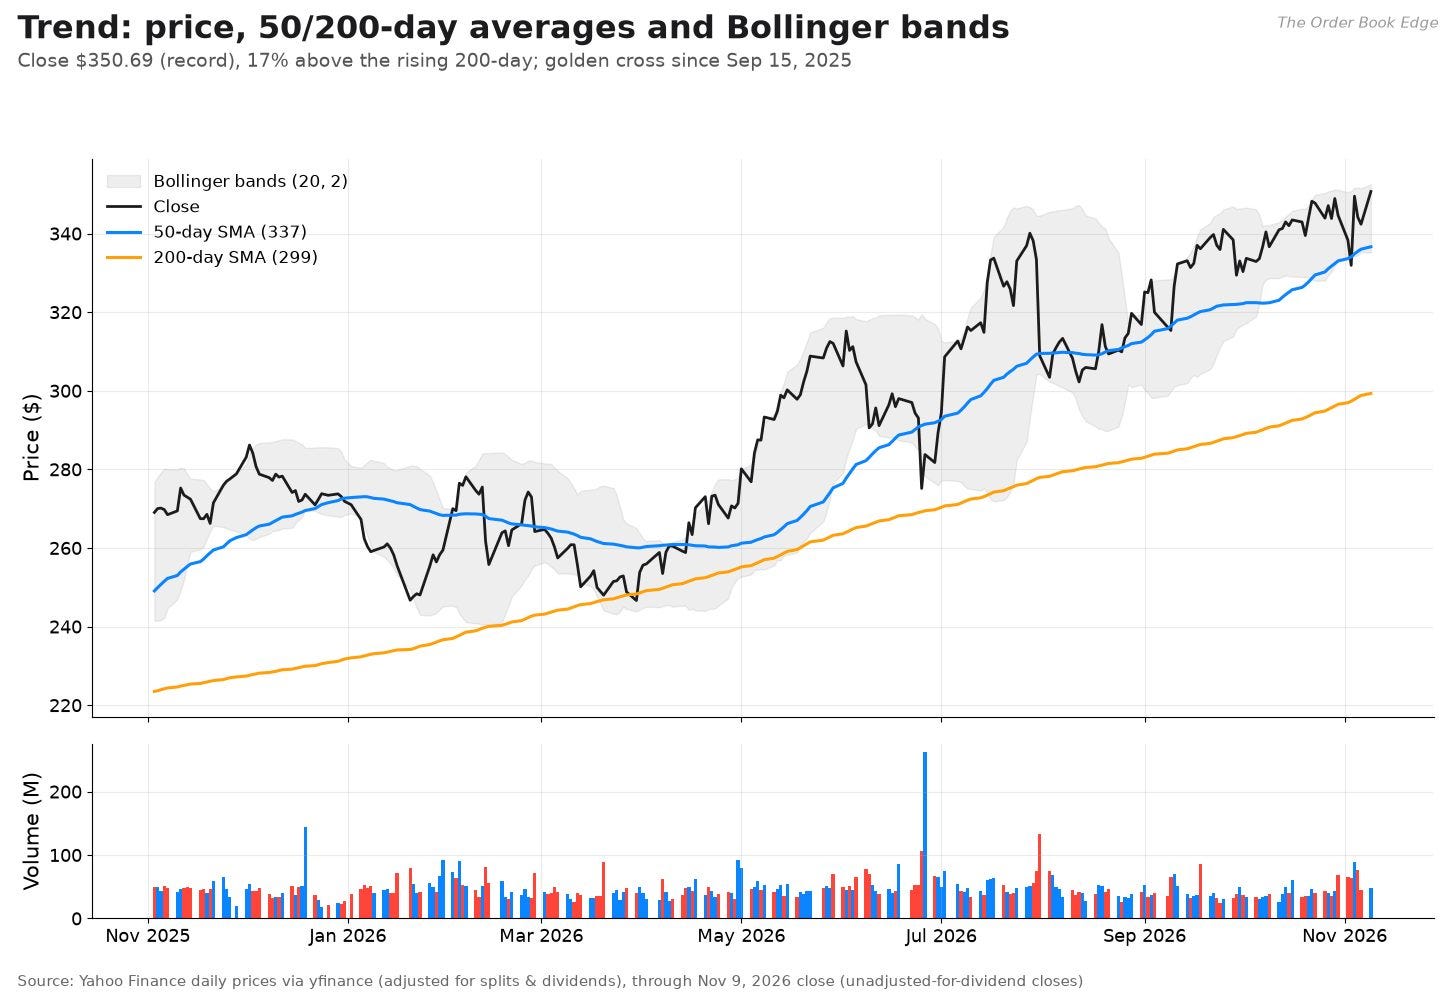
The simplest trend tool is a moving average: the average closing price over the past N days. The 50-day average tracks the intermediate trend and the 200-day the long-term trend. A “golden cross” is when the 50-day rises above the 200-day; a “death cross” is the reverse.
Where things stand:
Close: $350.69, a record close. The intraday 52-week high is $355.38, set on November 5, 2026. The 52-week low is $243.42, set on January 20, 2026. The stock is up 44% from that low.
50-day SMA: $336.63. Price is 4.2% above it.
200-day SMA: $299.32, and rising. It gained 2.8% over the past 20 sessions. Price is 17.2% above it.
Last cross: a golden cross on September 15, 2025, which followed a death cross on April 7, 2025 during the tariff sell-off.
Since 2018, Apple has produced ten crosses. Several were whipsaws: a golden cross on September 28, 2022 was reversed by a death cross two days later. That is the weakness of moving-average signals in choppy markets. In a persistent trend like the current one, though, they keep you on the right side. The 14-month run since the last golden cross is one of the longer uninterrupted uptrends in the sample.
A 17% gap above the 200-day is stretched but not extreme for Apple. The more practical observation concerns the 50-day, now near $337. Price spent much of August below it, then reclaimed it and stayed above it from September until the post-earnings dip. The stock closed at $331.90 on November 3, about $2 below the 50-day, and was back above it the next session.
Momentum oscillators: RSI and MACD
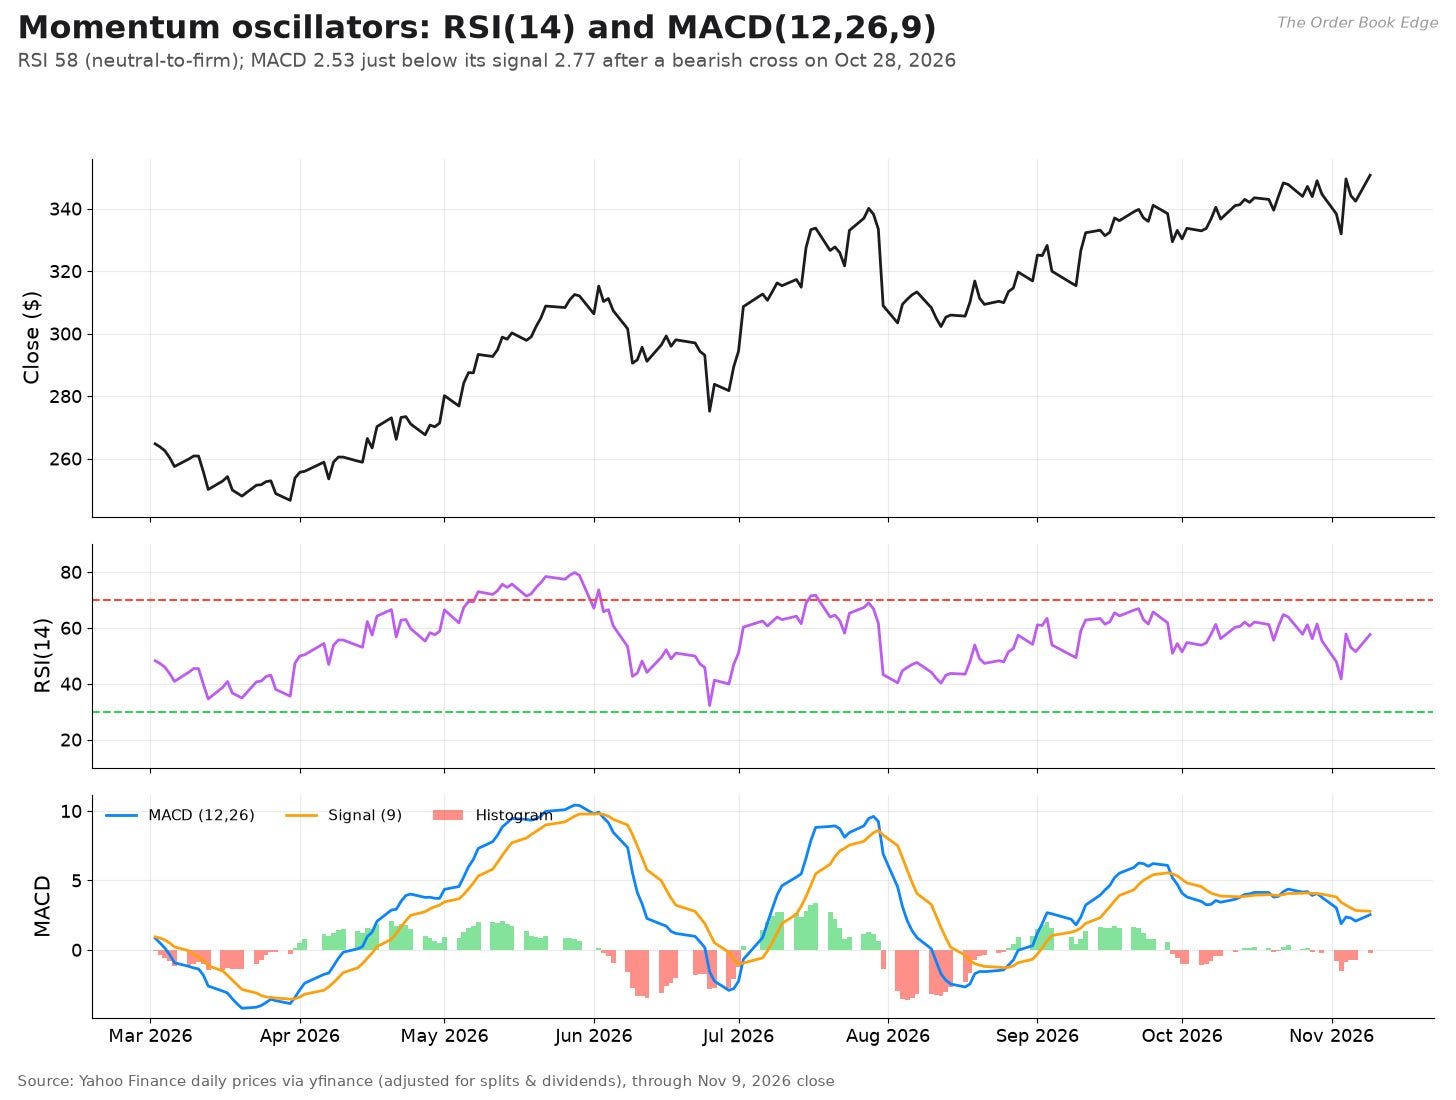
The Relative Strength Index (RSI) compares the size of recent gains with recent losses on a 0-to-100 scale. Readings above 70 are conventionally “overbought” and below 30 “oversold.” I use Wilder’s 14-day version.
The MACD (moving average convergence divergence) is the difference between a 12-day and a 26-day exponential moving average. Its 9-day exponential average is the “signal line,” and the gap between the two is the histogram. MACD crossing above its signal suggests strengthening momentum; crossing below suggests fading momentum.
RS = \frac{EMA_{14}^{Wilder}(gains)}{EMA_{14}^{Wilder}(losses)}, \quad RSI = 100 - \frac{100}{1 + RS}
MACD = EMA_{12}(P) - EMA_{26}(P), \quad Signal = EMA_9(MACD), \quad Hist = MACD - Signal
EMA_t = \alpha P_t + (1 - \alpha) EMA_{t-1}, \quad \alpha = 2/(n+1)
function RSI(close[], n = 14):
    for t in 1..N-1:
        change = close[t] - close[t-1]
        gain[t] = max(change, 0); loss[t] = max(-change, 0)
    avgGain = wilder_smooth(gain, n)          # EMA with alpha = 1/n
    avgLoss = wilder_smooth(loss, n)
    rs = avgGain / avgLoss
    return 100 - 100 / (1 + rs)

function MACD(close[], fast = 12, slow = 26, signal = 9):
    macd = EMA(close, fast) - EMA(close, slow)   # alpha = 2/(n+1)
    sig  = EMA(macd, signal)
    return macd, sig, macd - sig
Current readings:
RSI(14): 57.6. Neutral to firm. RSI peaked near 67 on September 22, just short of overbought, and has cooled since.
MACD: 2.53, with the signal line at 2.77 and the histogram at -0.24. MACD crossed below its signal on October 28, 2026. The histogram is small and has been narrowing as price recovered after earnings.
The message from the oscillators is “trend intact, momentum cooling.” Price made a new closing high on November 9 while MACD, at 2.53, sits well below its September 22 peak of 6.25. If that gap persists, technicians would call it a bearish divergence. A fresh MACD cross back above the signal would cancel that reading. As the mean-reversion statistics above showed, though, overbought and oversold signals have had little predictive value for Apple over the past decade, so these are better used to time entries within a view than to form one.
Volatility bands: Bollinger
Bollinger bands are drawn two standard deviations above and below a 20-day moving average. They widen when the stock gets volatile and narrow when it gets quiet. The %B statistic places the price within the bands: 0 at the lower band, 1 at the upper.
Mid_t = SMA_{20}(P), \quad Upper_t = Mid_t + 2\sigma_{20}, \quad Lower_t = Mid_t - 2\sigma_{20}
\%B = (P - Lower)/(Upper - Lower), \quad Bandwidth = (Upper - Lower)/Mid
function BOLLINGER(close[], n = 20, k = 2):
    mid   = rolling_mean(close, n)
    sd    = rolling_stdev(close, n)
    upper = mid + k * sd
    lower = mid - k * sd
    pctB  = (close - lower) / (upper - lower)
    width = (upper - lower) / mid
    return mid, upper, lower, pctB, width
Today the upper band is $352.53, the middle $343.87 and the lower $335.21. %B is 0.89, so price is pressing the upper band. Bandwidth is 5.0% of price, narrower than on 92% of the past year’s trading days.
That narrowness is the most interesting technical fact on the chart. Bollinger “squeezes” do not predict direction, but they often come before a volatility expansion. Combined with the cooling MACD and the record close, the setup is a stock coiled near its highs. A close above the upper band and the $355 intraday high would be a breakout. A close back below the 50-day, around $337, would suggest the squeeze is resolving downward.
Volume: OBV and participation
On-balance volume (OBV) adds a day’s volume when the stock closes up and subtracts it when it closes down. The level means nothing on its own, but its direction shows whether volume is flowing in on up days or down days.
OBV_t = OBV_{t-1} + sign(P_t - P_{t-1}) \times Volume_t
function OBV(close[], volume[]):
    obv[0] = 0
    for t in 1..N-1:
        obv[t] = obv[t-1] + sign(close[t] - close[t-1]) * volume[t]
    return obv
OBV rose by about 94 million shares over the past 63 sessions and about 670 million shares over the past 252, both consistent with accumulation during the uptrend. Average volume over the past 20 sessions was 49.8 million shares a day, slightly above the one-year average of 48.0 million. In other words, the rally to record highs has come on normal volume, not on a buying frenzy and not on fading participation. The heaviest single-day volume of the past year came on Friday, June 26, 2026, about 262 million shares at a $283.78 close. That date is the last Friday of June, when the annual Russell index reconstitution typically happens, so it likely reflects index trading rather than a change in conviction.
Support and resistance from the data
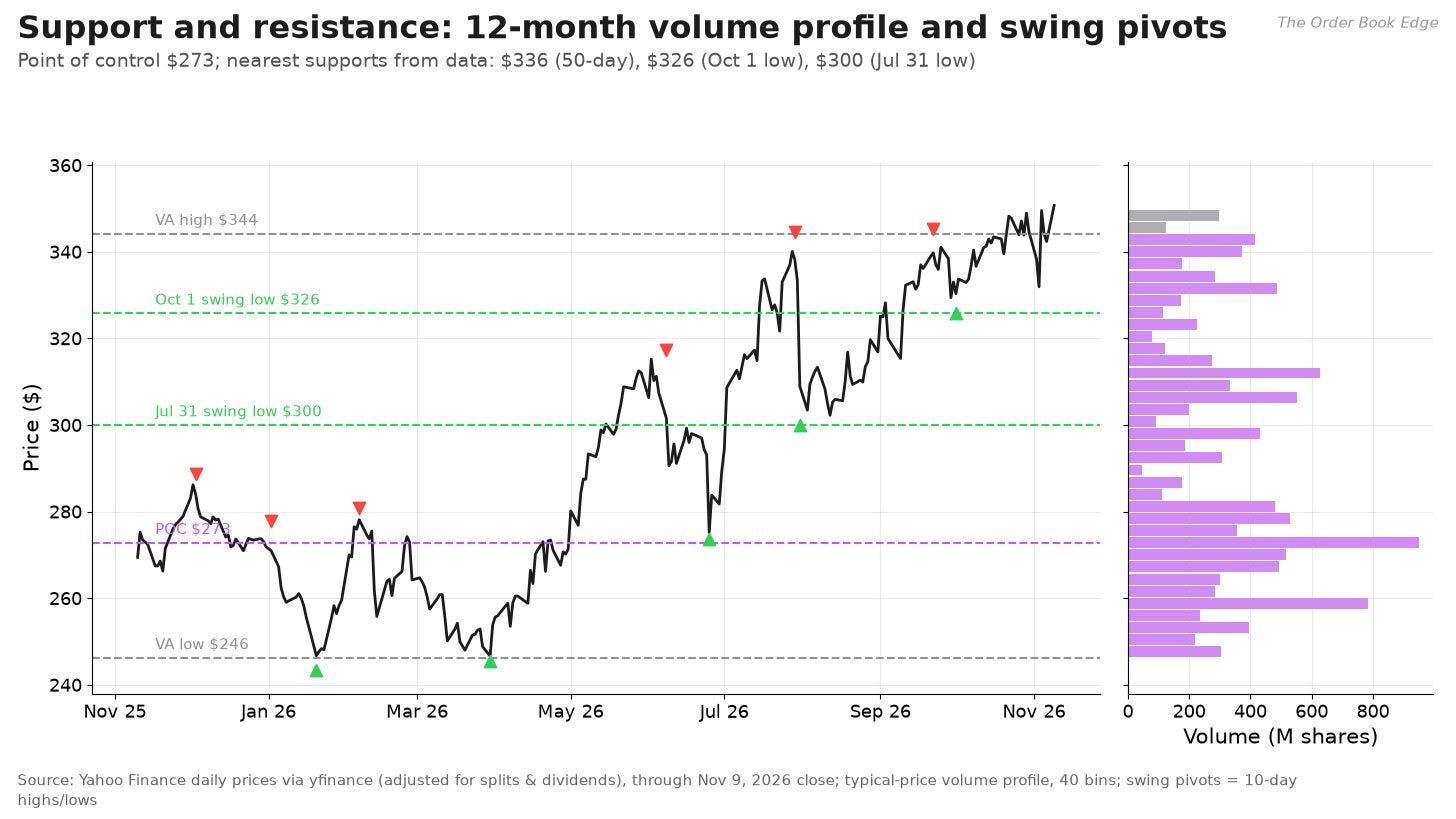
Instead of drawing lines by eye, I derived levels two ways.
Volume profile. For the past 12 months, I assigned each day’s volume to its typical price (the average of high, low and close) and grouped it into 40 price bins. The bin with the most volume is the “point of control.” The “value area” is the smallest range of bins holding 70% of the volume.
Swing pivots. A swing high is a day whose high is the highest of the 10 sessions before and after it. A swing low is the reverse.
function VOLUME_PROFILE(high[], low[], close[], volume[], bins = 40):
    typical = (high + low + close) / 3
    edges = linspace(min(low), max(high), bins + 1)
    profile = histogram(typical, edges, weights = volume)
    poc = center_of(edges, argmax(profile))
    # value area: add bins from largest volume down until 70% of total
    order = argsort_descending(profile)
    va = take bins from order until cumulative >= 0.70 * sum(profile)
    return poc, min_edge(va), max_edge(va)

function SWING_PIVOTS(high[], low[], w = 10):
    highs = [t for t where high[t] == max(high[t-w .. t+w])]
    lows  = [t for t where low[t]  == min(low[t-w .. t+w])]
    return highs, lows
What the data shows:
Point of control: about $273. That is where the most shares changed hands over the past year, during the long base from December 2025 to April 2026. It is far below the current price, so it matters only in a deep correction.
Value area: about $246 to $344. Because Apple spent months basing in the $245 to $280 range, most of the year’s volume sits well below today’s price. The current price is above the value area, which technicians read as acceptance of higher prices if it holds.
Other heavy-volume nodes: around $259, $278, $306 and $312.
Swing highs: $288.62 (December 3, 2025), $317.40 (June 8, 2026), $344.57 (July 29, 2026) and $345.34 (September 22, 2026).
Swing lows: $243.42 (January 20, 2026), $245.51 (March 30, 2026), $273.75 (June 25, 2026), $300.00 (July 31, 2026) and $325.81 (October 1, 2026).
Putting it together, the nearest supports are the 50-day average around $337, the old swing highs near $345 that the stock has now cleared, the October 1 swing low at about $326, and then the July 31 low at $300, which also sits close to the rising 200-day. Resistance is only the November 5 intraday high of $355.38. Above that there is no overhead supply, because the stock has never traded higher.
Relative strength versus SPY and QQQ
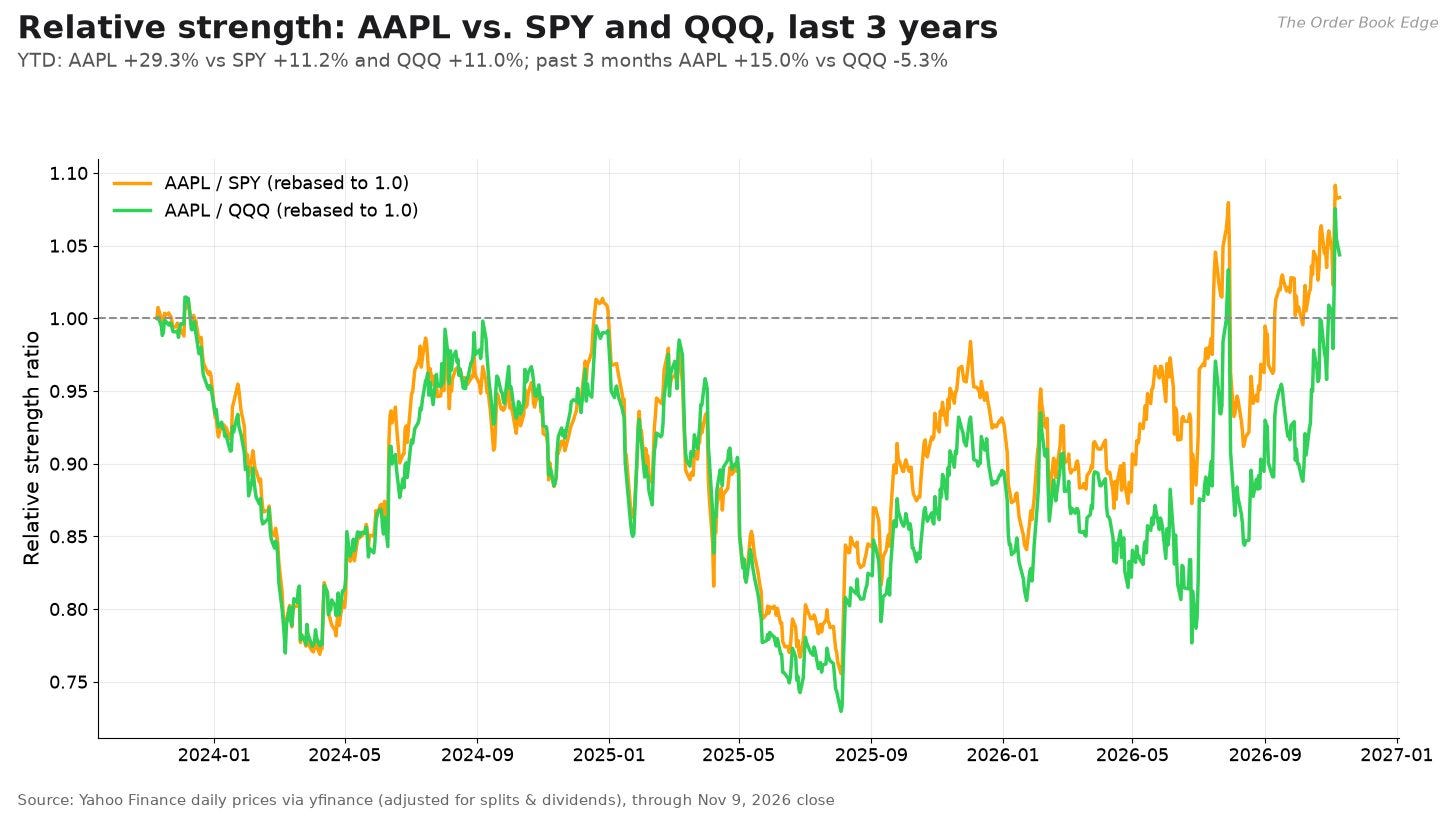
Relative strength here is simply the ratio of Apple’s price to a benchmark’s, rebased to 1.0 three years ago. A rising line means Apple is outperforming.
RS_t = (P^{AAPL}_t / P^{B}_t) / (P^{AAPL}_0 / P^{B}_0)
The ratio spent most of 2024 and 2025 below where it started, bottoming on August 4, 2025, months after the spring tariff sell-off. It has since climbed to new three-year highs against both indexes, set on November 5, 2026. The numbers:
Against SPY: Apple outperformed by 17.5% over three months, 17.2% over six months and 15.0% over one year.
Against QQQ: by 21.5%, 25.6% and 16.9%.
Year to date: Apple +29.3% total return, SPY +11.2%, QQQ +11.0%.
Relative strength this strong usually reflects a real change in how investors see a company. It also makes the stock a crowded relative trade: if money rotates back toward the market’s prior leaders, Apple can lag even if its own fundamentals stay fine.
Technical takeaways
The primary trend is up on every timeframe: price above a rising 50-day, which is above a rising 200-day.
Short-term momentum has cooled (MACD below signal), and volatility has compressed to a one-year low (tight Bollinger bands). Expect a larger move soon, without a strong hint of direction.
Key levels from the data: resistance at the $355 record intraday high; support at roughly $337 (50-day), $326 (October 1 low) and $300 (July 31 low, near the 200-day).
Part 4: Risks, catalysts and scenarios
The main risks
1. Memory costs and the gross-margin reset. This is the clearest near-term risk because management has already quantified part of it. The December-quarter gross margin guide of 45% to 46% is 2 to 3 points below the September quarter and below consensus. The 10-K says Apple “is experiencing supply constraints and rising costs” for “advanced semiconductors, memory and storage” and “expects these trends to intensify for memory and storage components.” Each point of gross margin on roughly $480 billion of revenue is about $4.8 billion of gross profit, or around $0.27 of annual EPS after tax at a 17% rate and the current share count. A multi-quarter margin reset is not catastrophic for the business, but it matters a great deal for a stock priced at 39 times earnings.
2. Services growth and regulation. Services produced about 40% of fiscal 2026 gross profit. Its growth slowed to 9.8% in the September quarter and is guided to 8% to 9% for December. Several specific pressures are disclosed in the 10-K:
Google search licensing. The US remedies order in the Google search case is under appeal by both the DOJ and Google. Apple warns that a reversal “could result in the imposition of certain remedies initially proposed by the DOJ, such as those prohibiting Google from offering the Company commercial terms for search distribution.” Apple does not disclose the size of these payments in the 10-K. Management also cited “third-party licensing” as a Services headwind in its guidance.
The EU Digital Markets Act. Apple has changed its App Store terms, fees and distribution in the EU and faces ongoing non-compliance proceedings that can bring fines.
The DOJ antitrust suit filed in March 2024, alleging monopolization of smartphone markets, is still pending.
Epic Games litigation over App Store rules continues, including a contempt dispute.
Barclays, which rates the stock underweight with a $261 target, told clients it is “most concerned about the trends in Services,” pointing to regulatory changes around link-out transactions, according to CNBC.
3. Rising AI costs without clear monetization. R&D rose 32% in fiscal 2026, and December-quarter operating expenses are guided up 11% to 13% year over year, after rising 21% in the September quarter. Management also cited Siri AI rollout costs in the margin guide. If those costs buy durable share gains and new paid services, they are an investment. If they are simply the new price of keeping iPhone competitive, they permanently lower the margin ceiling. UBS flagged both AI-driven disruption to search and Siri costs as risks, according to Yahoo Finance’s summary of analyst notes.
4. Supply constraints. Apple is supply-limited on its most important new product. Constraints on iPhone Duo and on 2-nanometer chips limit how much of the demand Apple can convert into revenue this quarter, and they add execution risk to a cycle the bull case depends on. Ternus told Reuters that a “very small percentage” of iPhone Duo units had been returned for display issues and were being replaced.
5. Trade, tariffs and China. Greater China grew 28% in fiscal 2026 after a decline in fiscal 2025, a swing that shows how volatile that region can be. Apple’s guidance assumes “global tariff rates, policies, and their application remain in effect.” The 2025 tariff shock produced a 33% drawdown in under four months. The fiscal 2026 tariff refunds that helped margins are mostly behind it.
6. Valuation and rates. This is the risk that does not depend on anything going wrong at Apple. At 39 times earnings, a return to the 5-year median multiple of about 30 times would cut the price by about 23% with earnings unchanged. With the 10-year Treasury near 4.9%, the gap between Apple’s 2.6% earnings yield and risk-free bonds is unusually wide. Higher long-term rates are the classic way that gap gets closed.
7. Concentration and crowding. At about $5.1 trillion, Apple is one of the largest weights in every major US index, so passive flows and rotation between mega-caps can move it independently of fundamentals. After six months of strong relative performance, a crowded position can also unwind quickly.
The catalysts
The December-quarter (fiscal Q1 2027) report, which Apple typically releases in late January. The guide is 7% to 10% revenue growth, 8% to 9% Services growth, 45% to 46% gross margin, $20.4 billion to $20.8 billion of operating expenses and a tax rate around 17%. 9to5Mac calculated that the revenue guide implies about $153.8 billion to $158.1 billion. A result at the top of the range with gross margin at or above 46% would be a positive surprise; anything below 45% would confirm the bear case on margins.
iPhone Duo supply. Any sign that supply and demand are balancing, or that constraints are persisting into the March quarter.
Memory pricing. Industry DRAM and NAND contract prices drive Apple’s product margin in 2027. Evercore ISI, which rates the stock outperform with a $380 target, wrote that it expects Apple “to navigate a choppy GM environment till we start to see memory pricing stabilize (or come down) and/or Siri AI unlocks incremental monetization,” according to CNBC.
Siri AI monetization. Any paid tier, usage data or Services line that management ties to Siri AI.
Legal rulings: the appeal in the Google search case, DMA decisions in the EU, and the DOJ suit.
Capital return. Apple typically updates its buyback and dividend in its spring (fiscal Q2) report. The current $100 billion program was announced in April 2026.
What Wall Street is saying
There is no single verifiable consensus price target in the free sources I used, so I will not quote one. Here is what individual firms said after the November 2 report, as reported by CNBC on November 3, 2026, along with two firms reported elsewhere:
Goldman Sachs: buy, target cut to $380 from $390. Analyst Michael Ng said the firm came away “with increased confidence in the critical iPhone refresh cycle,” while flagging Services headwinds and memory costs as “a multi-quarter overhang.”
Evercore ISI: outperform, $380.
Bernstein: outperform, $370. “Cautious on Apple in the near term” because of memory cost inflation, but “bullish on Apple long-term.”
Bank of America: buy, $370. Citi: buy, $365. JPMorgan: overweight, $355.
Barclays: underweight, $261, raised from $245.
Aletheia Capital: sell, $250, the lowest target on the Street, according to TipRanks.
TD Cowen said its calendar 2027 EPS estimate of $9.75 “remains achievable,” according to TheFly as cited by Yahoo Finance.
Two things stand out. Most of these targets cluster between $355 and $380, only 1% to 8% above the November 9 close. And the range from $250 to $380 is wide, which reflects how much depends on margins and Services.
Scenarios
I have framed three scenarios. The DCF values use the author’s assumptions described in Part 1 and are illustrative, not price targets.
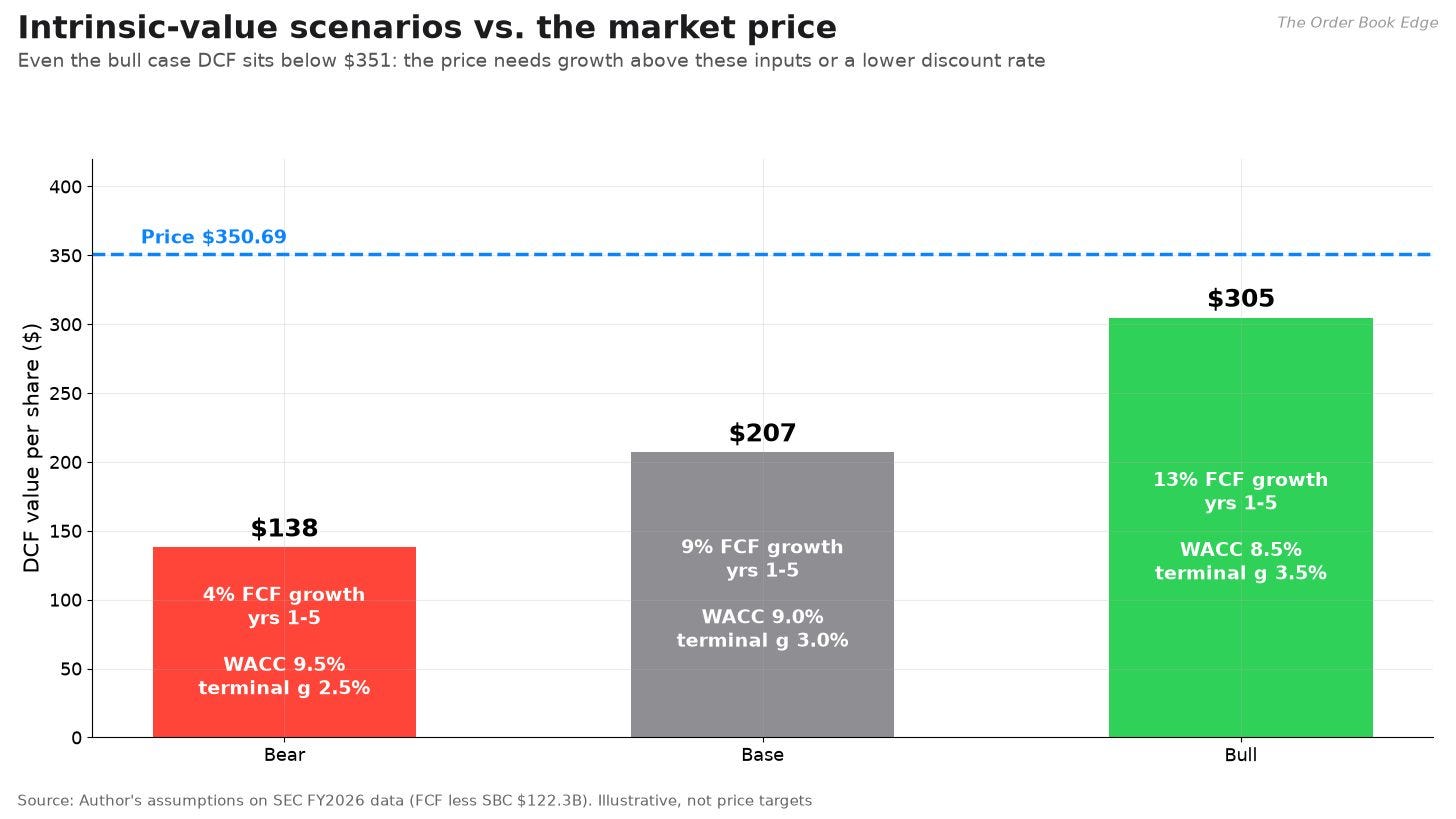
Bear case: “the margin reset lasts.” Memory inflation runs through 2027, gross margin stays in the mid-40s, Services growth slips to mid-single digits as regulation bites into App Store and licensing income, and the AI spend does not produce new revenue. Free cash flow grows about 4% a year for five years. With a 9.5% discount rate and 2.5% terminal growth, the DCF value is about $138. A more practical way to frame the market risk: if the P/E fell to its 5-year median of about 30 times on fiscal 2026 EPS of $8.98, the stock would be near $270. At the 10-year median of 26 times, it would be near $235, which is close to the Monte Carlo 5th percentile.
Base case: “a good cycle at a full price.” iPhone grows high single to low double digits in fiscal 2027, margins dip and then recover partially, Services grows high single digits, and buybacks cut the share count about 2% a year. Free cash flow grows 9% a year for five years, then fades to 3%. With a 9% discount rate the DCF value is about $207. In market terms, earnings growth near 10% plus a 2% shareholder yield would deliver roughly 10% to 12% a year only if the multiple holds. Any multiple compression comes straight out of that return.
Bull case: “the AI device cycle.” iPhone Duo and the foldable lineup drive a multi-year upgrade cycle, memory costs peak in 2027, Siri AI lifts Services back above 10% growth, and margins return toward 48%. Free cash flow grows 13% a year for five years. With an 8.5% discount rate and 3.5% terminal growth, the DCF value is about $305, still below the current price. Reaching $350 with this model requires roughly 15% growth for five years at an 8% discount rate, or a lower discount rate than I think is justified with the 10-year Treasury near 4.9%.
The uncomfortable conclusion from the scenarios is that even an optimistic set of fundamental assumptions does not justify today’s price in a standard DCF. The market is either assuming growth above my bull case, using a much lower discount rate for Apple’s cash flows than for the average stock, or paying a scarcity premium for one of the few mega-caps with a fortress balance sheet, a 2.5-billion-device installed base and visible earnings. All three are possible. None of them is a margin of safety.
What to watch
Gross margin versus the 45% to 46% guide in late January, and management’s commentary on memory costs into the March quarter.
Services growth. A print below 8% would confirm the slowdown; a return toward 10% would ease the biggest bear argument.
iPhone growth and supply. Whether iPhone Duo constraints ease and whether iPhone revenue grows double digits for a third straight quarter.
The 10-year Treasury yield. At 39 times earnings, Apple’s multiple is sensitive to long rates. FRED’s DGS10 was 4.86% on November 6.
Beta and correlation. A jump in Apple’s correlation with the indexes from today’s unusually low levels would signal that the stock is trading as “the market” again, which tends to happen in sell-offs.
Technical levels. A close above $355 opens a breakout with no overhead supply. A close below the 50-day (about $337) and then below $326 would break the short-term trend structure.
Buyback pace. Apple repurchased $24 billion in the September quarter. Watch whether it keeps buying at a pace near $85 billion to $90 billion a year at these prices.
Methodology and sources
Data sources, with as-of dates:
Apple fiscal 2026 Form 10-K, filed November 3, 2026, for the year ended September 26, 2026: SEC EDGAR. Segment and category history from the fiscal 2020 and fiscal 2023 10-Ks.
Apple fourth-quarter fiscal 2026 earnings release, filed as Exhibit 99.1 to an 8-K on November 2, 2026: SEC EDGAR.
Apple 8-K on the November 9, 2026 note issuance: SEC EDGAR.
SEC XBRL companyfacts API for annual and quarterly financial history: data.sec.gov.
Daily prices for AAPL, SPY and QQQ from Yahoo Finance via the yfinance library, through the November 9, 2026 close: Yahoo Finance.
Treasury yields from FRED, St. Louis Fed: DGS10 (4.86%) and DGS3MO (4.19%), both November 6, 2026.
Factor returns from the Kenneth R. French Data Library, five factors (2x3) and momentum, daily, through September 30, 2026.
Earnings call of November 2, 2026: transcript at StockAnalysis.
News and analyst commentary: CNBC live coverage, November 2; CNBC analyst roundup, November 3; Reuters via StreetInsider, November 2; Yahoo Finance, November 3; TipRanks; 9to5Mac, November 2.
Method notes:
Returns are total returns from adjusted closes. Technical indicators use regular closes. Rolling windows are in trading days.
Sharpe and Sortino ratios use the 3-month Treasury yield as the risk-free rate. Regressions are ordinary least squares; the factor regression uses Newey-West standard errors with five lags.
Trailing P/E history uses trailing-twelve-month net income from SEC filings (with the fiscal fourth quarter derived as the full year minus the first nine months) and the share count reported on each filing’s cover, adjusted for the 2020 four-for-one split.
ROIC is NOPAT divided by average debt plus equity. NOPAT is operating income times one minus the effective tax rate.
The DCF, reverse DCF, scenario values and Monte Carlo drift are the author’s assumptions, stated in full where they are used. Change the inputs and the answers change.
Earnings dates are 8-K Item 2.02 filing dates. One of the 46 is the January 2, 2019 guidance revision.
Not verified and therefore not included: a consensus price target, options-implied earnings moves, and the size of Apple’s search-licensing income, which Apple does not disclose in its 10-K.
Final word
Apple is a better business today than at almost any point in its history: more profitable, more cash-generative and with a larger installed base than ever. The stock reflects all of that. The quant work shows a volatile, fat-tailed stock that has recently decoupled from the market, with a 30% drawdown arriving about every two years on average. The technical picture shows a strong uptrend that is pausing at a record. The fundamental work shows a price that assumes the next decade of cash-flow growth will be about 50% faster than the last.
Great companies can stay expensive for a long time, and Apple has done so for most of the past five years. The useful question is not whether Apple is a great company. It is whether today’s price leaves room for anything to go wrong. On these numbers, it leaves very little.
If you found this useful, subscribing is free.
Disclaimer: This article is for informational and educational purposes only and is not investment, financial, tax or legal advice, or a recommendation to buy, sell or hold any security. The author may or may not hold positions in the securities discussed. Models, scenarios and simulations rest on the author’s assumptions and historical data, which do not guarantee future results. Do your own research and consider consulting a licensed financial professional before making investment decisions.