


Educational analysis only. This is not financial advice, a recommendation or an offer to trade anything. Every price, probability and payoff below is either sourced to a named outlet, computed by me from public Yahoo Finance data, or labelled illustrative. Stocks, futures and options can lose money, and futures and options can lose more than you put in.
Tuesday, November 17, 2026: the cloud is accelerating, the cash is gone, and a $2.79 trillion stock waits on Anthropic’s IPO
Amazon (NASDAQ: AMZN) closed Tuesday at $257.89, according to Yahoo Finance. That is 9.2% below the record close of $284.02 (August 3), 29.7% above the closing low of $198.79 (February 13), 11.7% above where the year started ($230.82 on December 31, 2025) and 7.3% above the close of $240.35 on October 30, the day after the third-quarter report. The market value is about $2.79 trillion. Over twelve months the stock is up 9.9%, against 10.2% for the S&P 500 (SPY) and 8.4% for the Nasdaq-100 (QQQ). Over three years it is up 79.6%, against 72.4% and 76.6%. This is not a stock that has been left behind or run away. It is a stock that has gone sideways inside a wide range while its business changed shape underneath it.
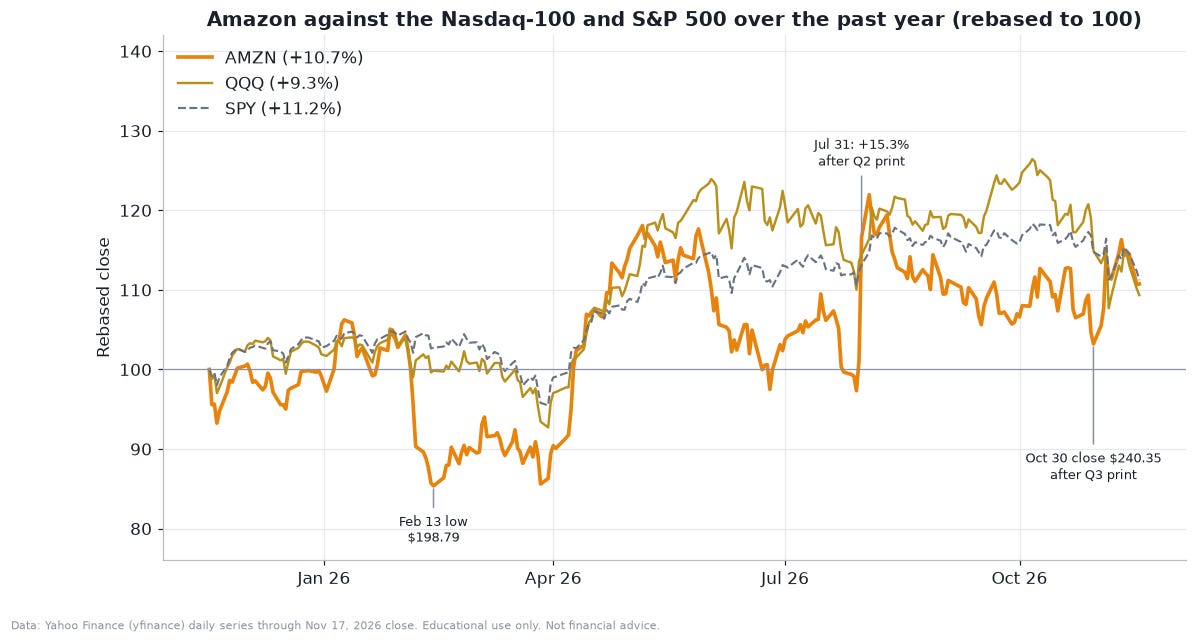
Three things collide this week. First, the business: on October 29 Amazon reported third-quarter revenue up 12% to $201.9 billion, its highest-ever operating margin of 13.9%, and AWS growing 39.3%, the fastest in nearly five years and the sixth straight quarter of acceleration, according to Amazon’s release. Second, the cash: the same release showed free cash flow over the last twelve months at minus $42.4 billion, because Amazon is spending about $220 billion on capital equipment this year and has told investors it will spend “meaningfully more” next year. Third, the catalyst: Anthropic, the AI company Amazon has backed since 2023, is due to price its IPO on Wednesday evening, November 18, and start trading on the Nasdaq on Thursday, November 19 under the ticker ANT, according to CNBC. Amazon’s disclosed stake is worth roughly $135 to $150 billion at the proposed price range, which is about 5% of Amazon’s own market value.
That is the tension this article tries to take apart with the three lenses a professional would use: fundamental, technical and quantitative. It runs long on purpose. It covers the print, AWS, advertising and retail, capital spending and how it is funded, the Anthropic stake, valuation three ways, the chart, and the statistics of how this stock behaves, including what the options market is pricing. Along the way I compare all of it with a trading bot a reader sent me, a long-only bot written for CME’s Micro Amazon futures. Everything about the bot is at the concept level. No parameters, thresholds or code appear, only pseudocode and generic math.
A word on sourcing. Prices, returns, volatility, betas, simulations and option-implied figures are my own calculations from Yahoo Finance data through the November 17 close. Company figures come from Amazon’s third-quarter release and call. News and legal facts are attributed to the outlet or court record that reported them. Where a number is my assumption, I say so. There are no invented figures in here, and where I could not verify something, I flag it.
What “XAMZN” actually is
Start with the name, because for the Alphabet bot I wrote last week this was a problem and here it is not. The bot trades the symbol XAMZN on the CME exchange, and it registers itself with its trader’s bot registry as “XAMZN:CME”.
CME Group launched single stock futures on July 27, 2026. According to CME’s Special Executive Report 9974R (dated July 16, 2026) and its clearing advisory 26-231, the launch included 55 standard single stock futures and 22 Micro single stock futures. Amazon is on the list in both sizes. SAMZN is the standard contract, covering 100 shares and moving in 0.01-point steps worth $1.00. XAMZN is the Micro, covering 10 shares, with each 0.01-point step worth $0.10. Both are financially settled, list two quarterly months at a time, and stop trading at 4:00 p.m. Eastern (3:00 p.m. Central) on the third Friday of the contract month. The current December contract’s last day is Friday, December 18, 2026. CME’s Globex platform trades them from Sunday evening through Friday afternoon with a one-hour daily break, which is why CNBC described the launch as around-the-clock access.
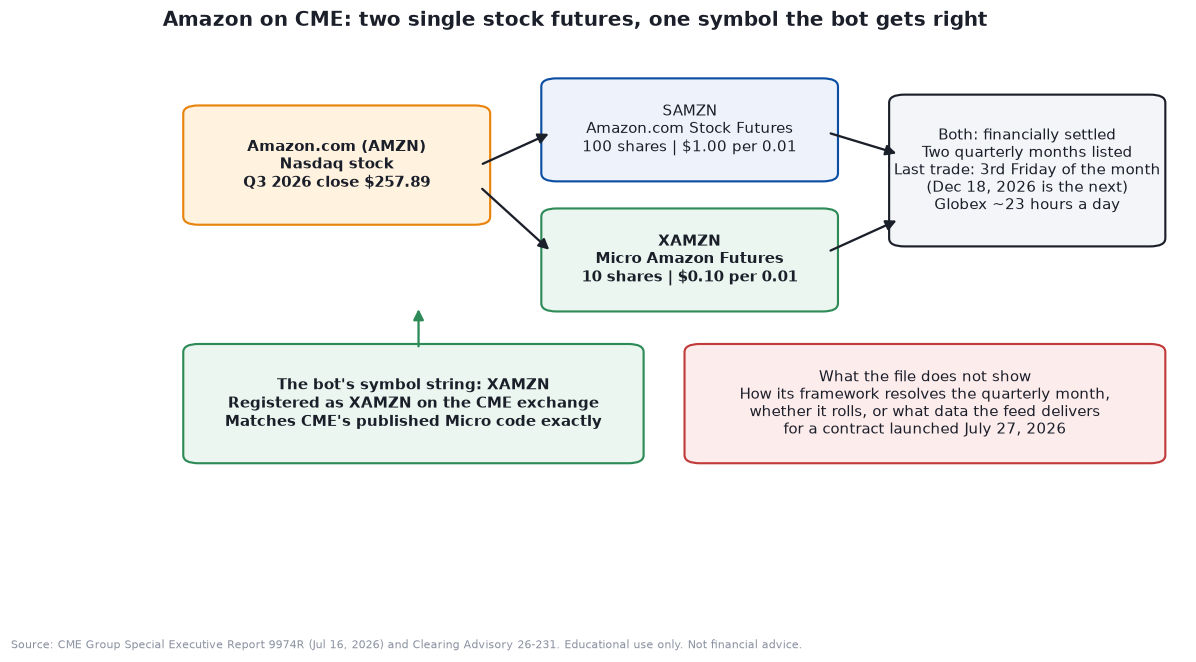
So the bot’s symbol matches CME’s published Micro Amazon code exactly. That is a point in its favor. The bot’s value per point is also consistent with a 10-share Micro. At $257.89, one Micro contract controls about $2,579 of Amazon stock and one standard contract about $25,789. Amazon pays no dividend, which makes the futures price simple: fair value for the December contract is the spot price grown at the short-term interest rate for the 31 days remaining. With the 13-week Treasury bill at 4.14%, that is about $258.80, or 91 cents above spot, as the formula shows.
Two things I cannot tell from the file. One is whether the bot’s framework resolves the symbol to the right quarterly month and receives data for a contract that is less than four months old. The other is whether anyone is trading it. I found no public volume or open-interest figures for XAMZN.
What the bot does, in plain words
I read the whole script. Here is what it is built to do, with no parameters.
Name and thesis. The bot is called “XAMZN Micro SSF Anthropic/AWS Long.” Its strategy label is “Anthropic Convertible Mark + AWS Growth Momentum (Post-Catalyst ATR).” Read literally, that says the idea is to buy Amazon after good news about its Anthropic investment and its cloud growth, using volatility-based stops. I come back to that label later, because most of it has no code behind it.
Direction. Long only. It never goes short and has no logic for it.
Regime. There is no explicit regime detector. The closest things are a volatility gauge that widens stops and trims size when the stock gets choppy, and a set of gates that stand aside when conditions look poor.
Signals. On each completed signal bar, the bot turns several standard price, momentum and volume readings into one combined score, adds a fixed nudge that stands in for the catalyst, and blends the result with a momentum gauge supplied by the bot’s parent framework, whose internals are not in the file. To enter, the score has to clear a bar and price has to sit above a slower trend line. The weights are a trade secret and I do not show them.
Risk management. This is where most of the code lives. Before any entry the bot checks that the bid-ask spread is acceptable compared with its own recent history, that market data is fresh, that it is not in an exchange maintenance window, and that daily and weekly loss limits and a losing-streak breaker have not tripped. If everything passes:
The stop distance is a volatility-based multiple of average true range (ATR), and the multiple widens when volatility is high.
The profit target is a multiple of the stop distance, and that multiple adapts to the bot’s own recent record.
Position size is a risk budget divided by the dollar value of the stop distance, scaled down further when volatility is high, and capped.
Once in a trade, a trailing stop only ever tightens, and profits are taken in stages at multiples of the initial risk.
Exits come from the stop, the trailing stop, the target, a “thesis check” (the trend or momentum rolling over, or volume drying up), an account-level profit objective, or a time limit.
It runs as a simulation. Entries and exits are logged at the midpoint of the latest bar, and profit and loss are tracked internally. Here is the logic as concept-level pseudocode.
on each completed signal bar:
    technical = weighted_sum(standard_trend, momentum, volume_readings)
    score     = blend(technical, fixed_catalyst_nudge, framework_momentum_gauge)
    bar       = adaptive_bar_from(recent_trade_record)
    if flat and score >= bar and price > slow_trend_line:
        if gates_pass(spread_ok, data_fresh, session_ok, loss_limits_ok):
            stop_distance = volatility_multiple * ATR
            target        = reward_ratio * stop_distance
            size          = min(size_ceiling, risk_budget / dollar_value(stop_distance) * stress_factor)
            buy(size, stop = entry - stop_distance)

on each faster execution bar while long:
    trailing_stop = tighten_only(trailing_stop, price - scaled_ATR)
    take profits in stages at multiples of the initial risk
    exit on: stop | trailing_stop | target | thesis_check_fails | profit_objective | time_limit
on each tick while long:
    exit if price <= stop or price <= trailing_stop
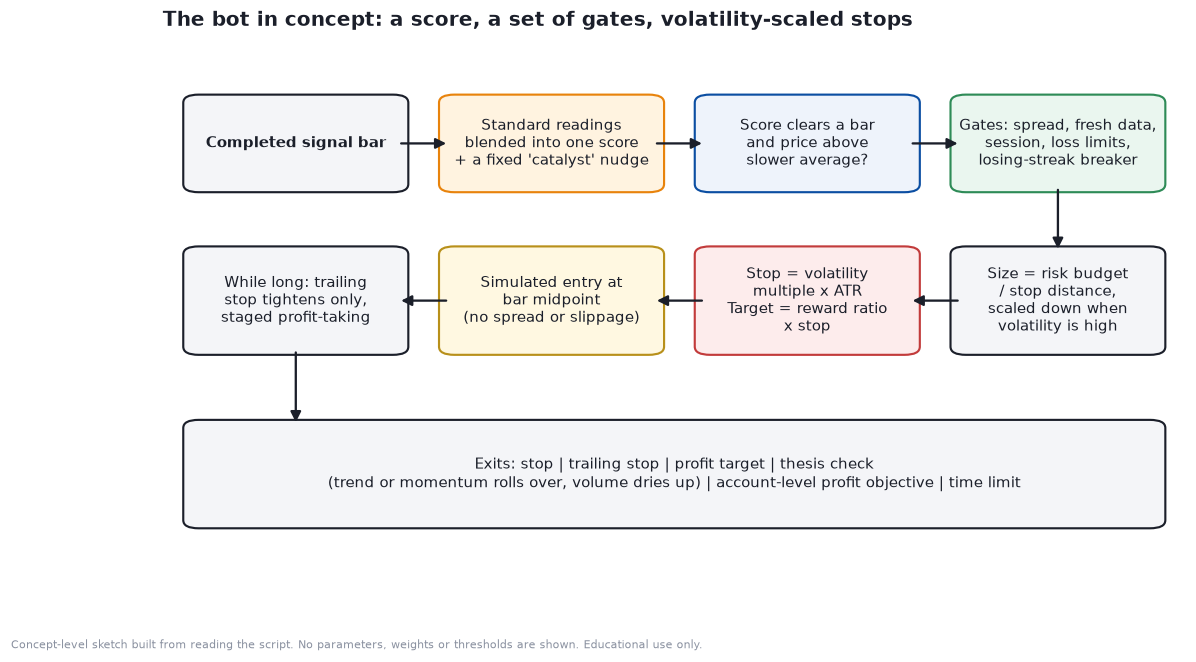
In one sentence: it is a tidy, long-only momentum bot that carries an Anthropic-and-AWS label. Later I return to where it fits Amazon and where it does not, and to a structural problem in how the file is laid out that may stop it from running at all. First, the thing it never looks at: the company.
Fundamentals, part one: the third-quarter print
The headline numbers from Amazon’s October 29 release are strong, and the market still sold them. Understanding why requires holding two facts at once.
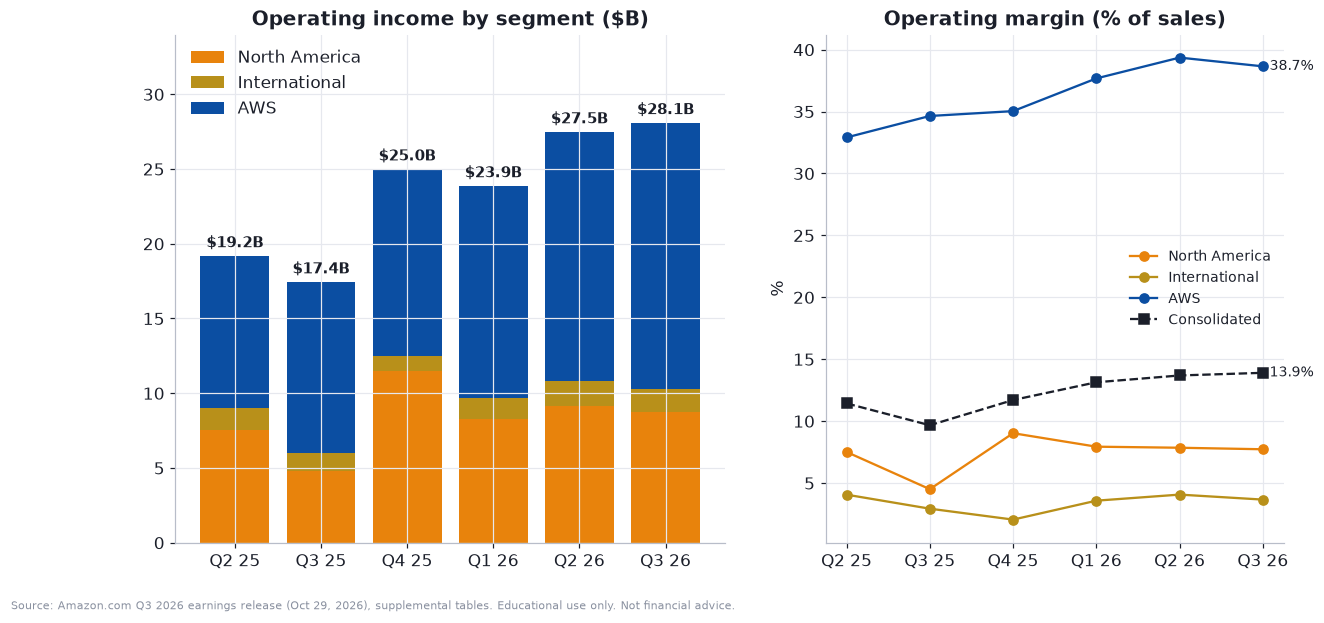
The strong half. Net sales rose 12% to $201.9 billion, or 13% excluding currency. Amazon said that excluding a shift in Prime Day timing, which moved into the second quarter this year after falling entirely in the third quarter of 2025, growth would have been about 400 basis points higher. Operating income rose to $28.1 billion from $17.4 billion, an operating margin of 13.9%, the highest in company history. That beat the top of Amazon’s own guidance range, according to a data-center industry newsletter that read the filing. North America operating income was $8.7 billion against $4.8 billion, International was $1.6 billion against $1.2 billion, and AWS was $17.8 billion against $11.4 billion.
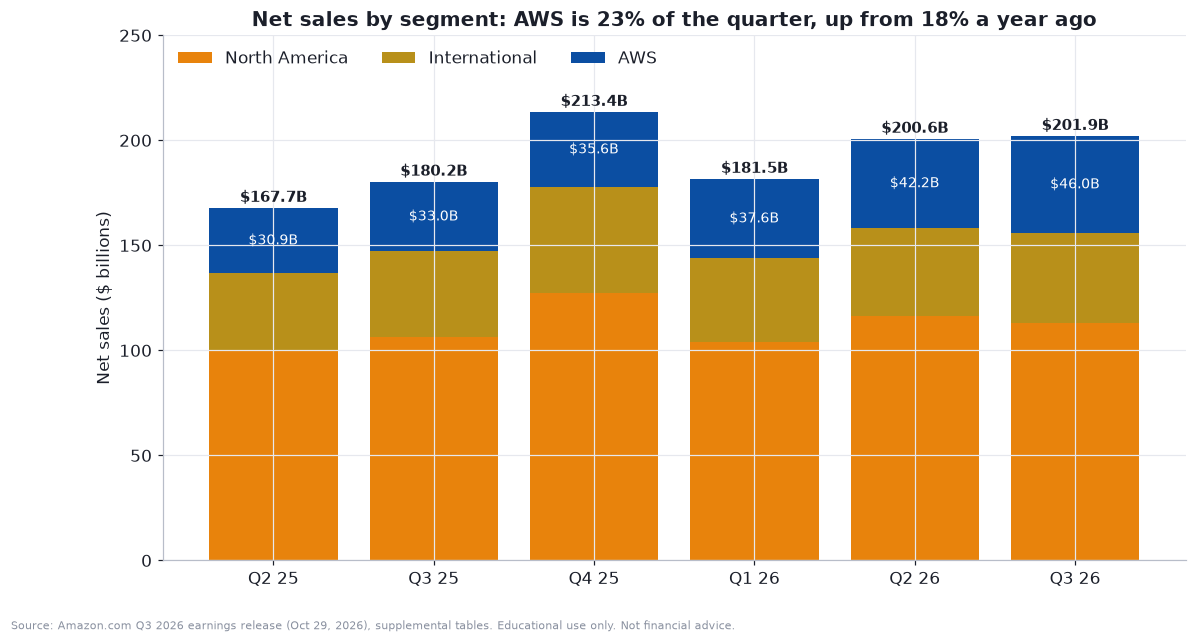
The weak half. Earnings per share were $1.89 against $1.95 a year earlier and the $1.96 that analysts polled by LSEG expected, according to CNBC. Revenue of $201.94 billion was a hair under the $202.31 billion consensus. The year-over-year EPS decline is an accounting artifact: the third quarter of 2025 included $9.5 billion of pre-tax gains on Amazon’s Anthropic investment, per the release. Strip that out and operating profit is what drove the quarter. The real disappointment was elsewhere. Capital expenditure reached $77.3 billion in the quarter, against $35.1 billion a year earlier and a FactSet estimate of $58.7 billion, and free cash flow slid to an outflow. Buy-side expectations for AWS growth were around 43%, according to a Deutsche Bank note quoted by CNBC, and 39% did not clear that bar. Shares fell about 6.5% in after-hours trading, opened the next day $11.25 below the prior close at $232.54, and closed at $240.35, down 1.4% on volume of 104.9 million shares against a 50-day average of 41.5 million.
The stock then did something the headline would not suggest. It recovered all of the loss within two weeks, rising 6.1% on November 4 alone. By November 12 it had recouped the post-earnings drop, according to Barchart, and it now sits 7.3% above the post-print close. Morningstar noted the shares remained up about 6% since earnings even as several large technology stocks sold off, and cut its fair value estimate to $280 from $300, citing a higher assumed capital intensity.
That is the pattern to hold on to: the print was good on the business line and bad on the cash line, the market punished the cash line for two days and then looked past it.
Fundamentals, part two: AWS, backlog and the AI chip story
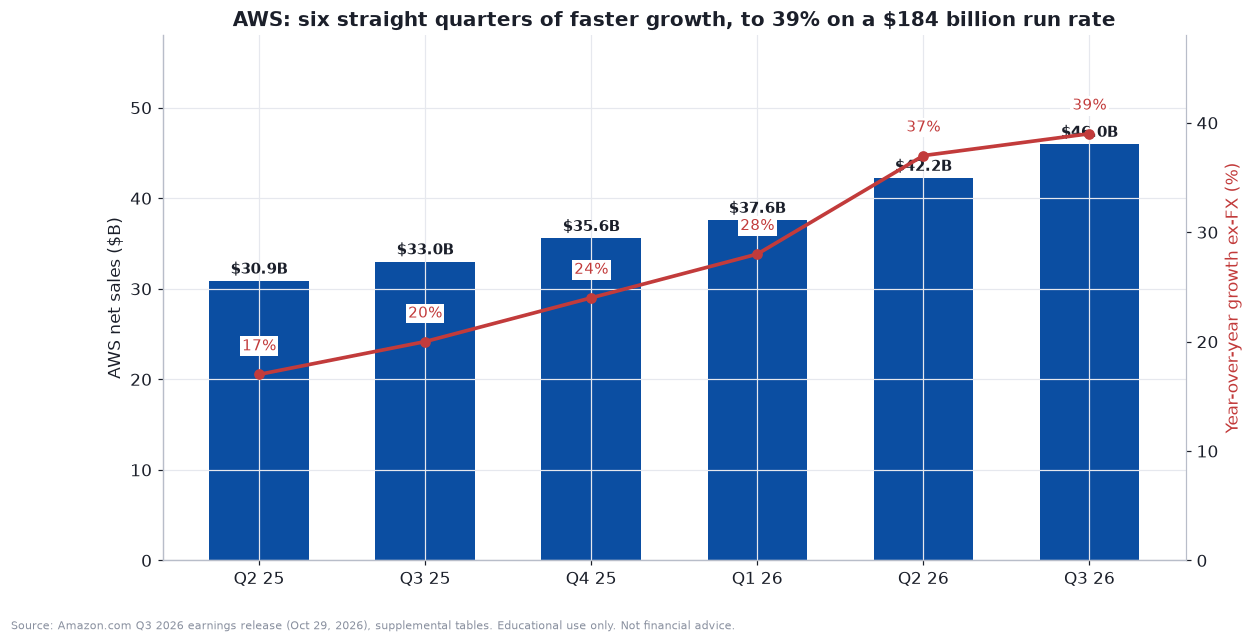
AWS is the reason Amazon’s multiple is what it is. Segment sales were $46.0 billion, up 39.3% from a year earlier and up $3.8 billion from the prior quarter, which Morgan Stanley’s Brian Nowak called the second-highest sequential dollar add in AWS history. The annualized revenue run rate is $184 billion. Growth has accelerated every quarter for six quarters, from 17% in the second quarter of 2025 to 28%, 37% and now 39% on an ex-currency basis, and management said it expects growth above 40% in each of 2027 and 2028.
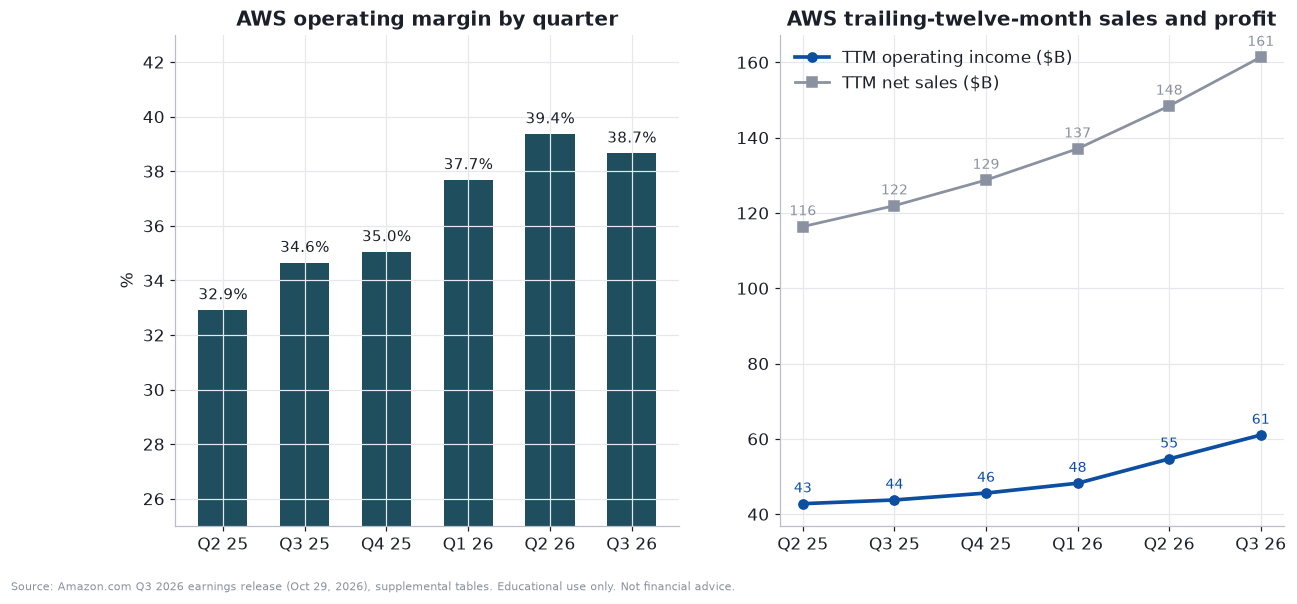
The profit line moved with it. AWS operating income was $17.8 billion, a margin of 38.7%, down slightly from 39.4% in the second quarter but up from 34.6% a year ago. Across the last twelve months the segment earned $61.0 billion on $161.4 billion of sales. The incremental margin tells you what the extra revenue is worth. AWS added $13.0 billion of sales and $6.3 billion of operating income year over year, so each extra dollar of revenue carried roughly 49 cents of operating profit. CEO Andy Jassy said AI margins are improving faster than core margins did at a comparable stage, even with higher memory costs and heavy depreciation.
The backlog is what supports the capex. It was $578 billion at the end of September, against $200 billion a year earlier, according to Amazon’s call and a newsletter that read the 10-Q. That newsletter says the filing names two large new customers: OpenAI expanded an earlier $38 billion commitment by $100 billion over eight years, and Anthropic expanded its own commitment by more than $100 billion over ten years. I did not read the 10-Q myself, so treat the customer detail as secondhand. The same source says the weighted-average life of the backlog stretched to 6.1 years from 3.8 years. Longer contracts are good for visibility and bad for flexibility. They also mean a large share of future AWS revenue depends on a handful of AI labs.
Two points on the AI chip story. Jassy said most of Bedrock, AWS’s model-hosting service, runs on Amazon’s own Trainium chips, and that Amazon intends to sell Trainium outside AWS in late 2027. The newsletter’s reading of the call adds that revenue commitments for Trainium and for the Graviton server CPU have each grown more than twenty times in a year. He also argued that owning or long-leasing data centers and running on your own silicon gives structurally better margins than renting capacity from neocloud providers, which he said carry operating margins about 3,500 basis points lower. That is a management claim, and an interested one.
Here is the circularity worth naming. Amazon invests in Anthropic. Anthropic commits more than $100 billion to buy compute from AWS. That commitment sits in AWS’s backlog, which justifies Amazon’s capex, which Amazon funds partly by borrowing. When Anthropic’s stock rises, Amazon’s investment gains grow and Anthropic’s ability to raise money to pay AWS improves. It is a loop that works well while the loop is rising and can unwind the same way. I am not saying it is improper. I am saying the backlog is not fully independent of the stake.
Fundamentals, part three: retail, advertising and the part everyone forgets
The cloud gets the attention, but retail and advertising are still three-quarters of revenue, and the numbers were mixed in a way that is easy to misread.
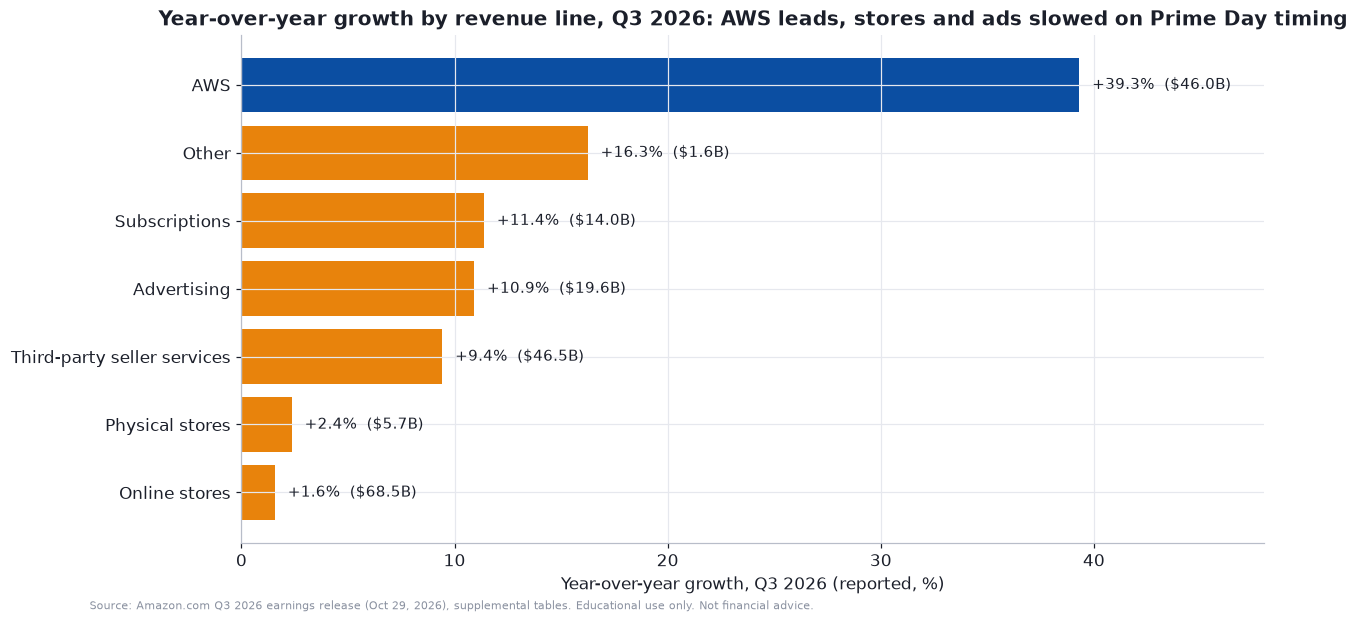
Online stores revenue was $68.5 billion, up only 1.6%. Third-party seller services were $46.5 billion, up 9.4%. Subscriptions were $14.0 billion, up 11.4%. Physical stores were $5.7 billion, up 2.4%. Advertising was $19.6 billion, up 10.9% as reported and 12% excluding currency, a sharp slowdown from 22% in each of the previous four quarters and 26% in the second quarter. If you stopped there you would conclude retail stalled. That would be wrong, and the reason is Prime Day.
Prime Day moved into the second quarter for most large countries this year, and Amazon said that without the shift, third-quarter growth would have been about four points higher. The right way to read it is to combine the two quarters. Total net sales over the second and third quarters of 2026 were $402.6 billion, against $347.9 billion in the same two quarters of 2025, which is 15.7% growth. Online stores over the two quarters grew 7.8%, third-party services 12.6%, and advertising 18.1%. Management guided fourth-quarter advertising growth to “high teens.” CEO Andy Jassy added that units grew nearly 15% year to date, that Amazon sold more than 30 billion items last year, and that it adds roughly twice the gross sales per quarter of its next largest U.S. competitor. Those are company claims, and I have not checked them against outside data.
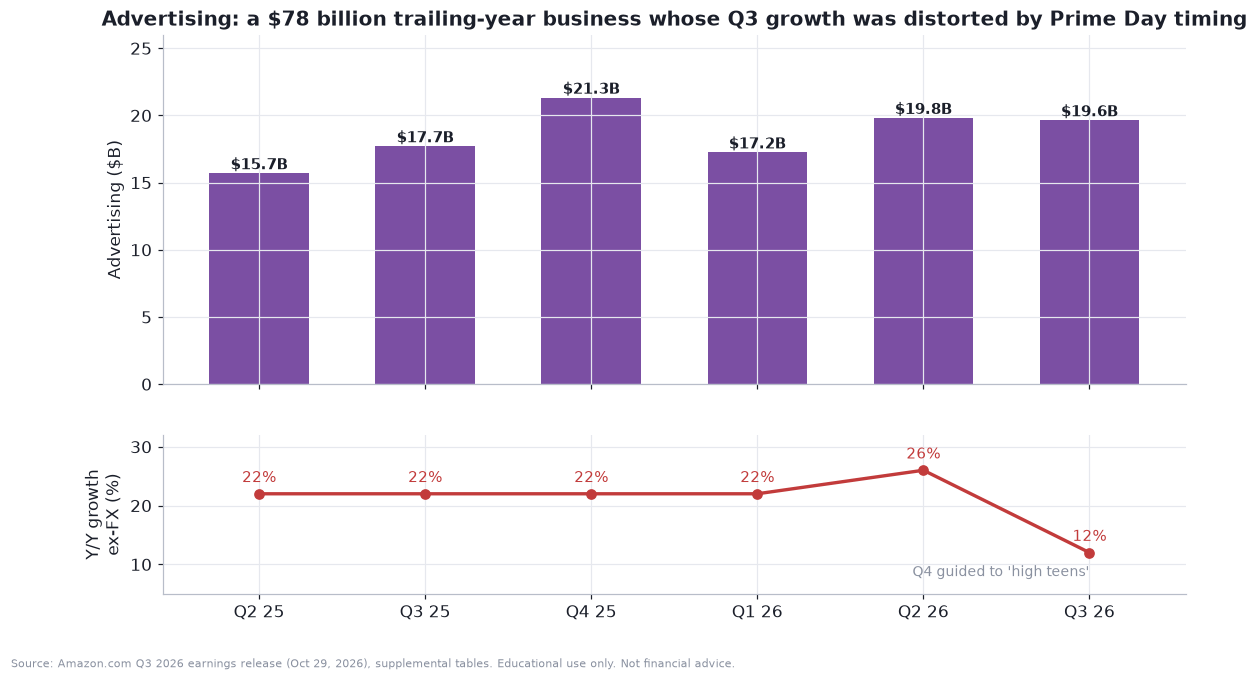
Advertising matters more than its revenue share suggests. It is a $78 billion trailing-year business, and because it sits inside the North America and International segments, it is a large part of why those segments earn what they do. North America’s operating margin was 7.7% in the quarter and 8.2% over the trailing twelve months. International’s was 3.7% and 3.3%. Jassy said both segments have expanded their operating margins by nearly ten percentage points over the past few years. The retail business is no longer a low-margin appendage. It is a business earning a combined $43.3 billion of trailing segment operating income, and that is what holds up the stores half of the sum-of-the-parts later.
Three cost items to watch. Management said fuel and line-haul inflation will be higher in the fourth quarter than the third, and that a fuel surcharge on sellers recovers some but not all of it. The fourth-quarter guide of $28.5 to $33.5 billion of operating income, against $25.0 billion a year earlier, includes most of the cost of Amazon Leo, the satellite internet service, because the company now expects to start capitalizing certain Leo costs only in the first quarter of 2027, later than it had said before. And fourth-quarter sales are guided to $240 to $247 billion, up 12% to 16%, with about 60 basis points of currency headwind.
Fundamentals, part four: capex, free cash flow and who is paying
This is the part of the story that has changed most since last year, and it is where most of the debate sits.
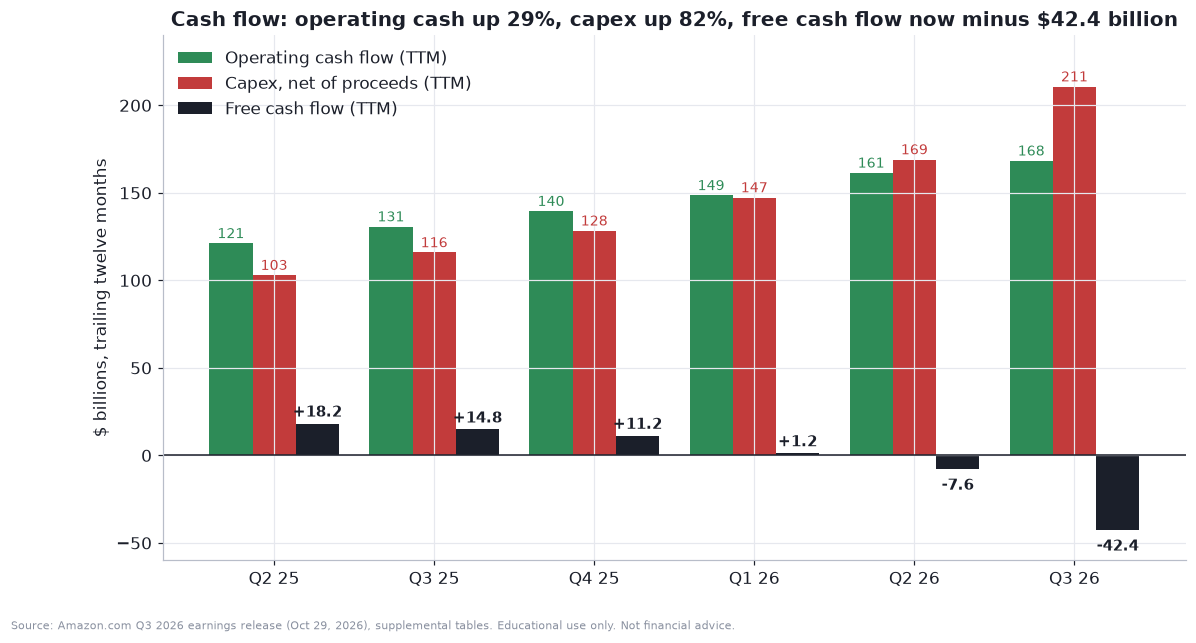
Over the last twelve months Amazon generated $168.3 billion of operating cash flow, up 29%. It spent $210.7 billion on property and equipment net of proceeds and incentives, up 82%, or $94.8 billion more than a year earlier. Free cash flow, which Amazon defines as operating cash flow minus that net capex, is a negative $42.4 billion, against a positive $14.8 billion a year ago. It was minus $7.6 billion a quarter earlier, plus $1.2 billion two quarters earlier and plus $14.8 billion a year earlier.
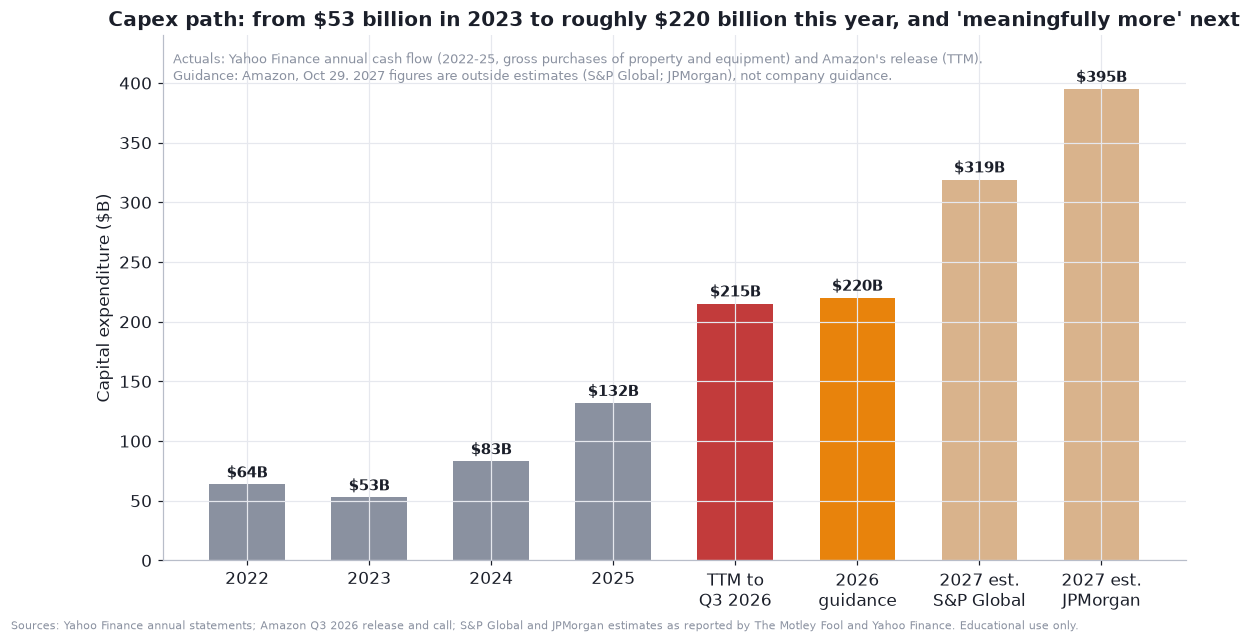
The year-by-year view puts it in scale. Gross purchases of property and equipment were about $52.7 billion in 2023, $83.0 billion in 2024 and $131.8 billion in 2025, on Yahoo Finance’s annual statements. The trailing twelve months through September reached $215.2 billion. Amazon still says cash capex for 2026 will be about $220 billion, and the CFO said third-quarter cash capex was $75.9 billion. Nine-month cash capex is therefore about $172 billion, which leaves only about $48 billion for the fourth quarter to hit $220 billion. A newsletter that read the filing argued that either spending was pulled forward or $220 billion is a floor, and leaned toward the floor. I agree it is the more likely reading, given that Jassy said Amazon is installing an AI accelerator “about every 14 seconds.” For 2027, Amazon says “meaningfully more,” without a number. Outside estimates range from $319 billion (S&P Global, with a $60 billion free cash outflow) to $395 billion (JPMorgan), as reported by The Motley Fool and Yahoo Finance. Those are not company guidance.
Capital spending hits profit with a lag, through depreciation. If an asset costs $C$ and lasts $L$ years, a straight-line schedule charges $C/L$ a year, so depreciation today reflects spending over the last $L$ years, not this year’s.
That is the mechanism behind the bear case on margins. Amazon’s depreciation and amortization was $20.9 billion in the third quarter, up from $16.8 billion a year ago, and $79.4 billion over the trailing year. Gross capex over the same period was $215.2 billion, about 2.7 times that. Net property and equipment has climbed to $508.9 billion from $357.0 billion at the end of 2025, a 43% rise in nine months. Every dollar of that has to earn a return larger than its depreciation, or margins shrink as the assets age. Morningstar’s fair value of $280 assumes returns on invested capital stay in the mid-teens. Amazon says returns will be strong and that it is accelerating “capex payback.” Both are assertions about the future.
How is it being paid for? Partly by operating cash, partly by borrowing, partly by drawing down cash.
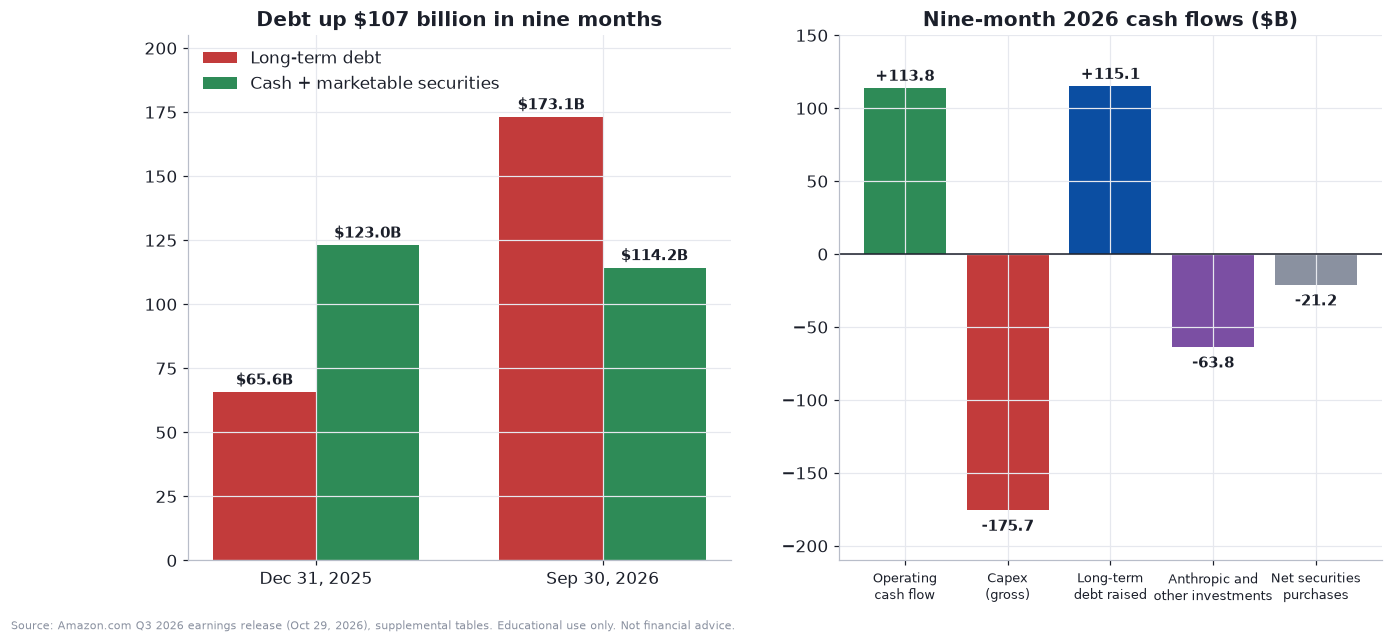
Debt. Long-term debt was $173.1 billion at September 30, up from $65.6 billion at year-end. Nine-month proceeds from long-term debt were $115.1 billion. In July Amazon sold about $24.9 billion of bonds in eight tranches maturing from 2029 to 2066, according to its filings and Reuters, and CNBC’s headline said it would not issue more debt in 2026. Interest expense in the third quarter was $1.7 billion against $0.5 billion a year earlier, roughly three times as much.
Cash. Cash plus marketable securities fell to $114.2 billion from $123.0 billion at the end of 2025.
Other investments. Acquisitions, non-marketable investments and similar items took $63.8 billion in nine months, which includes the $10 billion of Anthropic preferred stock Amazon bought in the second quarter, per its 10-Q as reported by TechCrunch.
Shares. Common shares outstanding rose to 10.81 billion from 10.69 billion a year ago, a 1.2% increase, and stock-based compensation is running near $20 billion a year. The cash flow statement shows no share repurchases.
The balance sheet is strong in absolute terms, with $1.24 trillion of assets and $613.6 billion of equity. But the equity is inflated by paper gains. Accumulated other comprehensive income jumped to $102.3 billion from $28.2 billion in nine months, and the comprehensive-income statement shows $78.8 billion of after-tax unrealized gains on available-for-sale debt securities. I read that as the Anthropic convertible notes being marked up through other comprehensive income rather than through net income, which is how press analyses describe it, but I have not seen the footnote. Other long-term liabilities rose to $99.9 billion from $36.0 billion, and the cash flow statement shows $35.5 billion of deferred income taxes in nine months, which is consistent with taxes owed later on investment gains.
Fundamentals, part five: the Anthropic stake, the antitrust trial and the other risks
Anthropic’s amended S-1, filed Tuesday, gave the clearest picture yet of Amazon’s exposure. Here are the facts, as reported by Yahoo Finance, Crypto Briefing and TechCrunch.
Amazon will hold 14.7% of Anthropic’s total capital stock after the IPO and a concurrent private placement. Google will hold 13.7%. Together that is 28.4%.
Amazon’s holdings are largely convertible notes with $6.2 billion of principal and conversion prices of $2.0928 and $5.0478 a share, plus $10 billion of non-voting preferred stock bought in the second quarter. Amazon’s total cash invested is about $18 billion.
A cap limits how many shares Amazon’s notes can convert into, and Amazon “has elected not to waive” it, according to the filing. Capped, Amazon would hold about 1.92 billion non-voting Class N shares. If every note converted, it would hold about 3.48 billion, or 23.8% of the company.
Anthropic is marketing 825 million shares at $70 to $78, with pricing expected Wednesday evening. CNBC reported, citing sources, that it is likely to price above that range. For the nine months through September, Anthropic reported $33.24 billion of revenue, up about 1,200%, and a $104 billion net loss, mostly from non-cash changes in the fair value of convertible notes.
The arithmetic is simple. The stake’s value is the number of shares times the price.
At $70 the capped stake is worth about $135 billion, and at $78 about $150 billion. If every note converted, the value at $78 would be about $272 billion. Each $1 move in Anthropic’s stock is worth about $1.9 billion to Amazon, or about 0.07% of Amazon’s market value. A secondary analysis of Amazon’s second-quarter 10-Q puts the carrying value of its Anthropic holdings at about $190 billion at June 30. I have not verified that figure.
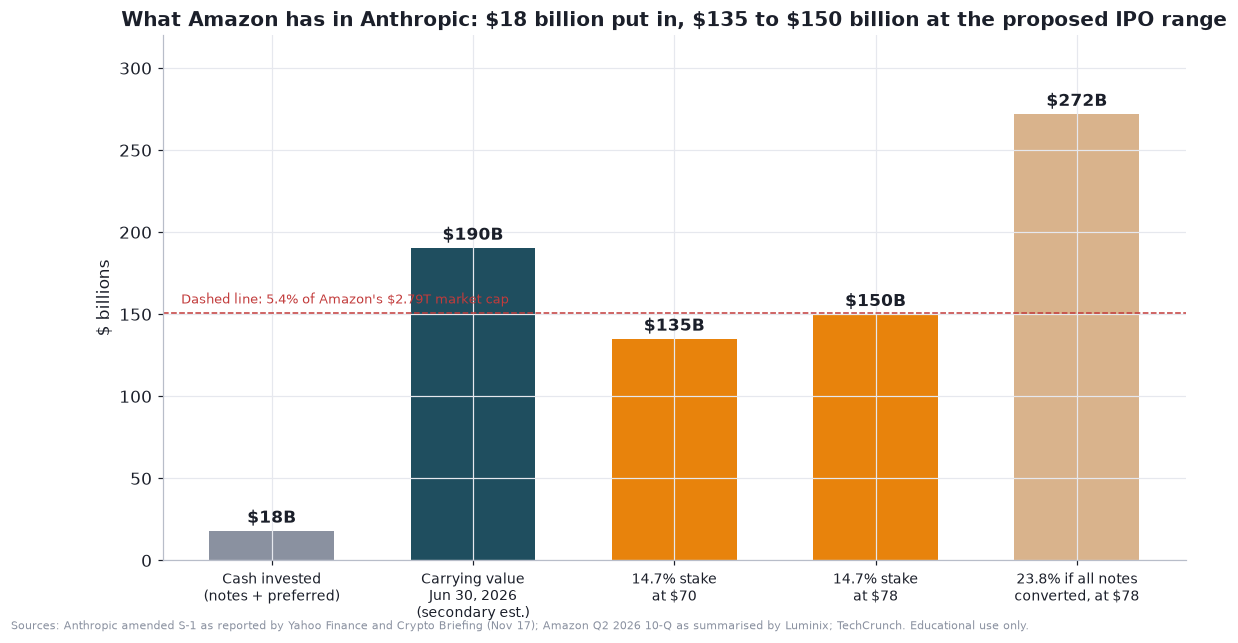
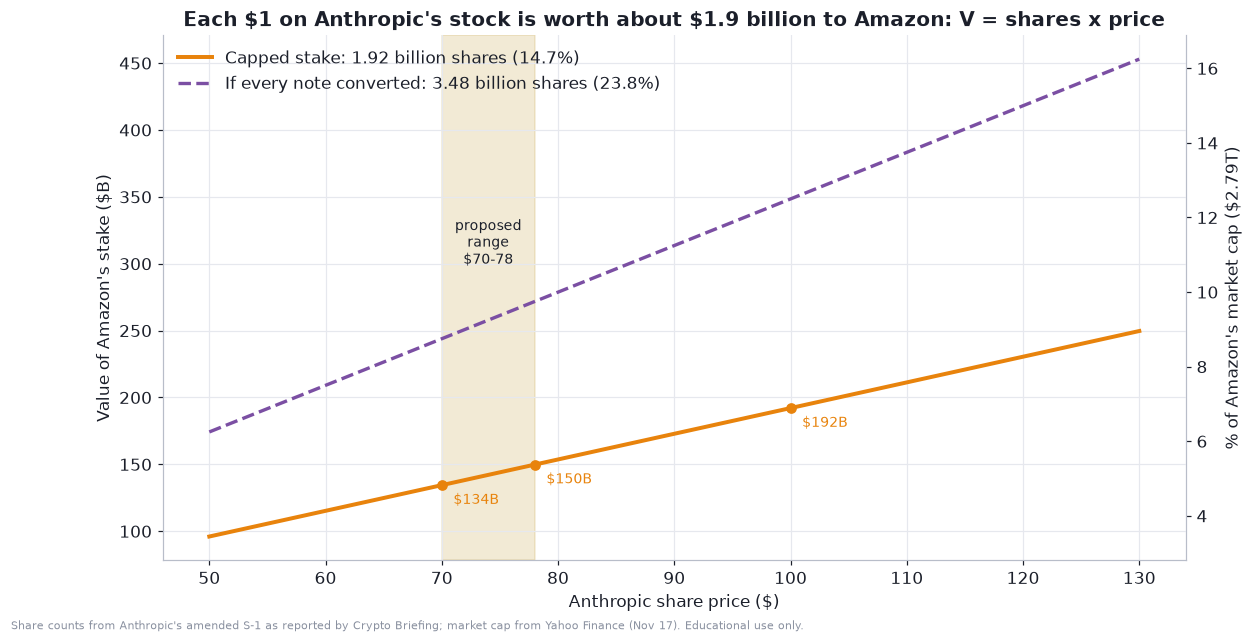
What does that mean for Amazon’s stock? Three things. First, the stake is large but not dominant: about 5% of market value for the capped holding and up to about 10% if every note converted. Second, it is a mark-to-market asset that will now carry a visible daily price, and under normal accounting for equity securities with a readily available price, changes in value run through earnings. Whether and when Amazon’s gains move from other comprehensive income into reported profit, and how it treats the preferred stock, are accounting questions I cannot answer from public sources, but they could make Amazon’s reported EPS far more volatile from the fourth quarter on. Third, Amazon’s operating story is not contingent on the stake. An investor valuing AWS and retail does not need Anthropic to rise, but one valuing the stock on reported earnings will get noise.
Also note the concentration of this one holding in the market’s mind. A failed or stumbling Anthropic debut would hit Amazon’s sentiment well beyond the 5%, because it would call into question the AI demand that fills AWS’s backlog. A strong one would do the reverse. That is why the next two trading days matter more for this stock than the earnings date.
The antitrust trial. The Federal Trade Commission and 17 states sued Amazon in September 2023 in the Western District of Washington, alleging it illegally maintains monopoly power in online retail. A bench trial before Judge John Chun is set for March 29, 2027. On October 9, 2026 the judge denied Amazon’s request to push it to June, saying he had been preparing for the March date, according to the court docket and MLex. The trial will decide liability first, with remedies in a later phase. There is no liability ruling yet and no injunction. A separate trial in the Zulily case is set for March 2028. This is a real overhang, but it is a 2027 event, and the likely outcomes range from a settlement to behavioral remedies to a long appeal.
Other risks. The company’s own call listed energy prices, tariff and trade policy, memory-chip supply and component costs, and recession fears among the uncertainties. Memory prices were singled out as a cost headwind to AWS margins. Customer concentration in the backlog is another. And there is a market-structure risk: Barchart noted that every large technology company that has reported this quarter fell after its report, and that the AI trade “has shown signs of cracking” over capex worries.
Valuation, part one: Amazon against its peers
Start with the cheap-looking numbers and then take them apart. On Yahoo Finance’s data, Amazon has a market value of $2.79 trillion, a trailing price-to-earnings ratio of 20.8, a forward ratio of 23.6, an enterprise-value-to-EBITDA multiple of 16.2, and an operating margin of 13.1%. Revenue growth is 12.1%.
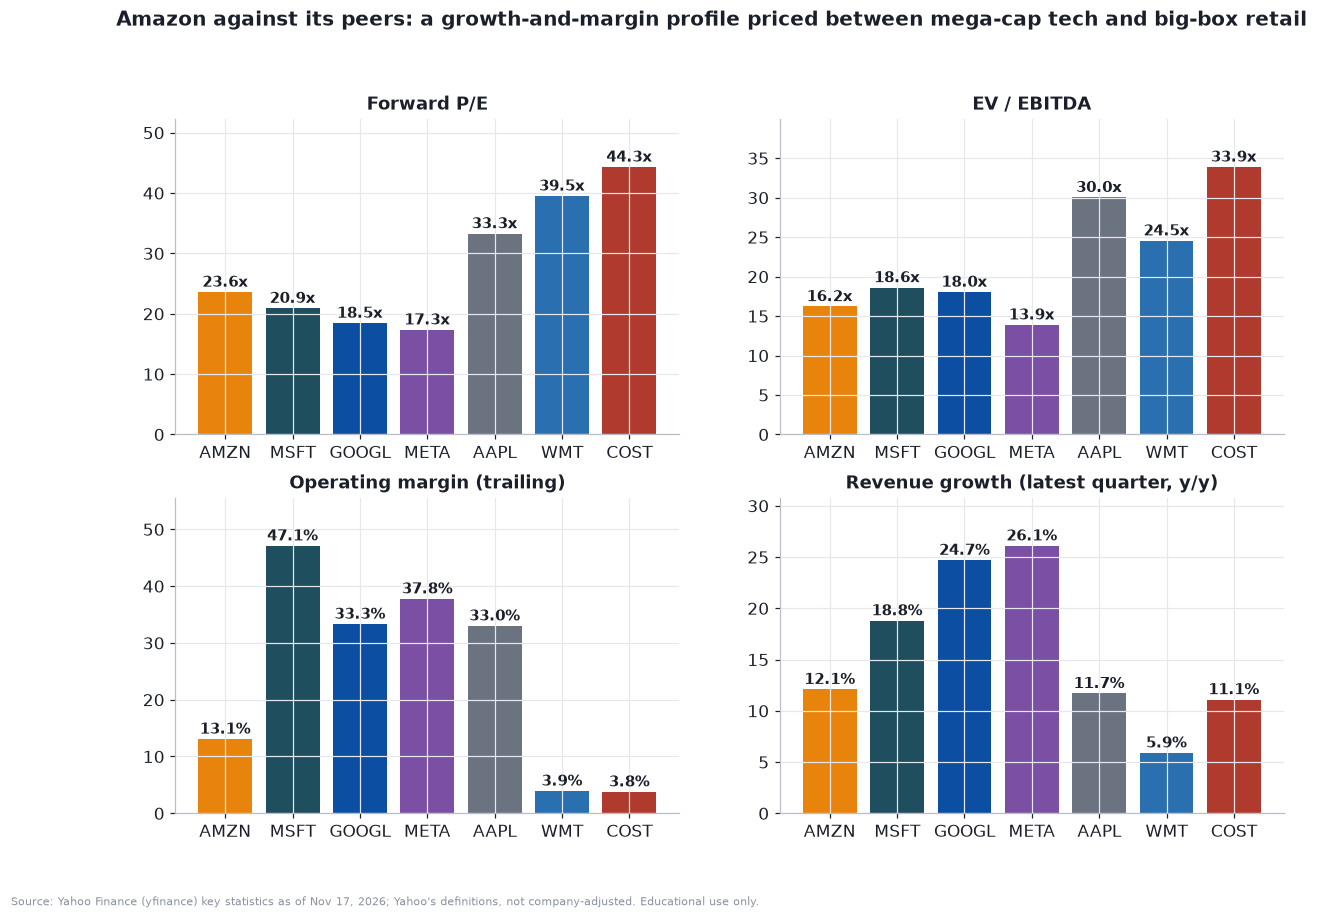
The trailing P/E of 20.8 is flattered. Net income over the last nine months was $113.6 billion against operating income of $79.4 billion, because other income of $68.4 billion, mostly investment gains, sat below the operating line. That is why second-quarter reported EPS was $5.75 against $1.82 expected and the second quarter looked like a miracle. The forward P/E is the better number. It implies consensus forward earnings of about $10.93 a share, which I back out from the forward ratio. Seeking Alpha’s consensus for 2027 is $10.66 of GAAP EPS on $959 billion of revenue. On that basis:
Amazon trades at 23.6 times forward earnings.
Microsoft trades at 20.9 times, Alphabet at 18.5 times, Meta at 17.3 times and Apple at 33.3 times. Walmart is at 39.5 times and Costco at 44.3 times.
On enterprise value to EBITDA the ordering is similar: Amazon 16.2, Alphabet 18.0, Microsoft 18.6, Meta 13.9, Apple 30.0, Walmart 24.5 and Costco 33.9.
The comparison needs care in both directions. Against mega-cap technology, Amazon is not cheap on earnings: it trades at a premium to Microsoft, Alphabet and Meta while earning a far lower operating margin, 13.1% against 47.1% for Microsoft, 33.3% for Alphabet and 37.8% for Meta. Against the retailers it looks reasonable, because Walmart and Costco earn 3.9% and 3.8% margins and trade at 40-plus times forward earnings. Neither benchmark fits a company that is a cloud business with a retail business attached. If Amazon traded at the median forward multiple of the four technology names, 19.7 times, the price would be about $215. At Meta’s multiple it would be about $190, and at Apple’s about $364.
The two things that justify a premium to Alphabet and Meta are growth in AWS and the fact that earnings are depressed by investment spending that may or may not pay. The two things that argue against one are that free cash flow is negative while Microsoft, Meta and Apple still generate positive cash, according to Yahoo’s figures, and that depreciation will keep rising for years.
Analysts are bullish. Of 62 analysts Yahoo tracks, 14 rate the stock strong buy, 45 buy, 3 hold and none sell. The mean price target is $326, the median $328, the high $405 and the low $230, which puts the mean 26% above the price. After the print, Morgan Stanley cut its target to $335 from $350, Goldman Sachs to $370 from $375, and Bank of America to $317 from $320, while Deutsche Bank and Barclays sit at $325 and $365, according to CNBC. Analyst targets tend to cluster above price and to follow it with a lag. I treat them as a statement of sentiment, not an estimate of value.
Valuation, part two: a DCF sketch, run backwards
A discounted cash flow model is only as good as its assumptions, so I run it backwards: instead of asking what Amazon is worth, I ask what you have to believe for $257.89 to be fair. The setup is deliberately simple and entirely mine.
The model starts from estimated 2026 revenue of $827.6 billion, which is nine months of reported sales plus the midpoint of fourth-quarter guidance. Revenue growth starts at 15% in 2027 and fades in a straight line to 3% by 2036. That makes 2027 revenue about $952 billion, close to the $959 billion consensus. Free cash flow margin starts at minus 6% in 2027, which gives a cash outflow of about $57 billion that is close to S&P Global’s estimate of minus $60 billion, and ramps in a straight line to a target margin $m^{*}$ by year seven. After year ten, growth is 3% forever. The discount rate is $r$. Net non-operating assets, meaning cash and securities minus long-term debt plus the Anthropic stake after a 25% haircut for taxes and illiquidity, come to about $42 billion, or $3.84 a share on 11.03 billion fully diluted shares.
The reverse question is what target margin $m^{*}$ makes the model equal the market price.
And what is the discount rate? A standard capital asset pricing estimate is the risk-free rate plus beta times an equity risk premium, blended with the cost of debt.
With the 10-year Treasury at 5.10%, a beta of 1.31 (my one-year estimate against the S&P 500), a 4.5% equity risk premium, long-term debt of $173 billion at an assumed 5% pre-tax cost and a 20% tax rate, the cost of equity is 11.0% and the weighted cost of capital about 10.6%. That is an unusually high discount rate by recent standards, and it is mostly the rate environment: the 10-year yield alone is above 5%.
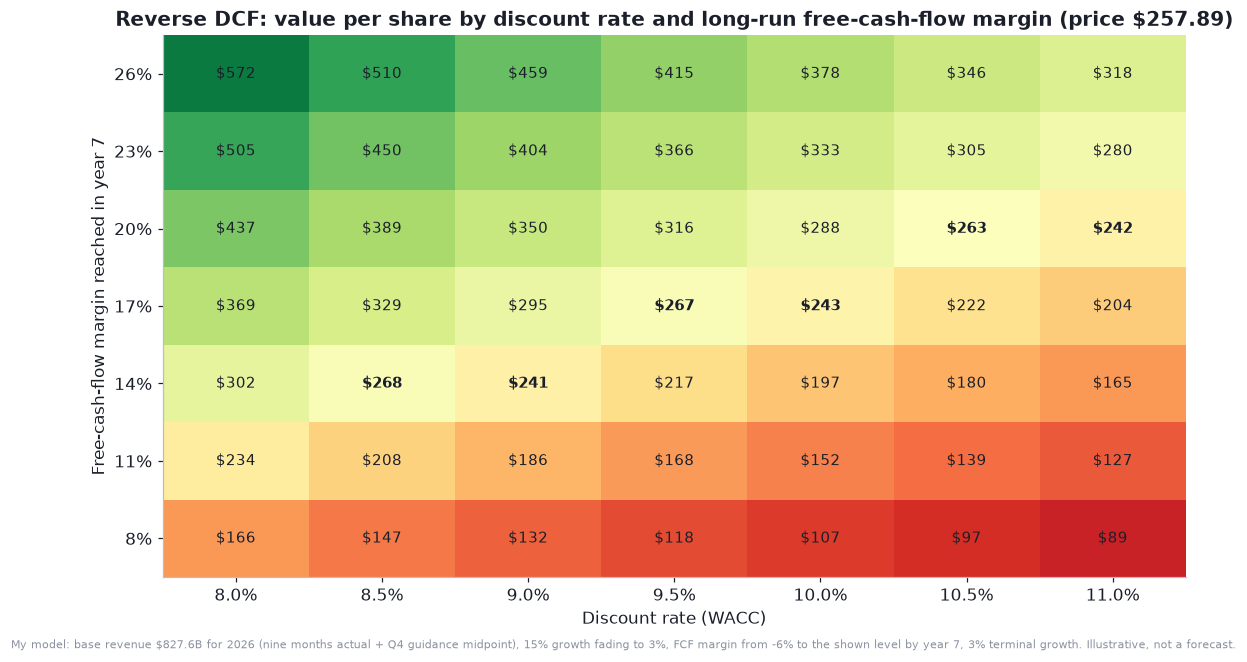
The answers from the grid: the market price is consistent with a long-run free cash flow margin of about 12% if you discount at 8%, 15% at 9%, 18% at 10% and 21% at 11%. At my estimated cost of capital of 10.6%, you need about 20%. Put differently, Amazon would have to turn each dollar of revenue into 18 to 20 cents of free cash flow, after paying for a much larger asset base, within seven years. Today it converts minus 5.3 cents. The company has never done that on a consolidated basis. For context, the trailing operating margin is 13.1%.
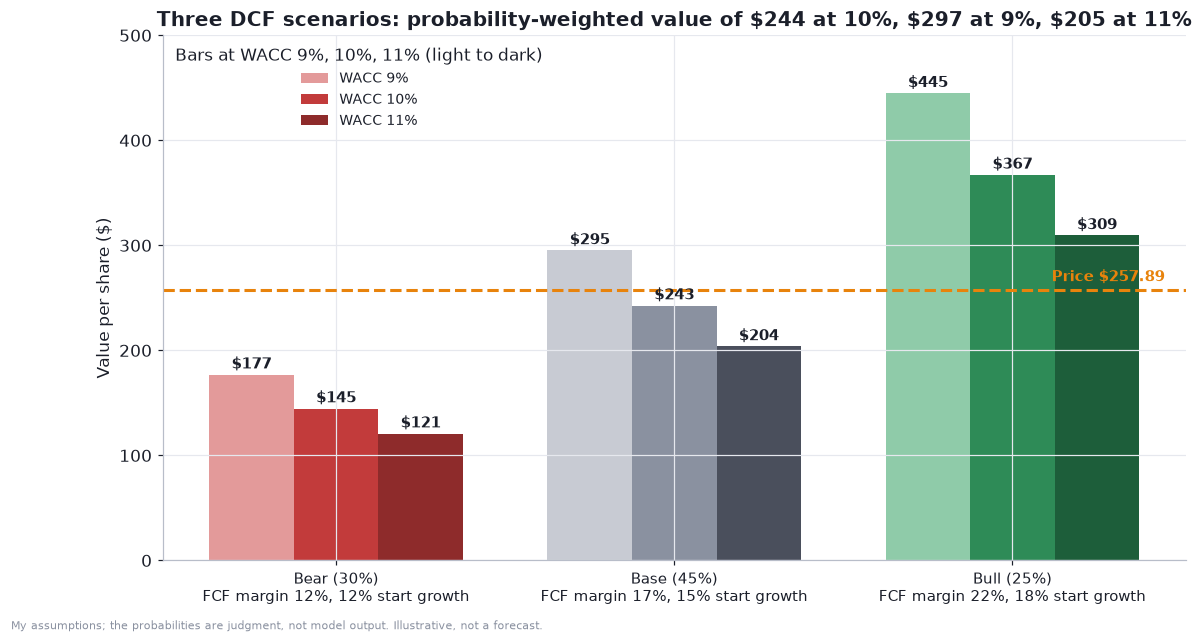
Now three scenarios, with my judgment on the odds. In the bear case (30%), the free cash flow margin reaches only 12%, growth starts at 12%, and the Anthropic stake is worth less. In the base case (45%), the margin reaches 17% and growth starts at 15%. In the bull case (25%), the margin reaches 22%, growth starts at 18%, and the Anthropic stake is worth more, including some value for notes above the cap. The probability-weighted value is the sum of each scenario’s value times its probability.
At a 10% discount rate the three scenarios are worth $145, $243 and $367 a share, and the weighted value is $244. At 9% it is $297, and at 11% it is $205. The price sits above the 10% estimate by about 6% and below the 9% estimate by about 13%, which is a way of saying the stock is fairly valued within the error of the model.
Back to the 18% to 20% question: is it plausible? The mix arithmetic helps. A blended operating margin is the share-weighted average of the segments.
AWS earned a 37.8% trailing margin and is 20.2% of sales. Stores and advertising together, North America plus International, earned 6.8%. Today’s blend is 13.1%. A blended operating margin of about 21% is roughly what a 17% free cash flow margin needs, if capex settles a few points of revenue above depreciation, which is my assumption. The chart shows what it takes to get there. If stores and advertising stay at today’s 6.8%, AWS would have to be nearly half of sales. If they reach 9%, AWS needs about 42% of sales, and if they reach 12%, about 35%. At today’s one-fifth share, even a 12% margin in the stores business gets only to about 15%. So the base case needs both a richer mix and a better retail margin, which is a lot to ask in seven years.
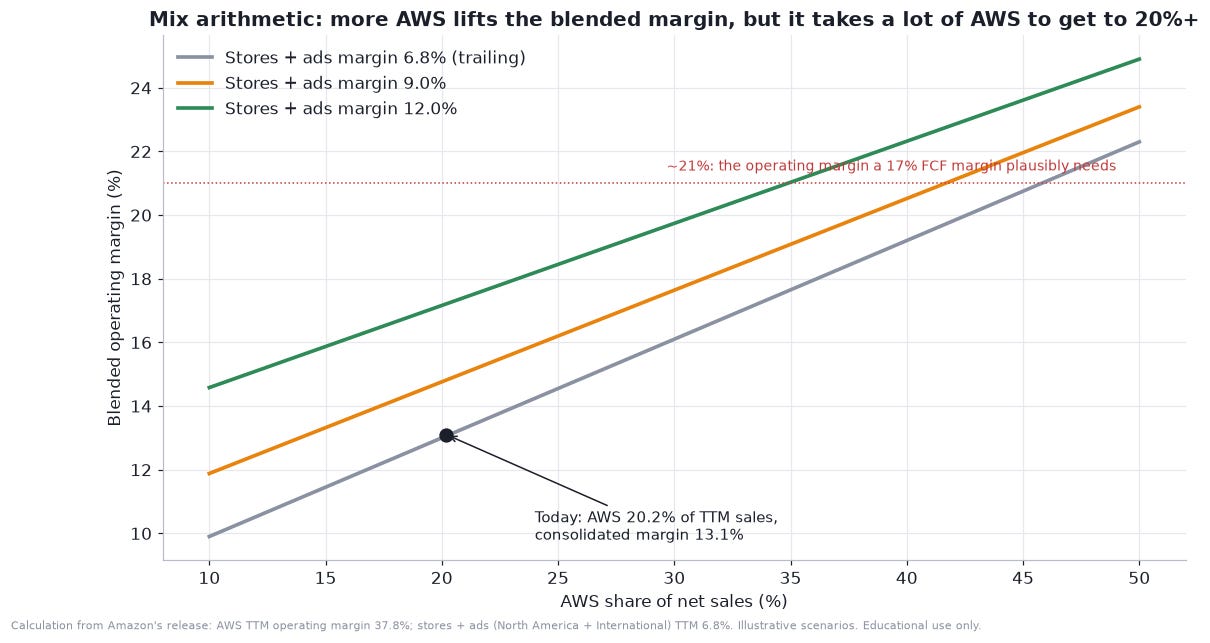
Two cautions. Seventy-one percent of the base-case value is in the terminal value, so the model is mostly a statement about 2033 and beyond. And the base case implies 2036 revenue of $1.95 trillion, 2.35 times today’s estimate, and free cash flow of $331 billion. That is a very large business, and I would not call the model precise. I would call it a way to see how much the answer moves when the discount rate moves one point, which is a lot.
Valuation, part three: a sum of the parts
The other standard approach is to value the pieces. To avoid counting advertising twice, I put it with the stores, because Amazon reports advertising inside the North America and International segments. So there are two operating pieces and a balance-sheet piece.
AWS. Annualized third-quarter operating income is $71.1 billion. At 20 times, 26 times and 32 times, that is $1.42 trillion, $1.85 trillion and $2.27 trillion. I use annualized current-quarter income because AWS’s profit is growing quickly and the trailing figure of $61.0 billion understates the run rate.
Stores and advertising. Trailing segment operating income from North America and International is $43.3 billion. At 16, 21 and 26 times, that is $694 billion, $910 billion and $1.13 trillion. The trailing figure is a better basis here because the third quarter was held back by the Prime Day shift.
Net non-operating assets. Cash, securities and the Anthropic stake after a 25% haircut, minus long-term debt: $22 billion in the low case, $42 billion in the base and $99 billion in the high, which counts half of the notes above the cap.
The totals are $2.14 trillion, $2.80 trillion and $3.50 trillion, or about $194, $254 and $317 a share on 11.03 billion diluted shares. The market’s value at $257.89 is $2.85 trillion on that share count. The market is pricing roughly the base case: AWS at 26 times annualized operating income and the stores business at 21 times trailing.
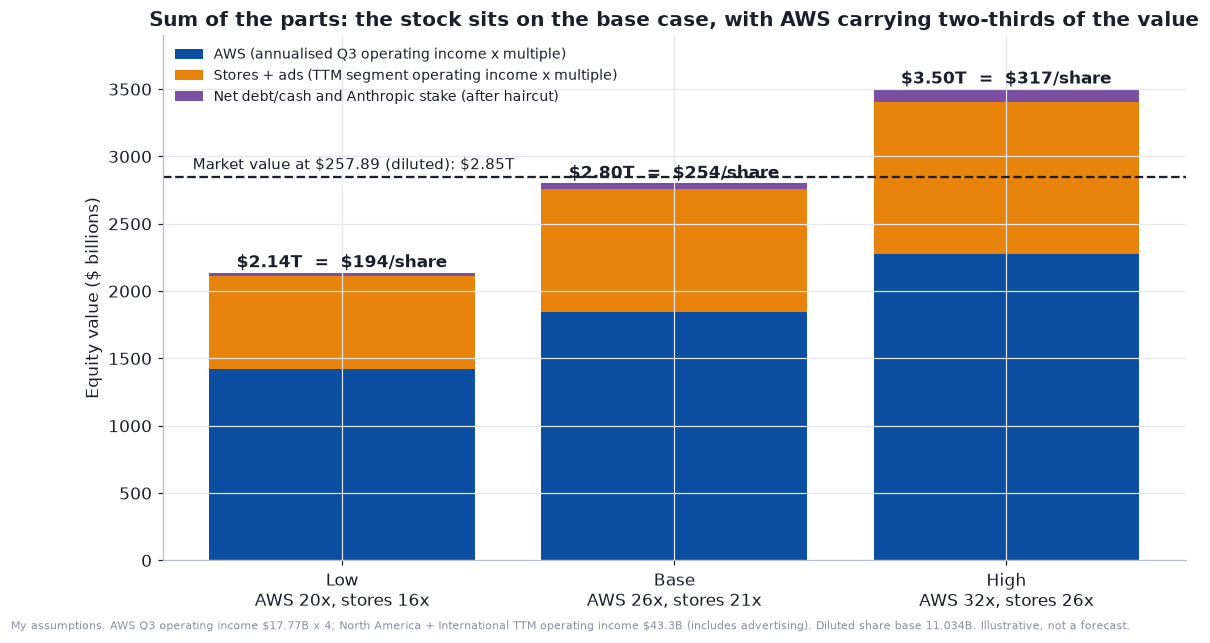
Two limits. Earnings multiples ignore capex intensity, which is the main point of debate, so I used multiples that are modest for a business growing 39%. And the sum of the parts values AWS on profit today while the DCF values it on profit in 2033, so the two are not independent checks. Together they say the same thing: the stock is priced for the base case, with AWS carrying about two-thirds of the value.
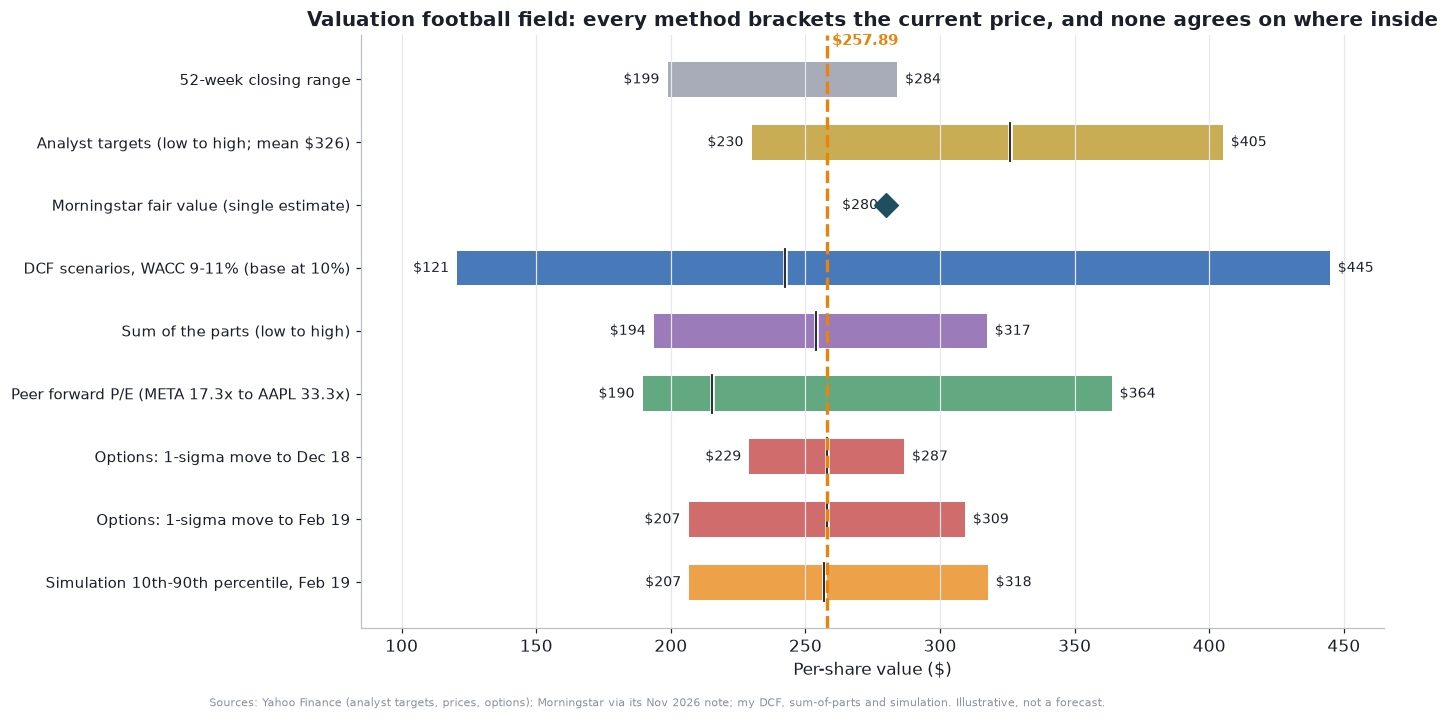
The football field puts every method on one scale. The 52-week closing range runs from $199 to $284, analyst targets from $230 to $405 with a mean of $326, Morningstar’s fair value is $280, my DCF scenarios span $121 to $445 depending on case and discount rate, the sum of the parts runs from $194 to $317, and the peer-multiple range from $190 to $364. The options market’s one-standard-deviation range to February 19 is $207 to $309. Every method brackets the price. None of them agrees about where inside the range it belongs. That is what fair pricing with high uncertainty looks like.
The risks, in order of how much they could matter
Capex returns. If AWS growth of 39% to 40% holds and margins hold near 38%, the investment pays. If growth slows before the assets have earned back their depreciation, or if AI pricing falls faster than costs, operating margin falls while capex stays high. This is the central risk because it affects the cash flow in every year of the DCF.
Funding and rates. Free cash flow is negative, debt has more than doubled in nine months, interest expense has tripled, and the 10-year yield is above 5%. Another $100 billion-plus of borrowing next year is conceivable. The balance sheet can handle it, but the equity cost of capital rises with the debt.
The Anthropic loop. A weak IPO or a failure of Anthropic to keep up with its compute commitments would hit both the stake and the backlog. The company’s biggest AI customer is also its biggest investment.
Retail growth and costs. Online stores grew 7.8% over the last two quarters combined, which is solid but not spectacular. Fuel, wage and tariff costs matter, and management said fuel inflation will be higher in the fourth quarter. A consumer slowdown would show up in North America first.
The FTC trial in March 2027, and related state and private cases.
Concentration and sentiment. The newsletter’s reading of the 10-Q names OpenAI and Anthropic as the two large new backlog customers, so a large share of future AWS revenue depends on a handful of AI labs. And the AI trade is sentiment-sensitive: all the big reporters fell after their prints this quarter.
The technical picture
The chart is constructive and unspectacular. Amazon is $257.89, above all four of the averages most traders watch.
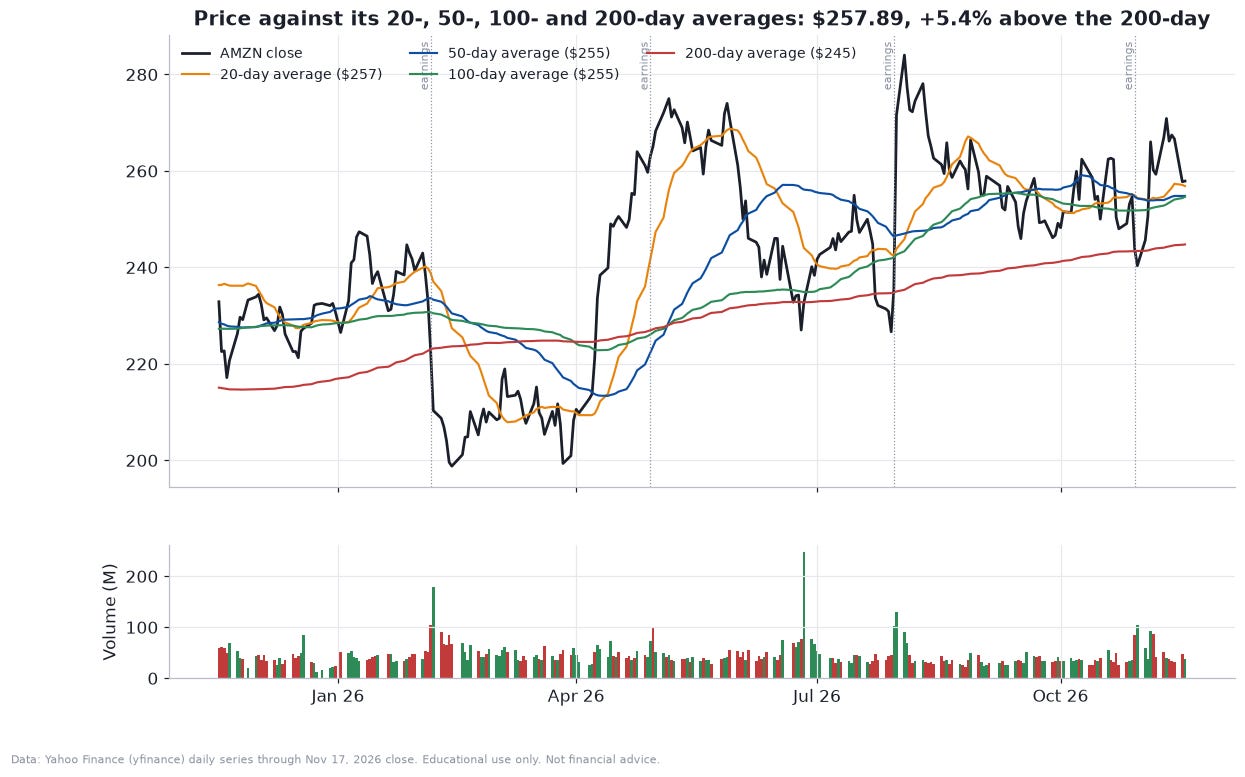
The 20-day average is $256.86, the 50-day $254.81, the 100-day $254.62 and the 200-day $244.76. Price is 5.4% above the 200-day. The first three are bunched within about $2, which says the stock has gone nowhere for two months.
The 50-day crossed above the 200-day on May 6, 2026 (a golden cross) and has stayed above it. That is a lagging signal, and it has whipsawed: the averages crossed down on March 11 before crossing back up on May 6, and there were also crosses in April and July 2025.
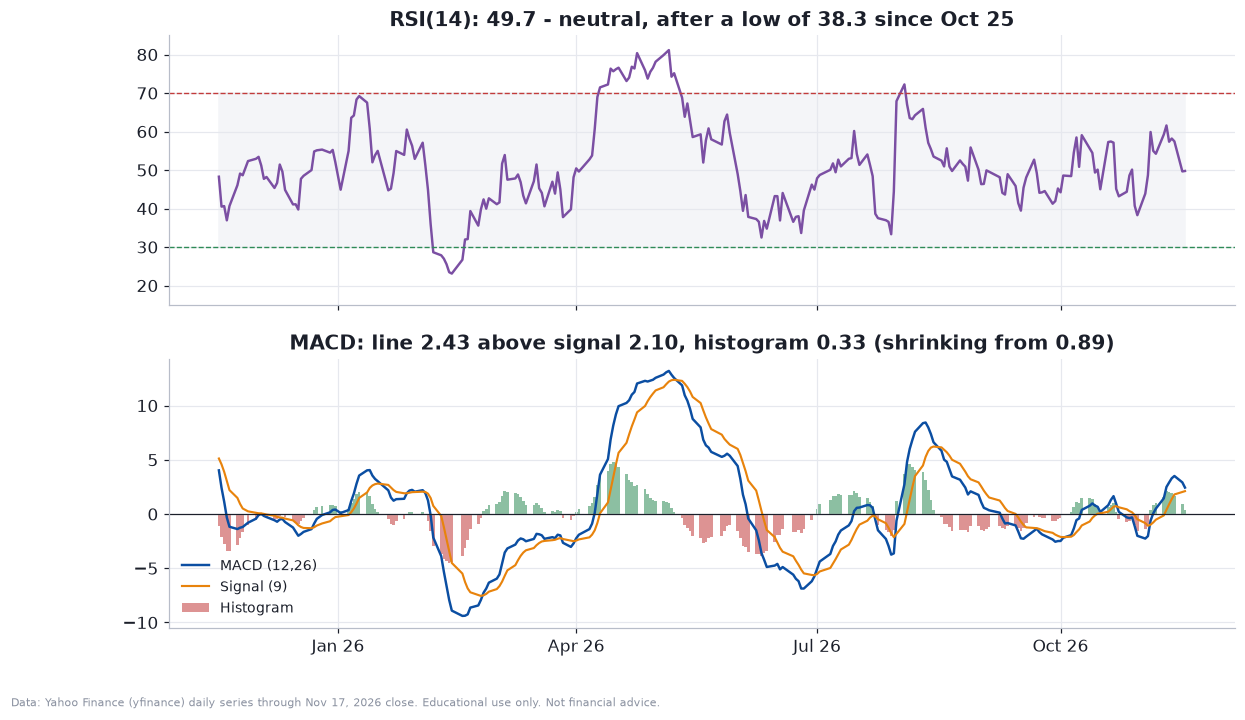
RSI(14) is 49.7, dead neutral, after dipping to 38.3 in the post-earnings drop. It is a momentum oscillator that compares average gains to average losses.
MACD is the difference between a fast and a slow exponential average, compared with its own smoothed signal. The line is at 2.43, above the signal at 2.10, but the histogram has shrunk to 0.33 from 0.89, which means upward momentum is fading.
Average true range is $11.21, or 4.3% of the price. That is the typical daily range once overnight gaps are included. Bollinger bands (20-day, 2 standard deviations) run from $238.89 to $274.83, and the price sits at 53% of the band, in the middle.
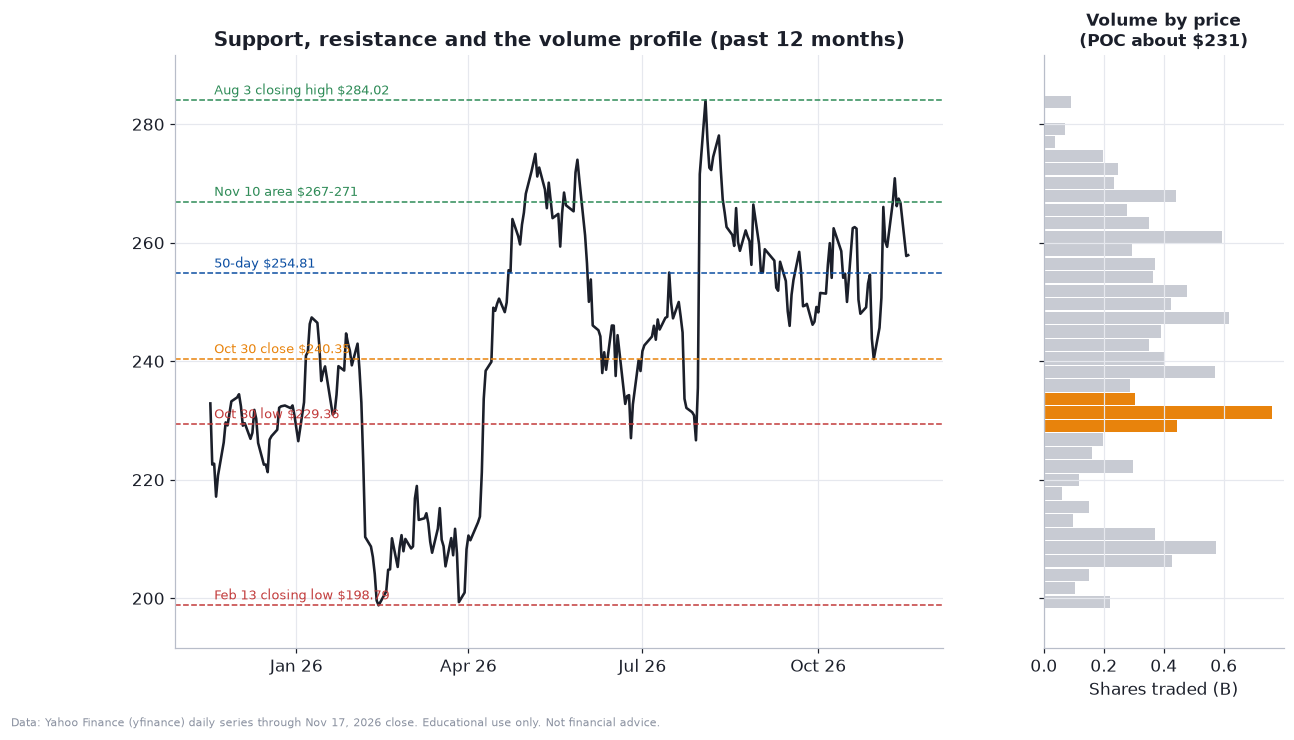
Support and resistance. Looking at price pivots and where volume has traded, the levels I would watch are: $240.35 and $229.36, the close and the low of October 30 (the post-earnings gap); the 50-day line near $255, which has been a magnet; $271 to $275, the November 10 close and the November 9 intraday high; and $284.02, the August 3 closing high, with $287.20 as the intraday high. Below, the February 13 closing low of $198.79 matters. The volume profile’s point of control, the price with the most trading over the last year, is about $231. The stock has traded well above that level since October 30, which makes it a reference point rather than current support.
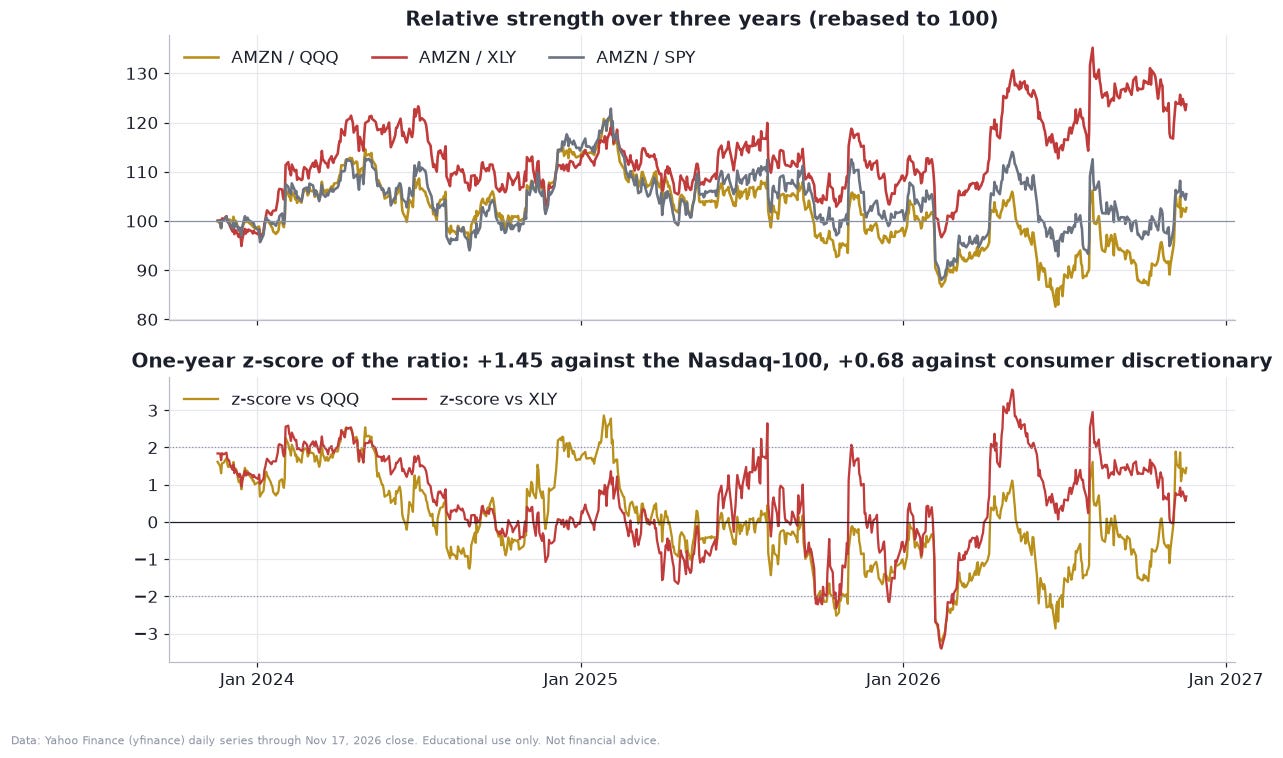
Relative strength. Amazon has outperformed the Nasdaq-100 by 1.4% over the past year and the consumer discretionary ETF (XLY) by 7.5%. On a one-month basis it has held up while Alphabet fell 18.6%, Meta 12.3% and Nvidia 28.4%. In the past month Amazon is down only 1.7%, against 8.5% for QQQ. The ratio of Amazon to QQQ has a one-year z-score of 1.45, meaning it is 1.45 standard deviations above its one-year average, and the ratio to XLY is 0.68. The ratio to a benchmark is useful to see whether a move is the stock’s or the market’s.
Technical summary. The trend is up since April, the stock has absorbed a bad earnings reaction and recovered it, and relative strength is positive. What is missing is momentum: the histogram is shrinking and the range between $240 and $275 has contained the price since the print. A close above $275 and then $284 on rising volume would be a breakout. A close below $240 would put the October 30 low of $229 in play and would likely end the recovery.
Quant, part one: what the return distribution actually looks like
Everything in the next sections rests on a few facts about how this stock moves. I use daily closing prices adjusted for splits from Yahoo Finance, from late 2015 through today’s close, 2,734 daily returns in all. The log return is the natural quantity, because it adds across days.
Over the last five years Amazon’s annualized volatility is 36.6%, its mean return is 7.3% a year, its skewness is 0.13 and its excess kurtosis is 5.1. A normal distribution has excess kurtosis of zero. A value of five means large days of either sign happen far more often than a bell curve says. The Jarque-Bera test rejects normality with a p-value that rounds to zero. The worst day in the sample was minus 15.1% on April 29, 2022, and the best was plus 14.3% on July 31, 2026, the day after the second-quarter report. Over the last year the skew is positive (1.19) because of that single day.
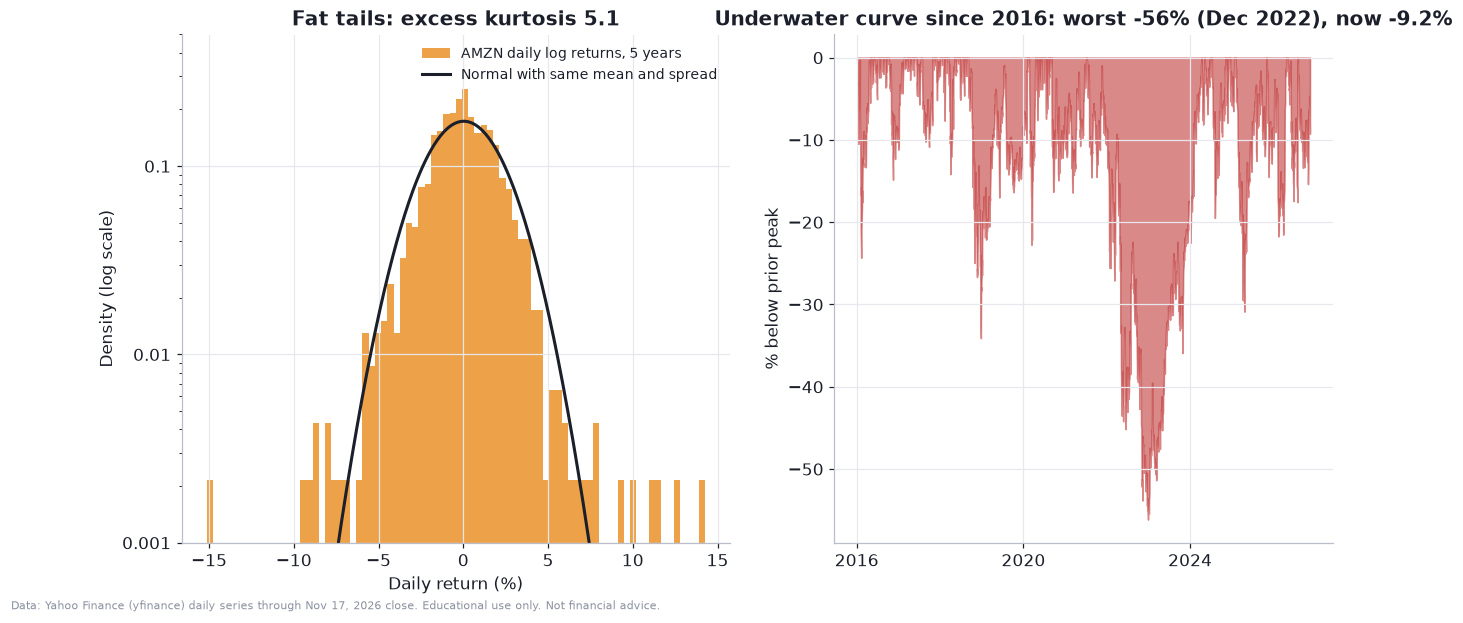
The right panel is the more sobering view. The stock fell 56.1% from its July 2021 peak to its December 2022 trough, and it has spent 19% of the days since 2016 more than 20% below a prior high. It is now 9.2% below its August 3 high. A holder of this stock has to be ready for drawdowns of that size, and the volatility estimates below are what quantify the risk.
Returns themselves are essentially unpredictable from their own past: the first-order autocorrelation is 0.003. Squared returns are another matter, with a first-order autocorrelation of 0.13, which is the signature of volatility clustering. Quiet days follow quiet days, and large days cluster. That is the structure a GARCH model captures.
Quant, part two: a volatility model
The standard model is GARCH(1,1) with Student-t innovations. Today’s variance is a weighted mix of a long-run level, yesterday’s squared shock, and yesterday’s variance.
I fit it by maximum likelihood to daily returns from 2019 to today. The estimates are $\alpha=0.062$ and $\beta=0.917$, so persistence is $\alpha+\beta=0.979$ and the tail parameter is $\nu=5.0$, which confirms the fat tails. Persistence close to one means shocks to volatility die out slowly. The half-life of a shock, the time for it to decay to half its size, and the long-run variance follow directly.
The model’s current conditional volatility is 37.2% a year, a little above its long-run level of 35.1%. That puts it between two simpler estimates: a 20-day realized volatility of 40.1%, which sits in the 75th percentile of the past five years, and a 60-day realized volatility of 32.0%. A one-year figure is 33.5%, and a standard exponentially weighted estimate is 36.0%. The five-day realized volatility is only 25.2%, which shows how calm the past week has been after the post-earnings turbulence. Forecast volatility over the next 5 days to the next year runs from 35.9% to 35.3%, so the model expects little change.
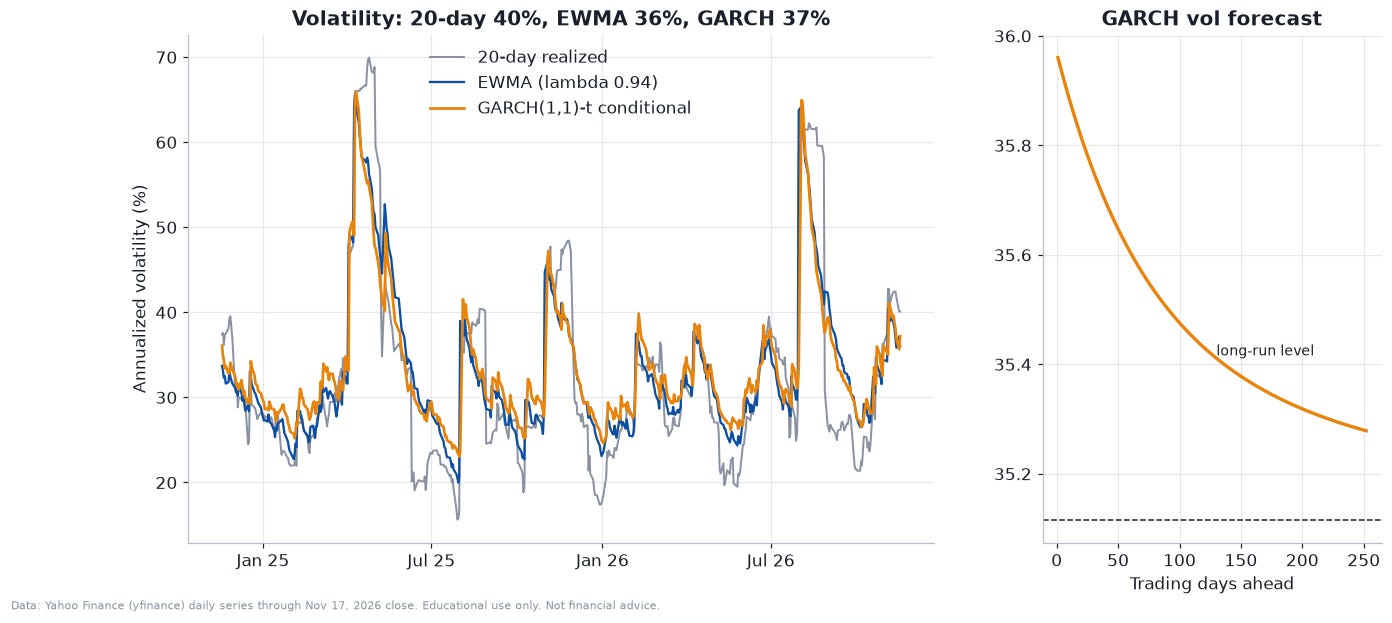
Why does it matter? Because every risk and option number later in the article scales with volatility, and a stock that moves 36% a year is much riskier than the 20% of the S&P 500 index. Over 22 trading days (to the December 18 futures expiry) one standard deviation of price is about 10.6%, to $258 give or take $27. Over 64 days (to February 19) it is 18.0%.
Quant, part three: betas and what drives the stock
A beta measures how much a stock moves with a benchmark. It is the slope of a regression of the stock’s daily return on the index’s.
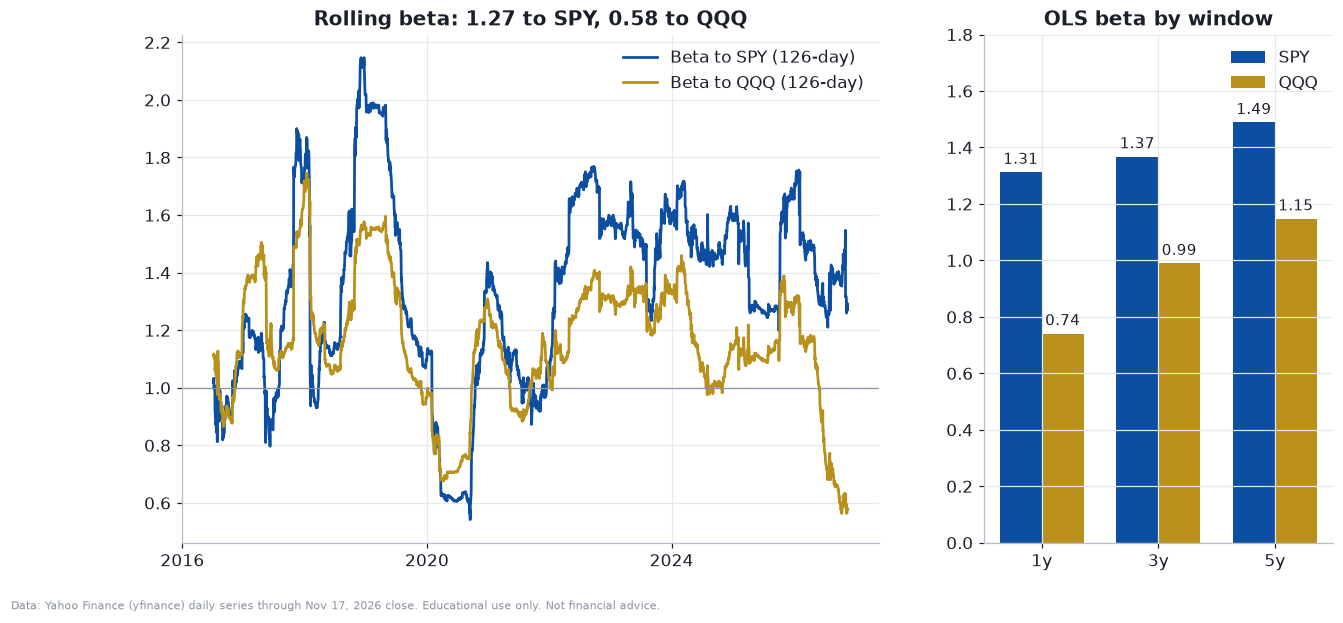
Amazon’s beta against the S&P 500 is 1.31 over one year, 1.37 over three and 1.49 over five. Against the Nasdaq-100 it is 0.74, 0.99 and 1.15. The one-year beta has an R-squared of 0.29, which means about 70% of the stock’s variance is its own. The 126-day rolling beta is lower still, at 1.27 against the S&P 500 and 0.58 against the Nasdaq-100. In the past year, Amazon has been less tied to the large technology names than its history says. The correlation of its daily returns with Alphabet is 0.60 over a year, Microsoft 0.44, Meta 0.41, and Nvidia only 0.22. The strongest link is to the consumer discretionary ETF (XLY), at 0.72. That is the real message: Amazon trades as half a retailer.
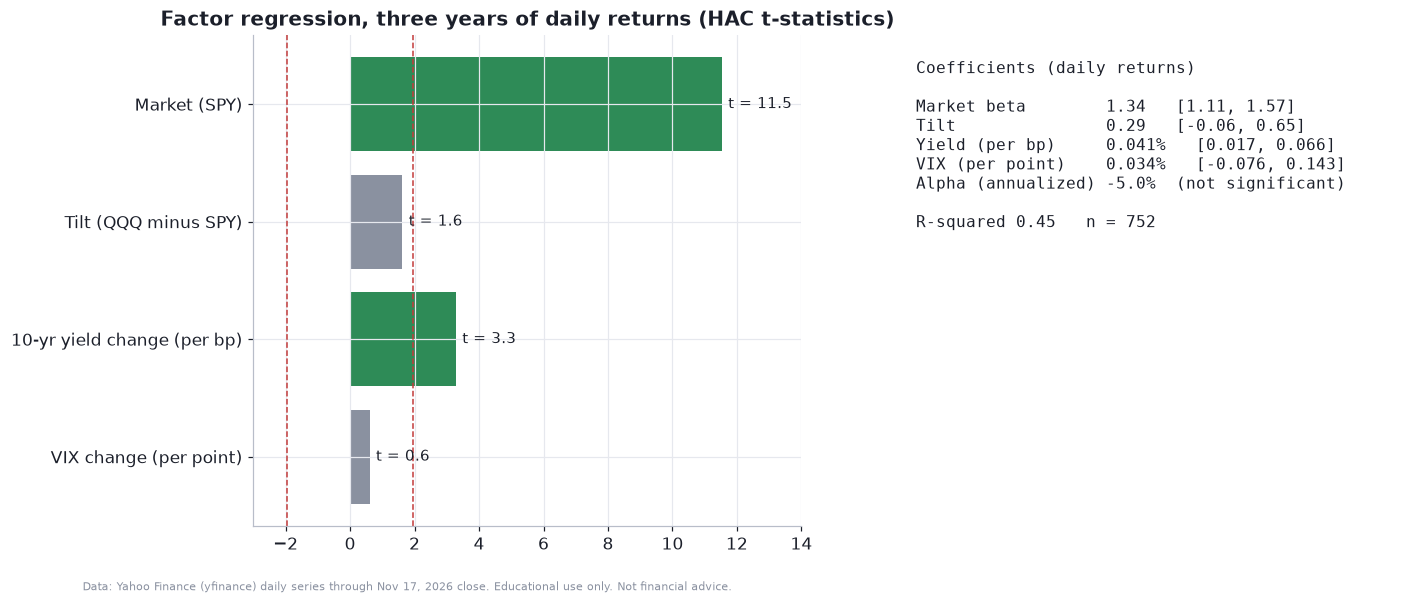
A more careful test regresses the stock on several factors at once. Over the last three years (752 days) I regress on the S&P 500, a tilt factor that is Nasdaq-100 minus S&P 500 (a growth-versus-broad-market measure), the change in the 10-year yield, and the change in the VIX. The standard errors are corrected for autocorrelation and heteroskedasticity by the Newey-West method.
The results are as follows. The market beta is 1.34 with a 95% confidence interval from 1.11 to 1.57. The tilt coefficient is 0.29 with an interval from minus 0.06 to 0.65 (p = 0.11), so I cannot say Amazon is a growth stock rather than a broad-market stock. The annualized alpha is minus 5.0% with a t-statistic of minus 0.39, which is statistically no different from zero. The rate sensitivity is positive and statistically significant, but I would not read it as a law of nature, since it may simply reflect a sample in which yields tended to rise on good economic news. The VIX term is not significant. The R-squared is 0.45. The conclusion: over the last three years Amazon earned what its market exposure predicted, no more and no less, and the stock has been a levered bet on the market, not a source of alpha.
Quant, part four: a Monte Carlo cone and the probability of touching a level
To turn the volatility model into price distributions, I simulate 20,000 paths of 252 trading days. Each day’s return is drawn by bootstrapping the model’s standardized residuals, which keeps the fat tails, and then scaling by the model’s volatility forecast. The drift is set to the risk-free rate, which is the 13-week Treasury bill yield of 4.14%, with a small correction so that the mean of the simulated price equals the forward price. Without the correction, the mean drifts above the forward because the average of exponentials exceeds the exponential of the average, which is Jensen’s inequality.
I use the risk-neutral drift on purpose. This is a calculation of what the price distribution looks like given the current volatility, not a forecast of where Amazon will go. The cone below shows the result.
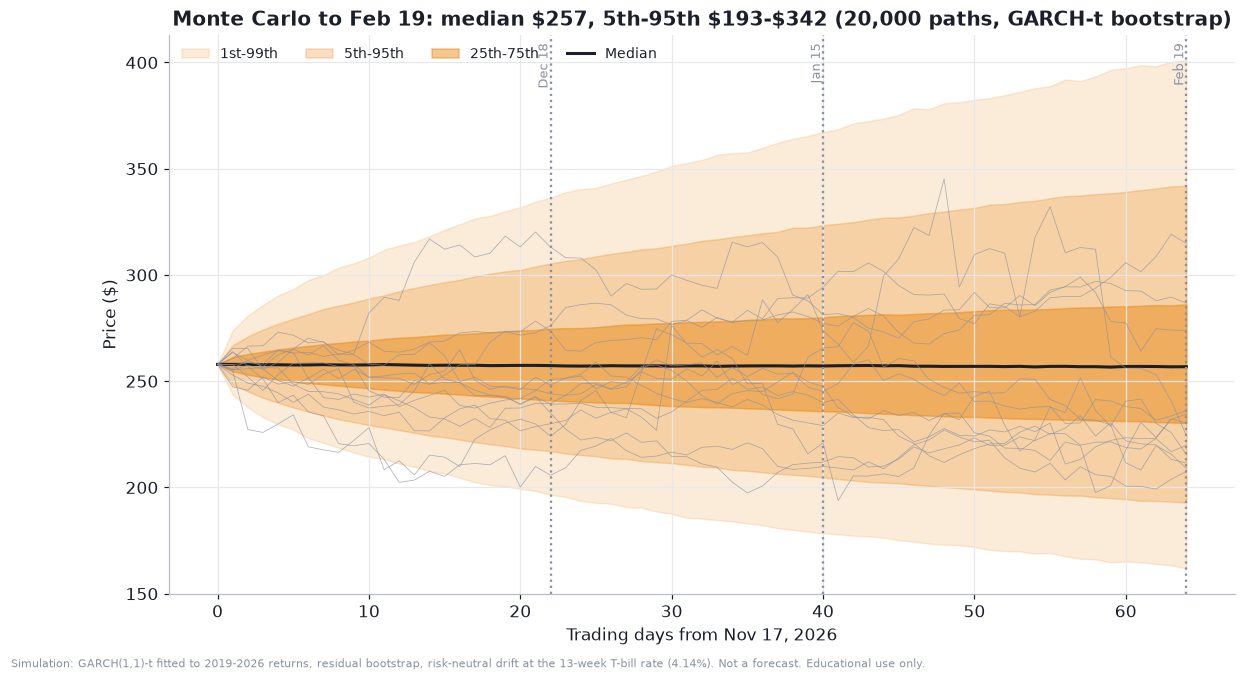
The simulated percentile prices are:
To December 18 (22 trading days): the 5th percentile is $217, the median $257 and the 95th $305.
To February 19 (64 days): the 5th is $193, the 25th $230, the median $257, the 75th $286 and the 95th $342.
To one year (252 days): the 5th percentile is $140, the median $253 and the 95th $445. The mean is $268.8, which equals the forward price.
The median is below the mean because prices cannot go below zero and have unlimited upside. The probability that the price ends above today’s close on February 19 is 49%. The probability it ends above the August high of $284 is 27%, and the probability it ends below $240 is 34%. Over a year, the median simulated maximum drawdown is 30%, and even in the mildest 5% of paths it is 15%.
Touching a level is different from ending above it. The probability that the price touches level $B$ at any time before expiry is higher than the probability it is above $B$ at expiry. For a driftless log price with volatility $\sigma$ over time $T$, the reflection principle gives a closed form, which I compare with the simulation.
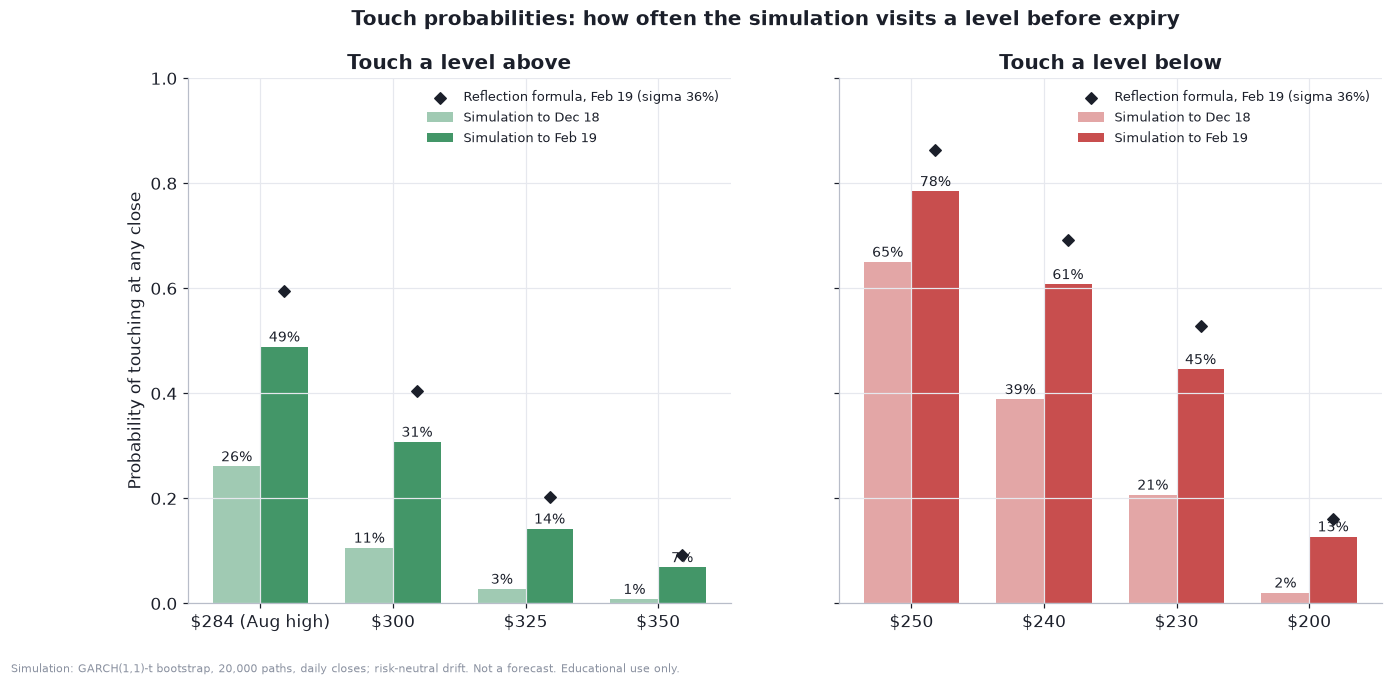
By February 19, the simulation says there is a 49% chance of touching the August high of $284 on a daily close, 31% of touching $300, 14% of $325 and 7% of $350. On the downside there is a 78% chance of touching $250, 61% of touching $240, 45% of $230 and 13% of $200. The closed form gives higher numbers than the simulation because it assumes a constant 36% volatility and continuous monitoring, while the simulation uses daily closes. Taken at face value, a close below $240, 7% under today’s price, is more likely than not to happen at some point in the next three months, and the August high is close to a coin flip. A stop-loss placed 5% below the price would be touched most of the time. That is useful when you set stops and targets.
Quant, part five: value at risk and expected shortfall
For a position of $100,000 in Amazon stock, how much could it lose in a day or in ten days? Value at risk at confidence $c$ is the loss that will be exceeded only with probability $1-c$. Expected shortfall, also called CVaR, is the average loss in the days when that threshold is exceeded.
On the historical five-year sample, one-day 95% VaR is $3,456 and expected shortfall $5,185. At 99%, VaR is $5,747 and shortfall $8,204. A normal curve with the same standard deviation gives a 99% VaR of $5,332 and shortfall of only $6,113, so it understates the tail by 25% at the shortfall level. The GARCH simulation gives $5,539 and $7,635. Over ten days, the GARCH 95% VaR is $11,069 and shortfall $14,632, and the 99% numbers are $16,846 and $20,204. For the same ten-day 99% measure, the historical sample says $21,199 and $26,490, which is the worst of the three, because the sample includes the 2022 bear market.
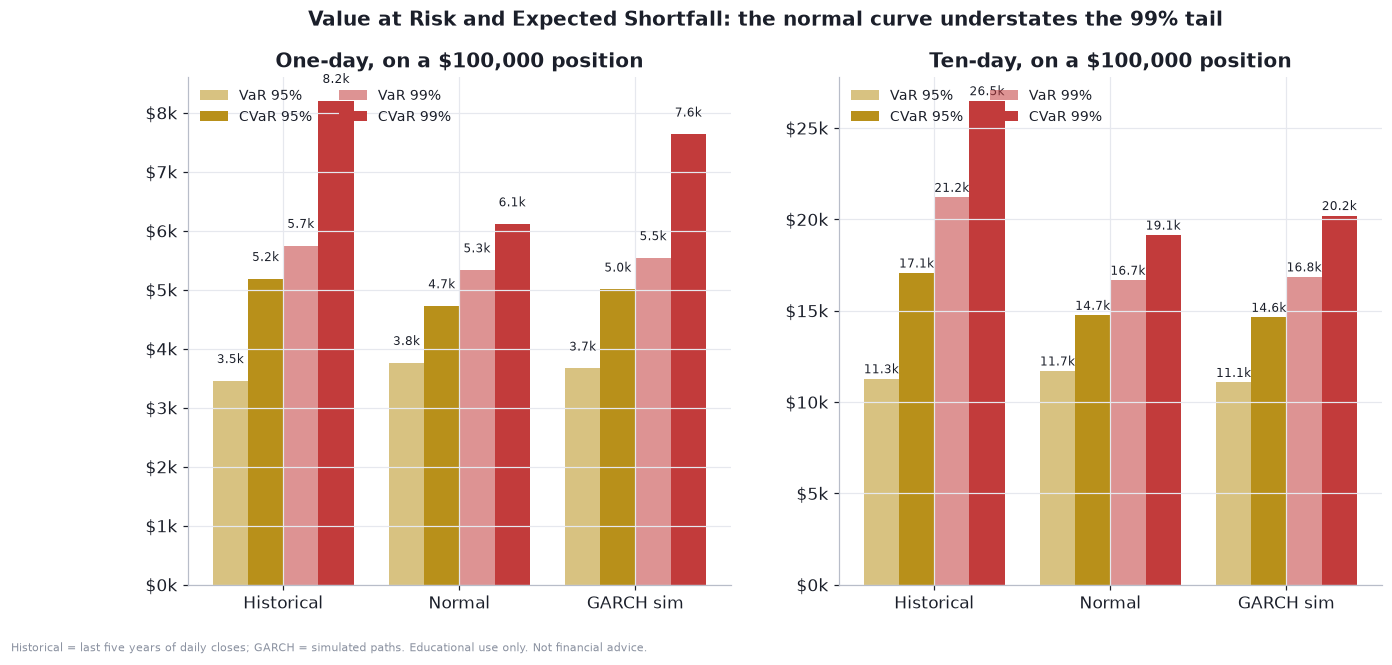
A few lessons. First, the normal approximation is acceptable at 95% and clearly inadequate at 99%. Second, the dollar figures are small relative to the position, around 3% to 6% for a day, but the ten-day shortfall is about 15% to 26%. Third, none of these says anything about overnight gap risk around earnings, which is bigger.
Quant, part six: what the options market is saying
Options prices embed the market’s forecast of volatility. Using bid-ask midpoints from the Yahoo Finance option chains after today’s close, I back out Black-Scholes implied volatilities with no dividend (Amazon pays none) and a 4.14% rate.
A handy rule of thumb connects the at-the-money straddle, a call and a put at the same strike, to the expected absolute move. For small $T$, its price is roughly 80% of the standard deviation times the price.
The numbers: the December 18 straddle costs $22.90, which is 8.9% of the price, and the implied volatility is 38.2%. January 15 costs $30.13 (11.7%, 36.5% implied volatility), February 19 costs $40.94 (15.9%, 39.5%), and March 19 costs $45.42 (17.6%, 38.5%). A straddle that is 15.9% of the price three months out says that the market expects Amazon to end the period roughly 16% away from today’s price, in either direction, on average. The one-standard-deviation range implied by February’s volatility is $207 to $309.
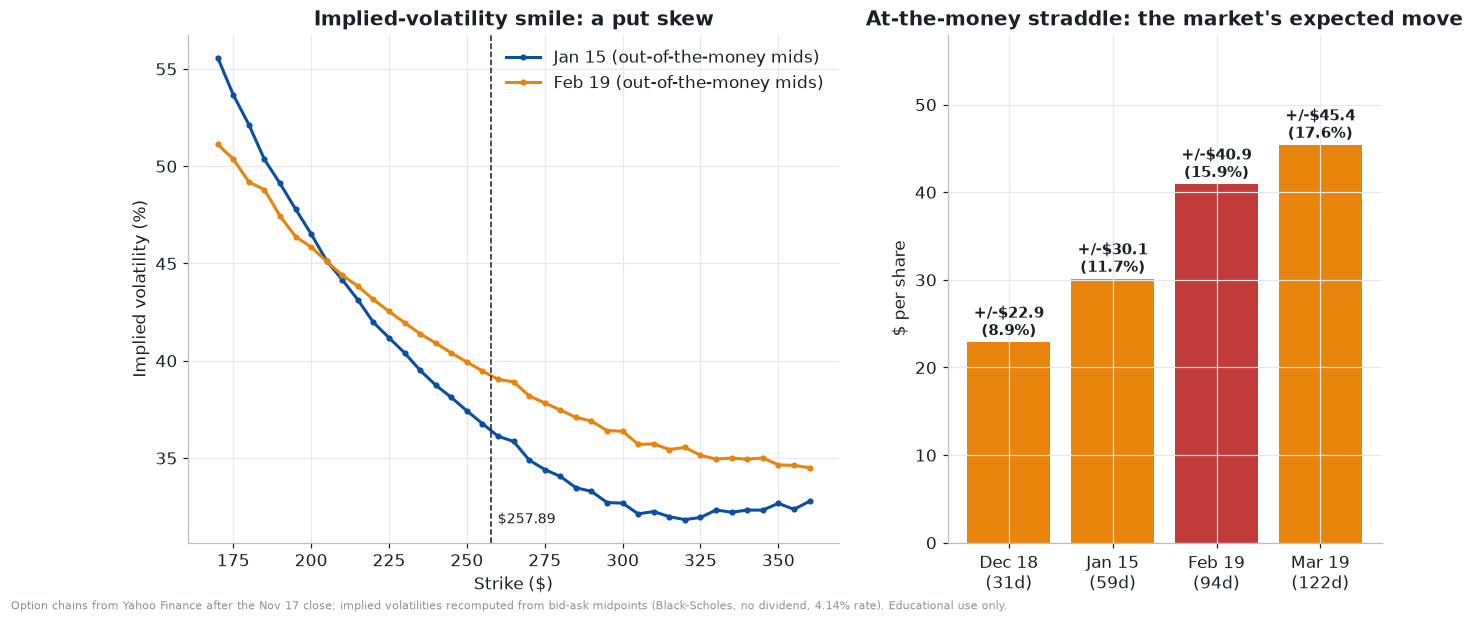
The smile is a put skew: out-of-the-money puts cost more volatility than calls. For January, the 90%-of-spot ($230) put has an implied volatility of 40.4%, against 33.5% for the 110% ($285) call, a gap of 6.9 points. For February the gap is 4.9 points, with 42.0% on the put and 37.1% on the call. This is typical for stocks: investors pay for downside protection.
The term structure carries a message too. The forward volatility, the volatility implied for the period between two expiries, can be backed out from total variance.
Between December 18 and January 15 the forward volatility is 34.6%. Between January 15 and February 19 it jumps to 44.0%. The jump is the fingerprint of a scheduled event inside that window, which I take to be the fourth-quarter earnings report, expected around the start of February. That is my inference, since the window could also contain other news. Treating the extra variance as a single jump gives its implied size.
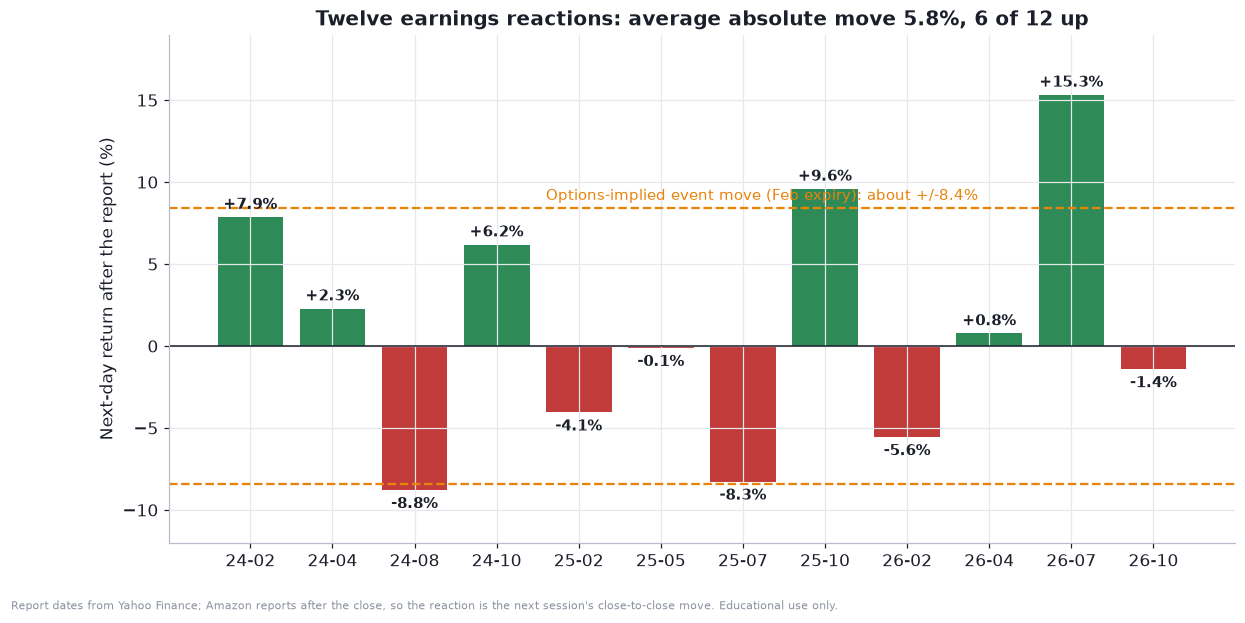
The market is pricing an 8.4% one-day move on the report. Amazon’s actual reaction over the last twelve reports averaged 5.8% in absolute terms, with six up and six down. The three largest in that stretch were plus 15.3% after the July 30 report, plus 9.6% after the October 2025 report, and minus 8.8% after the August 2024 report. The reaction last month, minus 1.4%, was one of the smaller ones. If you want to buy options in that window, you are paying for a move that is about 1.4 times the typical one. If you want to sell, you are being paid for a bigger move than the average, but a fat-tailed distribution can do what it likes.
Finally, three standard strategies on 100 shares through January 15, using the after-close quotes (bid for what is sold, ask for what is bought). A covered call that sells the $300 call at $2.42 brings in 0.9% of the stock price and caps the gain at $44.53 per share. A protective put that buys the $240 put at $7.80 costs 3.0% and limits the loss to $25.69. A collar that does both costs a net $5.38 (2.1%), limits the loss to $23.27 and caps the gain at $36.73. The skew explains why the put is expensive relative to the call.
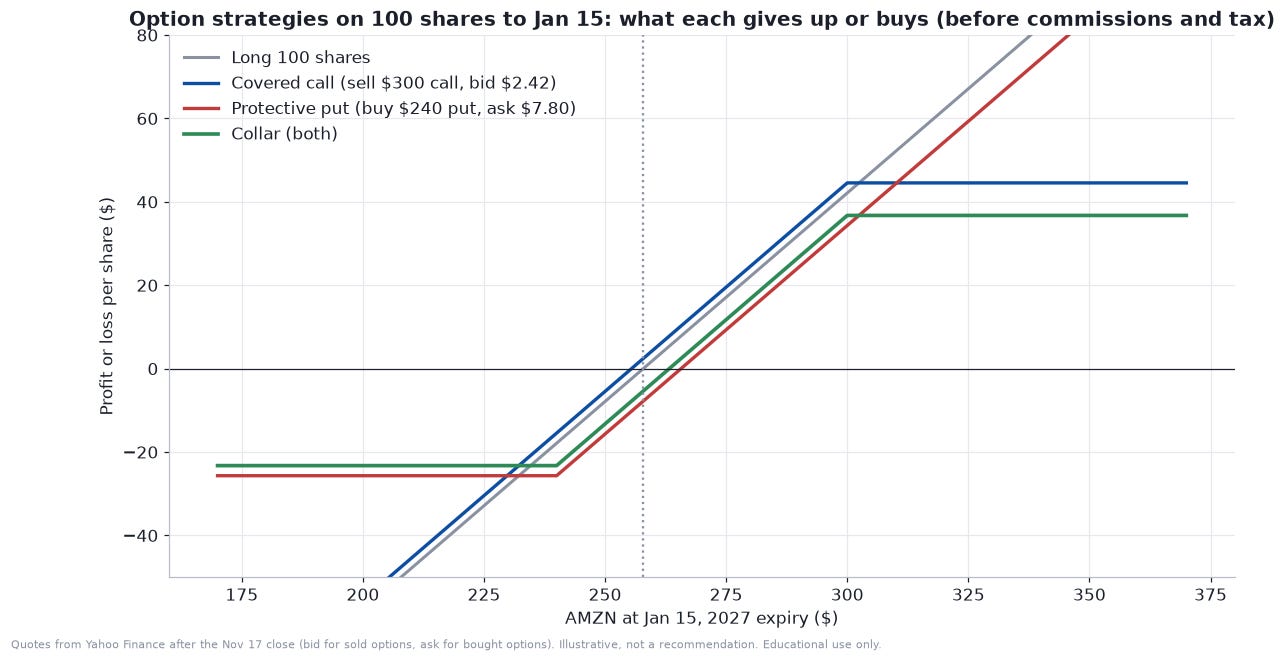
These are illustrations and not recommendations. The point is that the options market gives you a price for each view, and the price tells you what the market thinks the volatility will be.
Testing the ideas behind the bot
I cannot backtest the bot itself, because I do not have its data feed and its inputs are not all observable. What I can do is test the generic ideas it is built on, using Amazon’s own history from 2016 to today. These are stand-ins I built for the purpose, not replications of the bot, and I deliberately do not use the bot’s settings.
Test one: does a momentum composite lead returns? I built a generic composite from equal-weighted standard readings on daily bars (trend, momentum, breakout and volume) and flagged the days it was constructive. The flag is on 41% of days, and it is on today. The question is whether Amazon’s return over the following 5 and 10 trading days is better on flagged days than on others. The test statistic is the difference of means, with a bootstrap confidence interval from resampling each group.
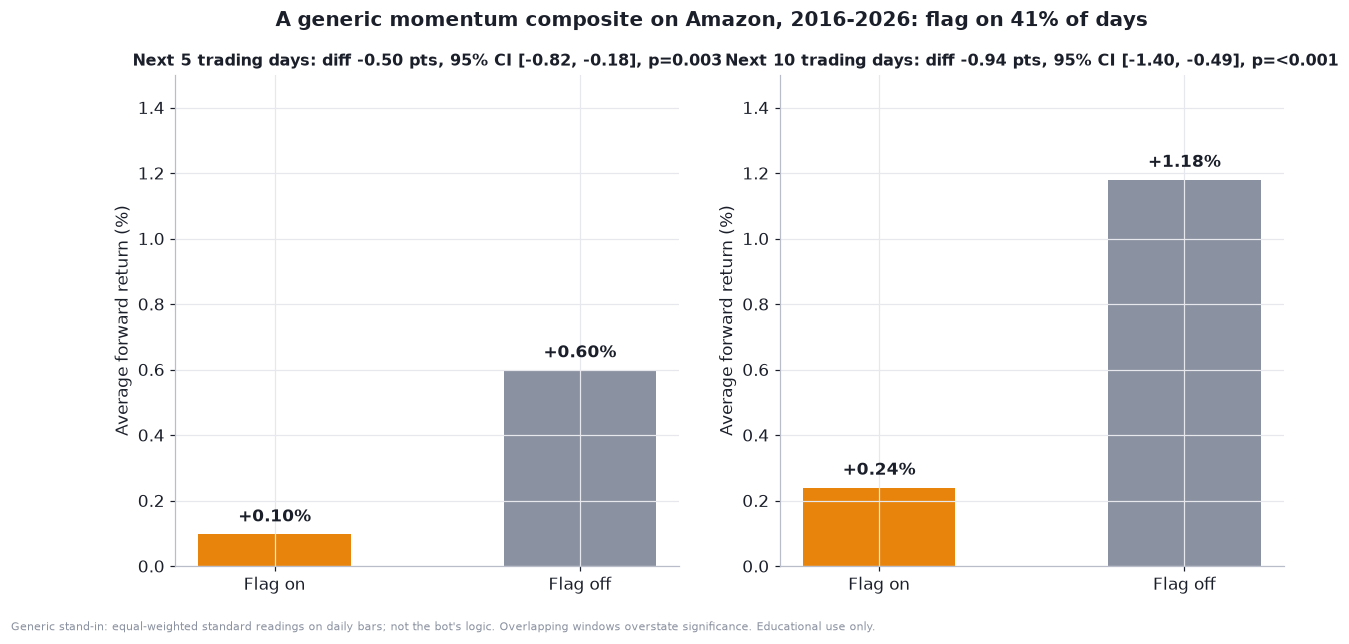
It did not. Over five days the average return on flagged days was 0.10%, against 0.60% on unflagged days, a difference of minus 0.50 points with a 95% interval from minus 0.82 to minus 0.18 (p = 0.003). Over ten days it was 0.24% against 1.18%, a difference of minus 0.94 points (interval minus 1.40 to minus 0.49). The hit rate was also lower, 53% against 58% over five days. Overlapping windows make the p-values look better than they are, so I read this as no evidence that momentum signals lead Amazon’s returns, not as evidence that they predict losses. In this sample, buying strength in Amazon did not pay on a short horizon, and buying weakness did a little better. That is a caution for any long-only momentum approach, and it holds for the bot only to the extent that its logic resembles this stand-in.
Test two: how often does a volatility stop get hit? Any stop placed $k$ average true ranges below the entry will be touched if the price’s low falls to it within $H$ days. A reflection-principle approximation says the probability is about twice the chance of ending below the level.
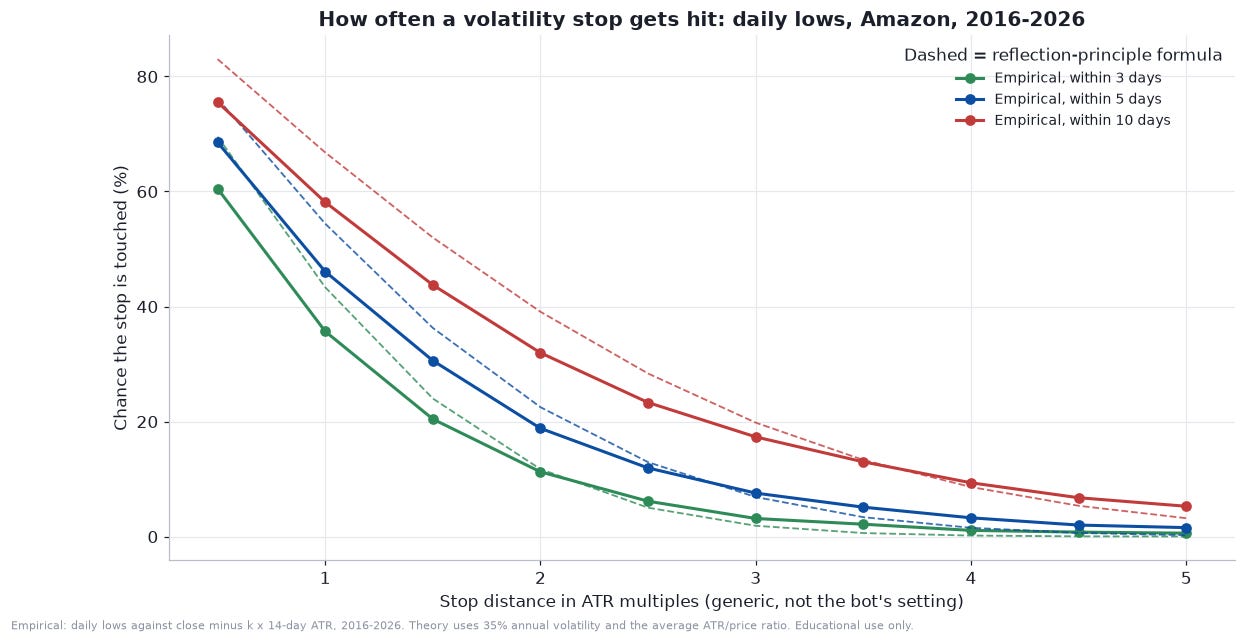
The empirical frequencies, measured on Amazon’s daily lows from 2016, show how much the stop distance matters. For a stop one ATR away, the chance of being touched within five days is 46% and within ten days 58%. At two ATRs it is 19% and 32%. At three, it is 7.6% and 17%. The formula runs above the empirical frequency for tight stops and below it for very wide ones, which is another sign of fat tails. These are for a generic range of $k$, not the bot’s setting. The practical implication is that a stop that is too tight is not protection, it is a way to pay the spread repeatedly. A stop is also not a guarantee. Amazon’s October 30 gap, from the $243.79 close to a $232.54 open, was $11.25, almost exactly one ATR, and a stop sitting in that gap would have filled at the open or worse, not at the stop price.
Test three: do ranges expand after a catalyst? The bot’s strategy name includes “Post-Catalyst ATR”, which suggests ranges widen after news. I measured the average daily range (high minus low as a share of the prior close) in the ten sessions after each of 44 earnings reports, skipping the gap day, against the ten sessions before. The post-report average was 2.45% against 2.38% before and 2.34% across all days. The ratio to normal is 1.05, and the paired test gives p = 0.56. There is no evidence of expanded ranges after reports, so a volatility-based rule should not assume the new, bigger range persists.
Test four: a cloud-peer rotation test. The bot talks about AWS momentum, so I tested a related idea: after Amazon’s 20-day return outruns the average of Microsoft and Alphabet, does it keep going? I split all days since 2016 into thirds by that spread and measured Amazon’s next ten-day return.
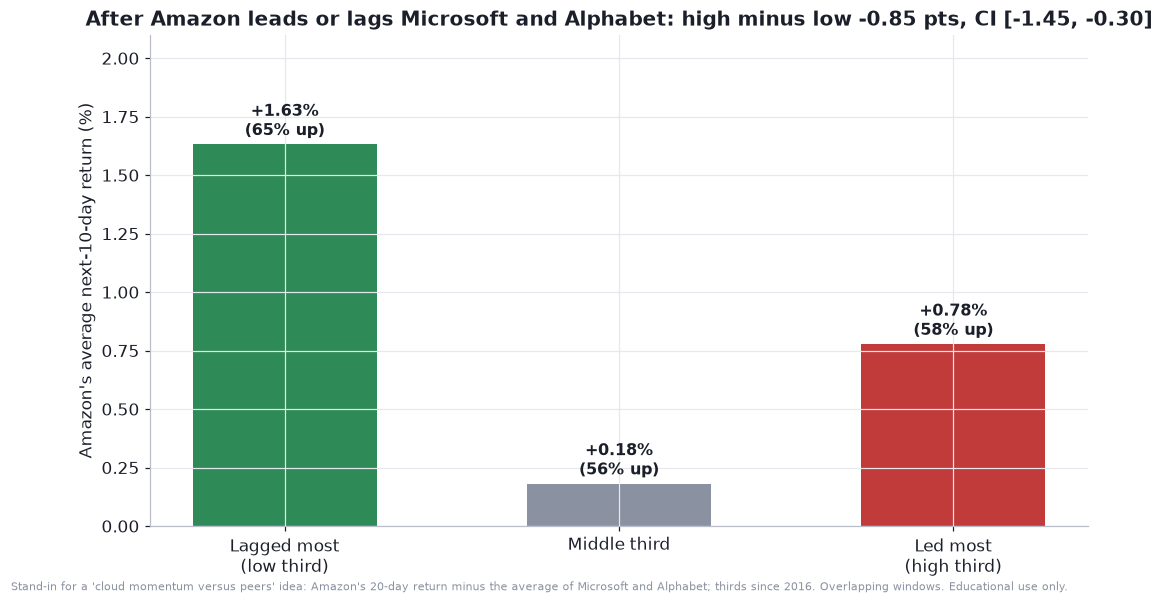
The answer is the opposite. After Amazon lagged most, its next ten-day return averaged 1.63% (65% of the time up). After the middle third it was 0.18% (56% up), and after it led most it was 0.78% (58% up). The difference between the top and bottom thirds is minus 0.85 points, with a bootstrap interval from minus 1.45 to minus 0.30 (p = 0.003, again flattered by overlapping windows). Today Amazon is ahead of those two by about 10 points over 20 days, in the 96th percentile of its history: Amazon’s 20-day return is minus 1.8%, Microsoft’s is minus 4.9% and Alphabet’s is minus 19.4%. That is a relative-strength reading, and historically it has favored a pause, not a continuation.
The header arithmetic
The script’s comment at the top states a profit range, and I treated it as a claim to be checked. I cannot verify where the range comes from, and nothing in the code explains it. But it can be converted into a per-share move.
where $Q$ is the number of contracts and $m$ the number of shares per contract. On one Micro contract (10 shares, $10 per $1), the low end of the stated range needs a move of $90 a share, or 34.9% of today’s price, and the high end $360, or 139.6%. On a standard contract (100 shares) it needs $9 (3.5%) and $36 (14.0%). For comparison, Amazon’s 14-day ATR is $11.21 (4.3%), the October 30 gap was $11.25, and the whole 52-week intraday range is $91.20 (35.4%).
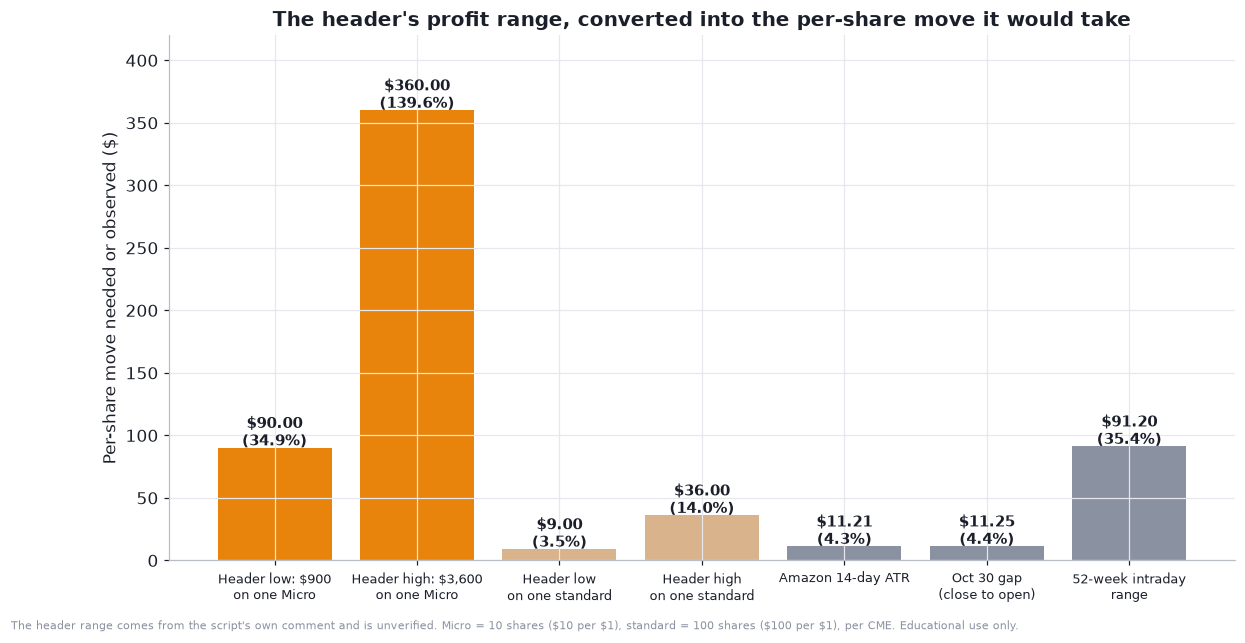
The low end of the range could be earned on a standard contract or on several Micros in a normal swing. The high end, on a single Micro, would need a move nearly four times the width of the entire 52-week range. So the range is either written for a larger position than one contract, or for a very long holding period, or it is aspirational. A reader should treat it as an unverified claim.
The bot, a closer look: what works, what does not, and what to fix
Here are the factual points I found, kept at the level of what the file does and not how it is tuned.
What the bot gets right.
The symbol matches the product. The file trades “XAMZN” and registers it as an exchange-listed CME instrument. XAMZN is CME’s Micro Amazon single stock future, with 10 shares per contract, and the point-value defaults in the file are consistent with that. A mismatch between a bot’s name and the real contract code is a common error, and it is not present here.
The risk architecture is sensible for a stock like this one. Volatility-scaled stops, smaller size when markets are rough, a spread check, a data-freshness check, loss limits and a losing-streak breaker are exactly the kind of controls that suit a stock that can move 5% to 15% on an earnings report.
It is long-only, which is consistent with a view that the AWS and AI story is a long story. That is a choice, not a flaw, but it means it has no way to benefit from a decline.
What does not work or needs checking.
The class layout. As pasted, the class has only its constructor inside it, and every other method sits outside the class, at the module level. In Python, that means the class has no market-data handler, no sizing logic and no exit logic. If that is how the file really looks, and not a copy-and-paste indentation artifact, the bot will fail at its first event. This is the first thing I would check.
Labels with no code behind them. The strategy is labelled “Anthropic Convertible Mark” and “AWS Growth Momentum”, but nothing in the code reads Anthropic’s filings, Anthropic’s share price, Amazon’s reported AWS growth or the convertible-note value. The “catalyst” is a fixed number computed from constants written into the file, not a data feed, and it will be stale after the next report. In other words, a label describes the author’s thesis. It does not describe an input.
Fills at the bar midpoint. Entries and exits in the simulation are logged at the midpoint of the latest bar. The bot does check the spread before entering, but it does not charge it, so simulated profits are overstated by roughly half the spread on each side and by any slippage. For a futures contract launched on July 27 this is material. I could not verify the depth of the order book in XAMZN, and new single-stock futures can be thin.
No roll or expiry handling. XAMZN is financially settled, and only two quarterly expiries are listed at any time. The December contract stops trading on Friday, December 18, which is 31 days from today. Nothing in the file refers to expiry, a roll to the next quarter, or the end of trading. A position held to the last day does not roll itself. The time-limit exit would usually close it first, but that is luck, not design.
No awareness of earnings or events. The file has no calendar. It does not know that Amazon reports after the close, that a stop cannot protect against a gap and that stop-based risk limits therefore do not hold on report nights. The options market prices an 8.4% move on the next report, and the stock opened $11 lower after the October report. A gap is not what a volatility stop is built for.
Configuration read from the environment. The contract’s point value, multiplier and tradeable switch are read from environment variables with defaults. A mis-set variable would silently change the position math. A startup check that compares them with the contract specification would be cheap insurance.
Self-adaptation on a small sample. Parts of the bot’s thresholds adjust to its own recent trade record. With a handful of trades, that is mostly noise, and adaptive systems can reinforce a lucky or unlucky streak. I would want to see a minimum sample before such adjustment is allowed to move anything.
Where the bot agrees with my view, where it conflicts, and where it cannot see.
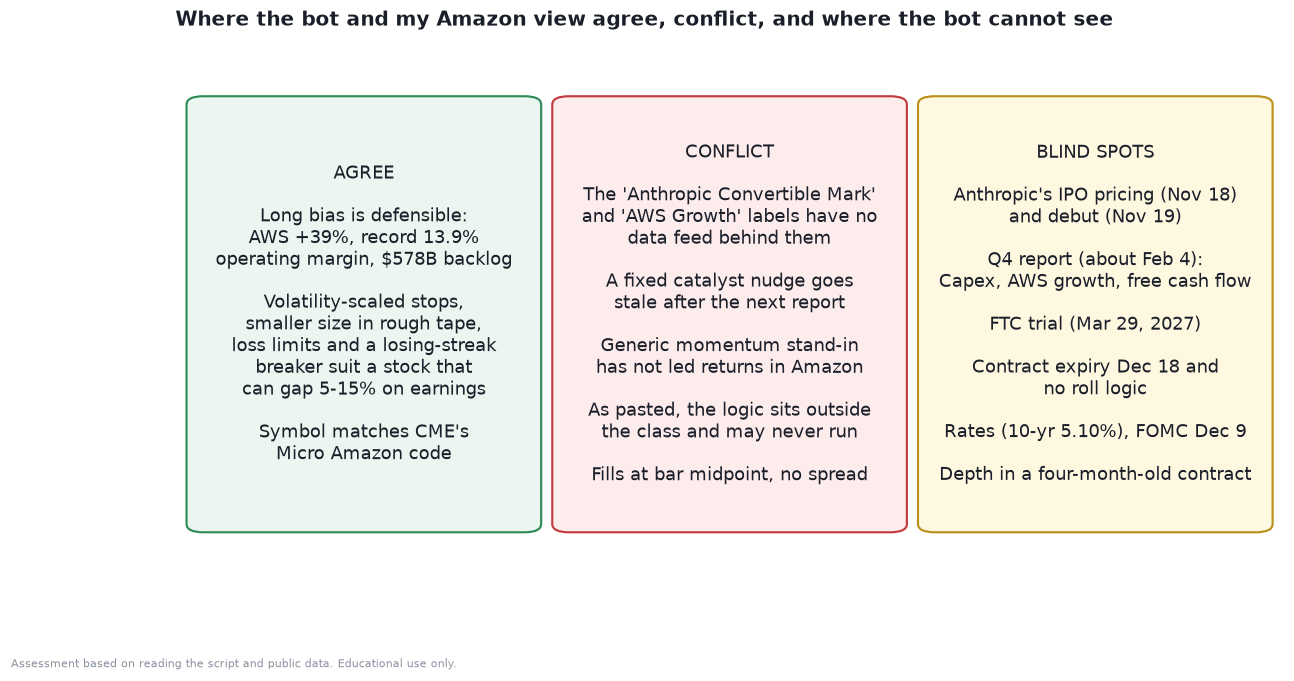
They agree on a long bias: AWS growth of 39%, a record 13.9% operating margin and a $578 billion backlog make a long bias defensible. They also agree on the value of risk controls for a stock that can gap. They conflict on the labels, on the stale catalyst, on the generic momentum idea, which did not lead returns in my tests, on whether the code will run as pasted, and on fills. And the bot is blind to the things that will matter most in the next three months: Anthropic’s pricing and debut on November 18 and 19, the fourth-quarter report around the start of February, the FTC trial in March, the December 18 expiry, interest rates with the 10-year at 5.10% and the next Fed decision on December 9, and the depth of a four-month-old contract.
Putting it together: scenarios and my view
Combine the pieces. The market price of $257.89 sits inside every range I computed.
Scenario-weighted DCF: $244 at a 10% discount rate, $297 at 9% and $205 at 11%. My capital-asset-pricing estimate is 10.6%, which would put the value near $221.
Sum of the parts: $194, $254 and $317, with the base case almost exactly at the price.
Peer multiples: $190 to $364, with a median-technology value of $215.
Analyst targets: a mean of $326, which I treat as sentiment. Morningstar: $280.
Options: the market expects a one-standard-deviation range of $207 to $309 by February 19.
Simulation: a 49% chance of finishing February above today’s close, and a 49% chance of touching the August high.
So I read Amazon as fairly valued with a wide error band, not as a bargain and not as an obvious short. The stock is priced for the base case in which AWS keeps growing near 40%, margins reach the high teens on free cash flow and capital spending eventually normalizes. The upside case needs both cloud acceleration and a retail margin improvement. The downside case needs capital to be spent without matching returns or a funding squeeze. At a 10% discount rate the bear case is about 44% below the price and the bull case about 42% above it, with my weights at 30%, 45% and 25%. That is a roughly symmetric payoff, and the probability-weighted value lands within about 15% of the price on either side depending on the discount rate. It does not show a clear edge in either direction.
What would change my mind? On the positive side, a clean Anthropic debut with a high price, a fourth-quarter capex number that is lower than expected while AWS holds 39% or better, and evidence that the stores margin is still rising. On the negative side, AWS growth below 35% with capex still climbing, a bond issuance beyond the amounts already raised, and a weak Anthropic debut that raises doubts about demand for compute.
If you are a trader, the technical map is simple: $240 to $275 has been the range, and a close outside it on volume is the signal. If you are an investor, the main thing is to size the position for a stock that has fallen 56% before and can move 8% on a report, and not for the average case. For a systematic trader using a bot like the one I reviewed, the first step is to make the file run and to wire in real data for the thesis it claims to trade.
The calendar
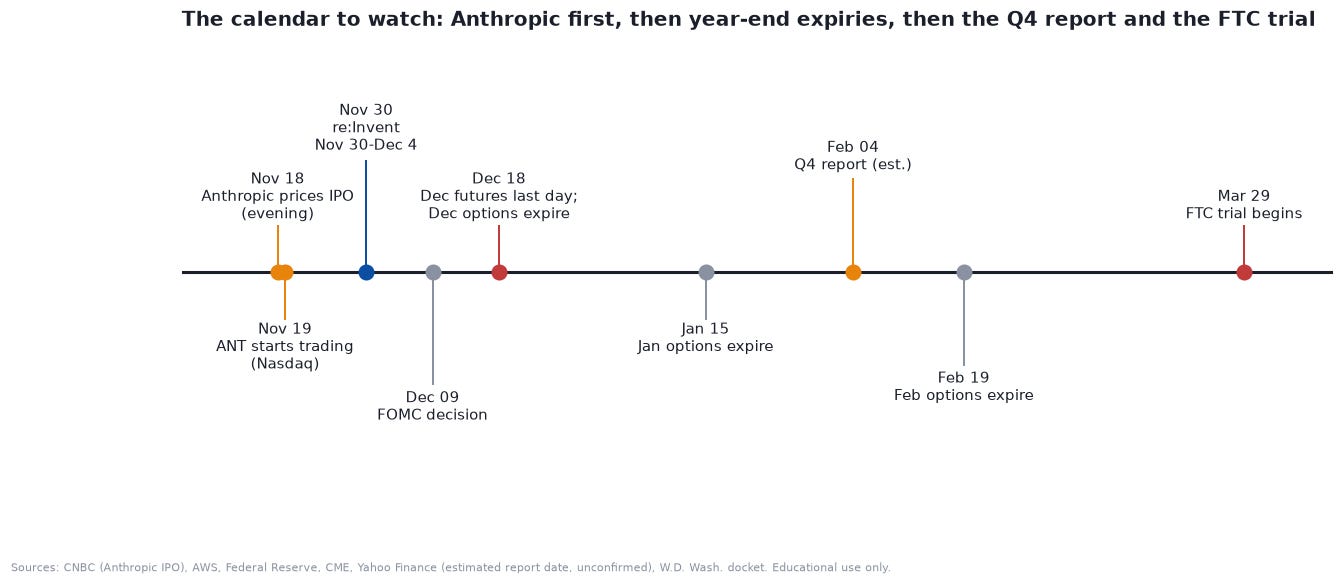
November 18, evening: Anthropic prices its IPO. November 19: it begins trading on Nasdaq, according to CNBC.
November 30 to December 4: AWS re:Invent.
December 9: the Federal Reserve’s rate decision.
December 18: the December XAMZN and SAMZN contracts stop trading, and December options expire.
January 15: January options expire.
About February 4: the fourth-quarter report. The date is a Yahoo Finance estimate and has not been confirmed by Amazon.
February 19: February options expire.
March 29, 2027: the FTC trial begins in Seattle.
Data and caveats
Prices, option chains and multiples are from Yahoo Finance after the November 17 close. Reported financials are from Amazon’s third-quarter release and call, via CNBC, Yahoo Finance and the transcripts I could read. Backlog and customer details are secondhand, from a newsletter’s reading of the 10-Q, and I did not read the filing myself. Anthropic figures are from the amended S-1 as reported by Yahoo Finance, TechCrunch and CNBC. Morningstar’s fair value, the analyst targets and the capital expenditure estimates for 2027 come from press reports and are not company guidance. The models are mine, they are simplified, they rest on historical data that may not repeat, and the discounted-cash-flow results are very sensitive to the discount rate. The Monte Carlo is a statement about volatility, not a forecast. I have not verified the bot’s file beyond reading it, and I have not run it. Nothing here accounts for taxes, commissions or your circumstances.
This article is for education and information only. It is not investment advice, a recommendation or an offer to buy or sell any security or futures contract. Futures and options carry substantial risk, including the loss of more than your initial investment. Do your own research and consult a licensed adviser. Past performance does not predict future results.