

Educational analysis only. This is not financial advice, a recommendation or an offer to trade anything. Every price, probability and payoff below is either sourced to a named outlet, computed by me from public Yahoo Finance data, or labelled illustrative. Stocks, futures and options can lose money, and futures and options can lose more than you put in.
Tuesday, November 17, 2026: a 103% Cloud quarter, then the worst day in Alphabet’s history
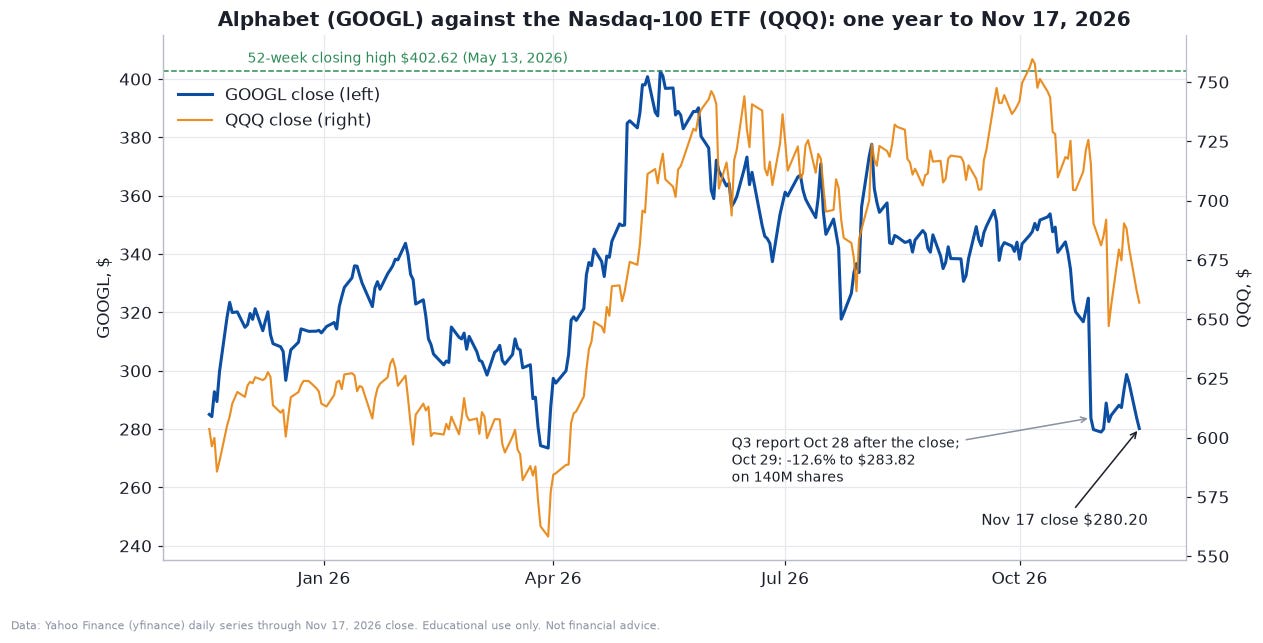
Alphabet’s Class A shares (NASDAQ: GOOGL) closed Tuesday at $280.20, according to Yahoo Finance. That is 30.4% below the record close of $402.62 (May 13; the intraday high was $408.61 on May 18), 13.8% below the close of $324.89 on October 28, and 10.5% below where the year started ($313.00 on December 31, 2025). The Class C shares (GOOG) closed at about 99.1% of the Class A price, and the two lines have moved almost in lockstep for a decade, so everything below applies to both. I use GOOGL as the main series because it is the share class that CME’s single stock futures reference.
The drop happened in one session. Alphabet reported third-quarter results after the close on October 28. Revenue grew 25% to $127.6 billion, Google Cloud revenue grew 103% to $30.7 billion, and operating income rose 30% to $40.6 billion, according to Alphabet’s release. And yet the stock fell 12.6% the next day, its steepest one-day fall on record, according to CNBC. Reuters listed the reasons: revenue of $127.6 billion against $128.2 billion expected, advertising revenue of $82.0 billion against $83.4 billion expected, adjusted earnings of $2.67 per share against $3.02 expected, and a free cash flow loss of $9.1 billion when analysts had expected something near break-even, per LSEG data. Search revenue grew 12%, down from 17% in the second quarter and 19% in the first, and came in below estimates for the second quarter running, CNBC reported. About $500 billion of market value went with it.
So you have a company that is growing at a pace that is rare at its size, that has the fastest-growing major cloud business and a $561 billion contracted backlog, and that is also burning cash, raising debt and stock to fund $195 to $205 billion of capital spending this year, and facing the first real evidence that AI could eat into the search business that pays for all of it. This article tries to take that tension apart with the three lenses a professional would use: fundamental, technical and quantitative.
It runs long on purpose. It covers the third-quarter print, Cloud and the TPU business, capital spending and funding, the balance sheet and equity stakes, Waymo, the antitrust cases, the valuation against Microsoft, Meta, Amazon and Apple, a reverse DCF and a sum-of-the-parts sketch, the chart, the statistics of how the stock behaves, and what the options market is pricing. The math is written as equations, each explained in plain English right after it.
There is a second thread. A reader sent me a Python trading bot that targets a symbol called “XGOOGL” and calls itself a “Micro SSF Safer AI Long,” with a strategy label about “AI rotation” and a “divergence” between Alphabet and NVIDIA and Oracle. The question I want to answer is not “does the bot make money?” because I have no verified results for it. The bot’s own header carries a “short-term profit potential” estimate, and I treat that as an unverified claim, not an expectation. The question is: if a Google bot is built the way this one is built, where does it agree with a careful read of Alphabet, where does it disagree, and what does it never look at? I describe the bot at the concept level only, in plain words and pseudocode. Its exact rules, thresholds and sizes are the owner’s trade secrets, so none of them appear here.
A word on sourcing. Prices, financial statements, option chains, dividends and peer multiples come from Yahoo Finance via the yfinance library, pulled on November 17, 2026 after the close. Company facts come from Alphabet’s third-quarter 2026 release and call (October 28). News facts come from CNBC, Reuters and the U.S. Department of Justice, and exchange facts from CME Group documents and a broker contract list. I name the source next to each figure, and I say where an assumption is mine.
What “XGOOGL” actually is
Start with the name, because it matters. XGOOGL is not Alphabet’s stock ticker, and it is not, as far as I can tell, a CME contract code either. The stock trades as GOOGL and GOOG. The bot uses “XGOOGL” as its symbol on the CME exchange, and it registers itself with the trader’s bot registry under “XGOOGL:CME”.
CME Group launched single stock futures on July 27, 2026. According to CME’s Special Executive Report 9974R (dated July 16, 2026), the launch included 55 standard single stock futures and 22 Micro single stock futures. The standard contract covers 100 shares and moves in 0.01-point steps worth $1.00 each. The Micro contract covers 10 shares, and each 0.01-point step is worth $0.10. Both are financially settled, list two quarterly months at a time, and stop trading at 4:00 p.m. Eastern on the third Friday of the contract month. That puts the current December contract’s last day at Friday, December 18, 2026.
Alphabet is on the list in both sizes. The standard contract is SGOOG and the Micro is XGOOG, per CME’s launch list and a broker contract table from Lincoln Park Futures. The bot’s “XGOOGL” differs from CME’s “XGOOG” by one letter. I could not find “XGOOGL” in any CME document.
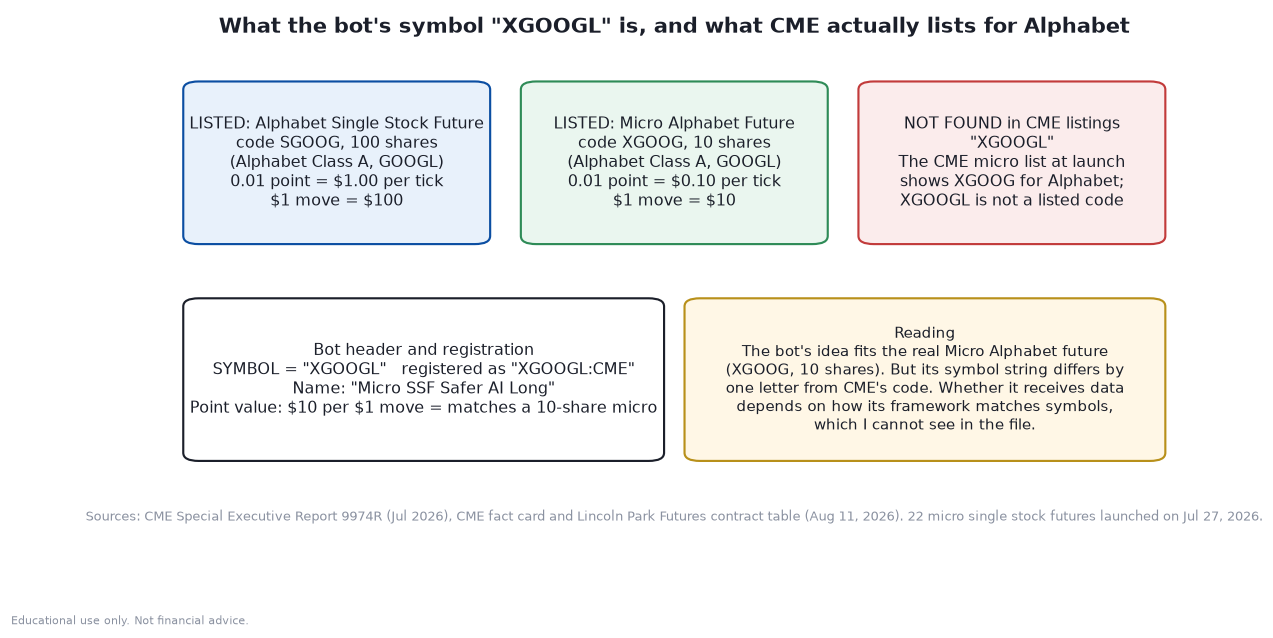
My reading is that the bot was written for the Micro Alphabet future, and that the symbol string may simply be a typo or a framework alias. The bot’s point value ($10 for a $1 move) matches a 10-share Micro exactly, which supports that reading. The practical consequence is a plumbing question I cannot answer from the file: whether the bot receives any data depends on how its framework matches symbols. I flag it as something to check, not as an accusation. CME can add products, and I only know what its public documents say today.
What the bot does, in plain words
I read the whole script. Here is what it is built to do, with no parameters.
Name and thesis. The bot is called “XGOOGL Micro SSF Safer AI Long Backtest,” and its strategy label is “Safer AI Rotation Long SSF (GOOGL vs NVDA/ORCL divergence).” The label says the idea is a rotation among AI stocks, with Alphabet as the “safer” one. The code contains no NVIDIA or Oracle price input and no divergence calculation of any kind. What the code really does is generic price momentum on Alphabet’s own bars, plus one correlation check against Nasdaq futures.
Direction. Long only. It never goes short and has no logic for it.
Regime. There is no explicit regime detector. The closest things are a volatility gauge that widens stops and trims size when markets get rough, a stress gauge that cuts size further, and a gate that stands aside when Alphabet is moving too much in step with the Nasdaq.
Signals. On each completed signal bar, the bot turns several standard readings into one combined score: how far a faster moving average sits above a slower one, RSI, the direction of MACD momentum, whether price has broken above its recent highs, and whether volume is above its recent norm. That technical score is blended with a separate momentum gauge supplied by the bot’s parent framework, whose internals are not in the file. To enter, the blended score has to clear a bar that adjusts with the bot’s own recent hit rate, and price has to sit above the slower average. The weights are a trade secret.
Risk management. This is where most of the code lives. Before any entry, it checks that the bid-ask spread is acceptable compared with its own recent history, that market data is fresh, that it is not in an exchange maintenance window, and that loss limits and a losing-streak breaker have not tripped. If everything passes:
The stop distance is a multiple of average true range (ATR), and the multiple depends on how volatile the market looks.
The profit target is a “reward ratio” times the stop distance, and the ratio adapts to the bot’s own recent results.
Size comes from a risk budget (a fraction of equity) divided by the dollar value of the stop distance, then reduced for volatility and for market stress, and capped by a hard ceiling.
Once in a trade, a trailing stop only ever tightens. Profits are taken in stages at multiples of the initial risk. Exits are triggered by the stop, the trailing stop, a “thesis check” (moving averages rolling over with momentum negative, or volume collapsing while the trade is under water), an account-level profit objective, or a time limit.
The stop and trailing stop are also checked against the live price on every tick.
It runs as a simulation: entries and exits are logged at the midpoint of the latest bar, and profit and loss are tracked internally.
Here is the logic as concept-level pseudocode.
on each completed signal bar:
    technical = weighted_sum(trend_gap, rsi, macd_direction, breakout, volume)
    score     = blend(technical, momentum_gauge_from_framework)
    bar       = adaptive_bar_from(recent_win_rate)
    if flat and score >= bar and price > slow_average and not too_correlated_with_nasdaq:
        if gates_pass(spread_ok, data_fresh, session_ok, loss_limits_ok):
            stop_distance = volatility_multiple * ATR
            target        = reward_ratio * stop_distance
            size          = min(size_ceiling, risk_budget / dollar_value(stop_distance) * stress_factor)
            buy(size, stop = entry - stop_distance)

on each faster execution bar while long:
    trailing_stop = tighten_only(trailing_stop, price - scaled_ATR)
    take profits in stages at multiples of the initial risk
    exit on: stop | trailing_stop | thesis_check_fails | profit_objective | time_limit
on each tick while long:
    exit if price <= stop or price <= trailing_stop
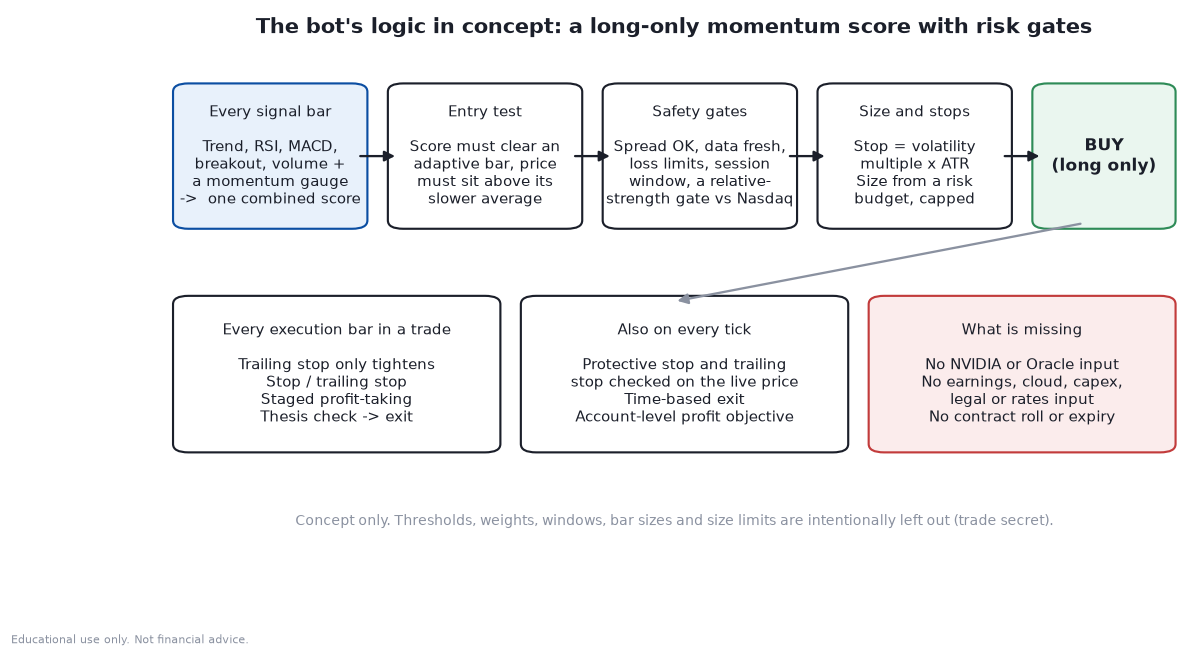
In one sentence: it is a tidy, long-only momentum bot that carries an “AI rotation” label. Later in the article I come back to where it fits Alphabet and where it does not. First, the thing it never looks at: the company.
Fundamentals, part one: the third-quarter print
Alphabet’s third quarter was two very different businesses in one filing. Here are the numbers, all from the October 28 release unless I say otherwise.
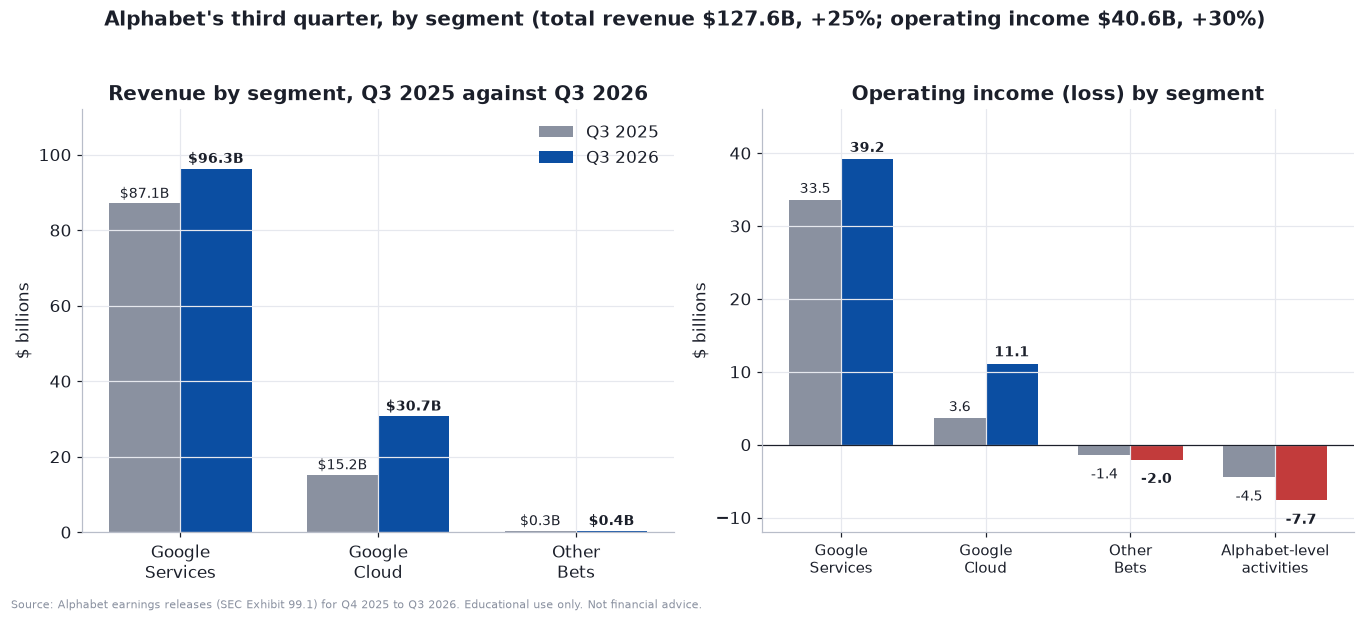
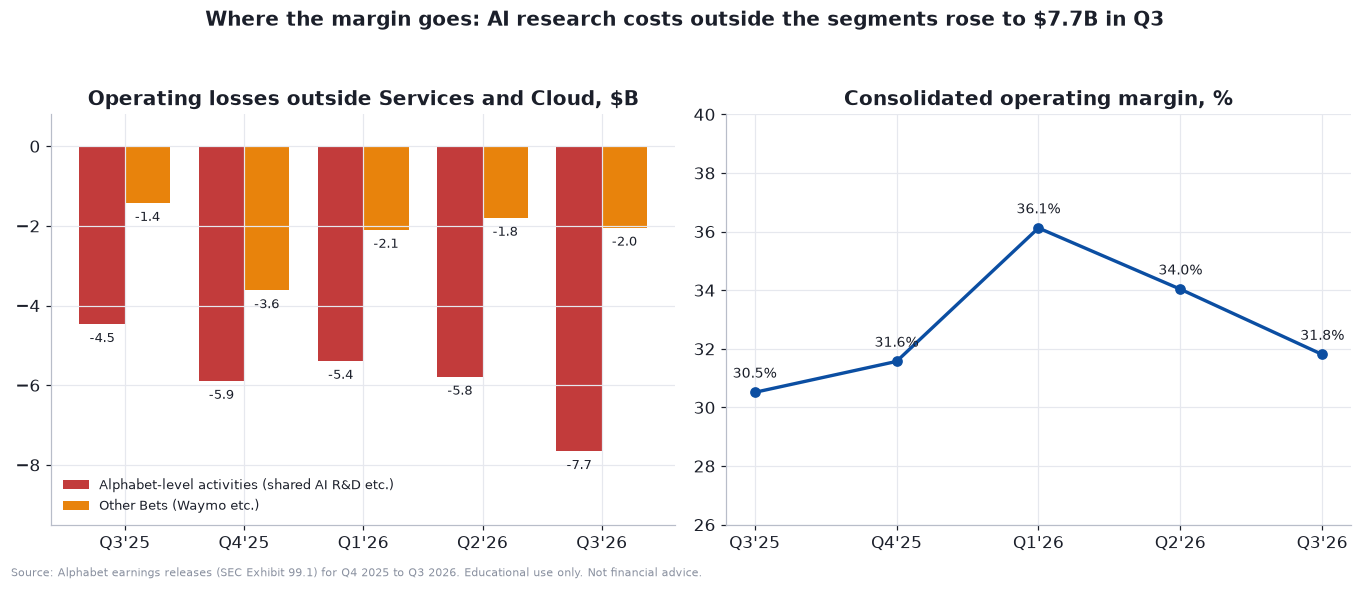
Consolidated. Revenue was $127.6 billion, up 25% (25% in constant currency), the 13th straight quarter of double-digit growth. Operating income was $40.6 billion, up 30%, for a 31.8% margin. Net income to common holders was $26.2 billion, or $2.12 per share, down from $2.87. That decline is not about operations. Other income swung from a gain of $12.8 billion a year ago to a loss of $8.2 billion, and the CFO said on the call that the loss came mainly from an unrealized markdown of Alphabet’s SpaceX investment after SpaceX’s stock fell in the quarter. Reuters’ $2.67 “adjusted” figure, against $3.02 expected, appears to strip that kind of item out.
Google Services (Search, YouTube, Network, subscriptions, platforms and devices) had revenue of $96.3 billion, up 11%, and operating income of $39.2 billion, up 17%, at a 40.7% margin. The pieces:
Search and other was $63.4 billion, up 12%. That is the line the market punished. Growth ran 19% in the first quarter, 17% in the second and 12% in the third, by my arithmetic from the quarterly releases and CNBC’s numbers. Management says the year-over-year growth rate in query volume is the highest in five years, so the problem is not usage. It is monetization per query. Management gave two explanations: currency, which executives said was the biggest factor and would weigh more in the fourth quarter (CNBC), and the shift of queries toward AI Mode, which monetizes less so far (Reuters, citing the chief business officer).
YouTube ads were $11.2 billion, up 9%. Network was $7.5 billion, up 1%. Subscriptions, platforms and devices were $14.3 billion, up 11%. Traffic acquisition costs, what Alphabet pays partners to send traffic, were $16.4 billion against $14.9 billion a year earlier.
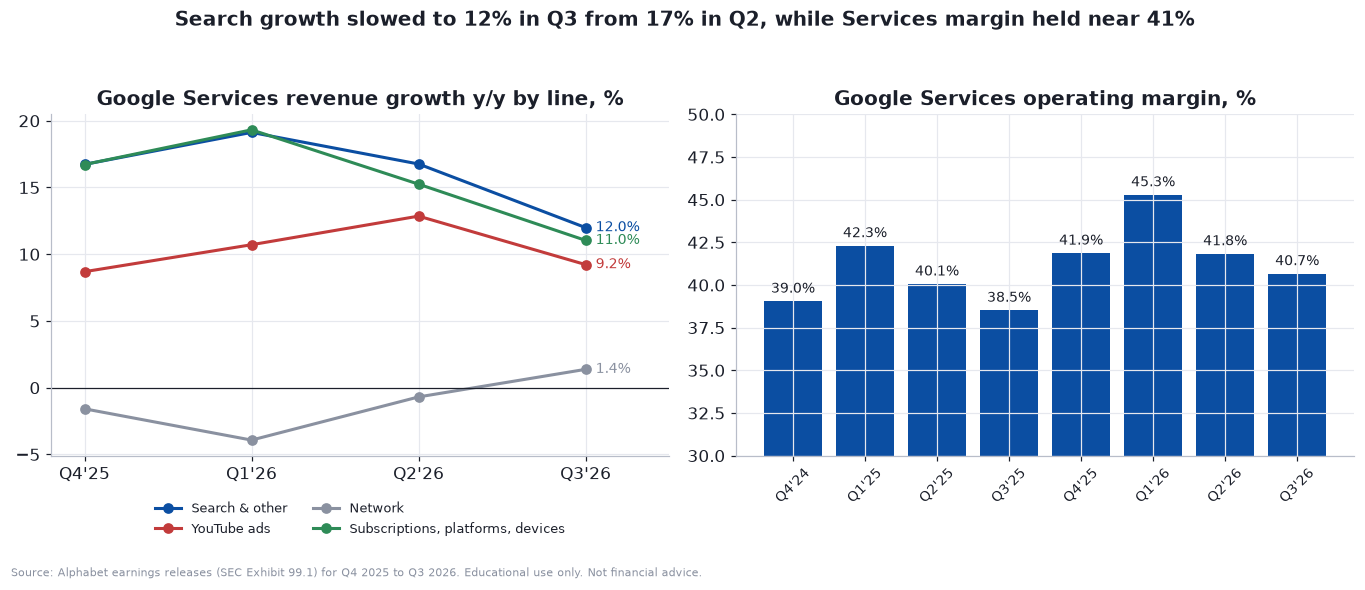
The bull reading of Search is that this is a transition. Queries in AI Mode are on average three times longer than traditional searches, and the company says click-through rates on sponsored product listings in AI Mode are already similar to organic ones. It is expanding ads in AI Mode to international markets (all from the call). The bear reading is the one analysts quoted by CNBC voiced: UBS said the result brings “Search cannibalization fears right back to the forefront,” and D.A. Davidson’s Gil Luria said the fears of 2023 to 2025 “appear to finally be showing up.” One quarter does not settle it, but two quarters of Search below estimates is a pattern worth respecting.
Fundamentals, part two: Google Cloud, TPUs and Gemini
If Search is the worry, Cloud is the answer the company wants you to look at.
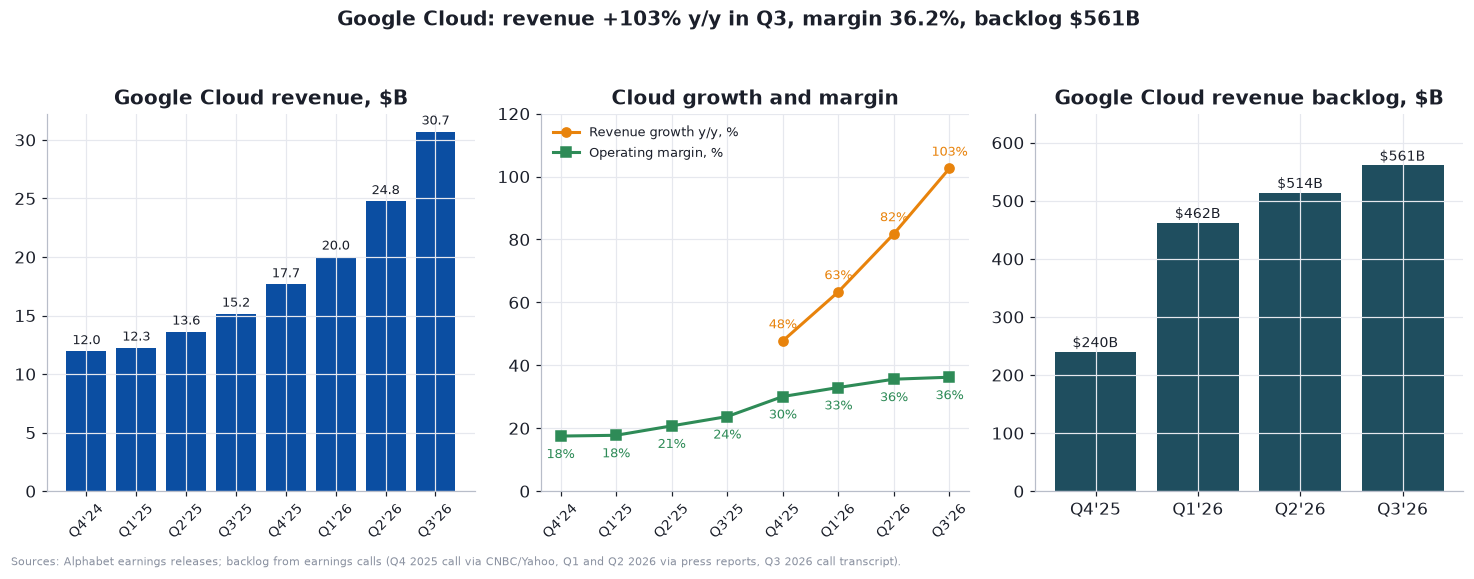
Google Cloud revenue was $30.7 billion against $15.2 billion a year ago, up 103%, and operating income was $11.1 billion, more than triple last year’s $3.6 billion. The operating margin rose from 23.7% to 36.2%. Cloud’s trailing four-quarter revenue is about $93 billion, and its quarterly revenue has gone from $12.3 billion in the first quarter of 2025 to $30.7 billion in the third quarter of 2026.
Two things drove that, and one of them is new. The first is Google Cloud Platform itself, which the company says grew strongly in both AI and core services, and which accounted for the vast majority of the revenue. The second is TPU system sales. Alphabet began recognizing revenue from selling its tensor processing units, bundled with networking, storage and software, to outside customers in the second quarter. On the call, management said nearly 100 customers use TPUs today, naming Anthropic (directly and through Broadcom), Apple (which is scaling pre-training of its models on the latest TPUs), Citadel Securities and others. Cloud revenue excluding TPU system sales was, in the CFO’s words, “very, very strong,” but the company did not give the number.
Backlog is the best forward indicator. Cloud’s contracted backlog was $561 billion at the end of the quarter, according to the call and Reuters, against $514 billion the quarter before and $240 billion at the end of 2025 in the sources I used. The CFO said just over 55% should be recognized as revenue over the next 24 months. Do the arithmetic: more than $300 billion over two years is over $150 billion a year, against about $93 billion of Cloud revenue in the last four quarters. If that conversion happens, Cloud’s revenue run-rate has plenty of room, but only if Alphabet can build the capacity, which is the problem the next section is about.
There is a margin caveat. Alphabet has started renting third-party computing capacity to meet demand, which came online only at the very end of the third quarter. The CFO said to expect Cloud margin headwinds in the near term as usage ramps in the fourth quarter. The 36.2% margin is therefore probably a high-water mark for a while. Hardware sales typically carry lower margins than software and services, and the company’s “other cost of revenues” line rose 32% to $35.1 billion, driven partly by hardware costs for TPU system sales.
On AI usage, the call gave these figures: first-party model APIs process nearly 32 billion tokens per minute, more than four times a year ago, and the Gemini app reached one billion users. The new Gemini 4 models were launched the day of the report, which Reuters noted drew a skeptical question from Bernstein about whether they were rushed out to offset soft financial metrics. Microsoft reported Azure revenue up 48% to $33.2 billion the same night, per CNBC, and its shares rose more than 5% on free cash flow that beat estimates.
Fundamentals, part three: capex, free cash flow and who is paying
This is where the quarter turned.
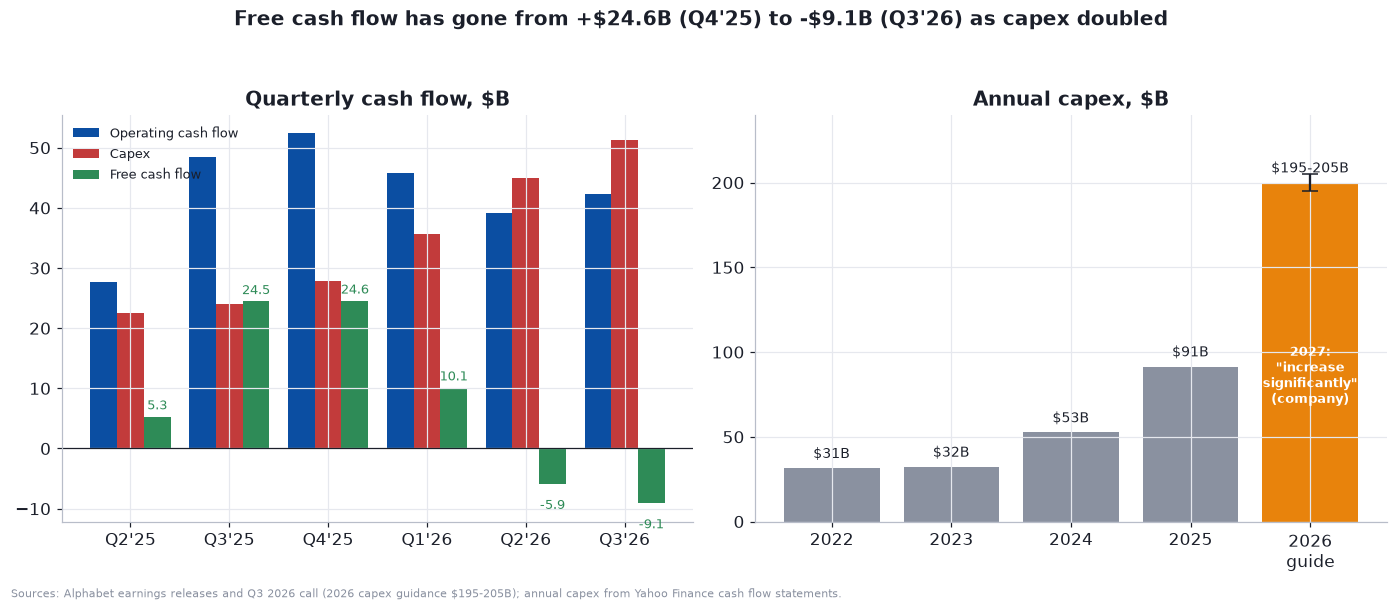
Capital expenditure was $51.4 billion in the third quarter. About 65% went to servers and networking equipment, which the company depreciates over about six years, and 35% to data centers, which last seven to 40 years. Full-year 2026 guidance is $195 to $205 billion, unchanged, and the CFO said capex will “increase significantly” in 2027 with details coming on the fourth-quarter call. For scale, Alphabet spent $91.4 billion in 2025 and $52.5 billion in 2024, by Yahoo Finance’s cash flow statements. My trailing four-quarter sum of capex is about $159.8 billion.
Free cash flow, which is operating cash flow minus capex, was negative $9.1 billion in the quarter, after negative $5.9 billion in the second quarter, the first negative quarter since Alphabet went public, per Reuters. Trailing four-quarter free cash flow is $19.7 billion, a 4.2% margin on $471.1 billion of revenue, against 18% to 23% of revenue each year from 2022 to 2025. The third quarter was also hit by a $5.2 billion payment of a 2018 European Commission fine after the appeal ended, and by an inventory build for TPU systems.
How is it being paid for? The cash flow statement for the first nine months of 2026 answers that.
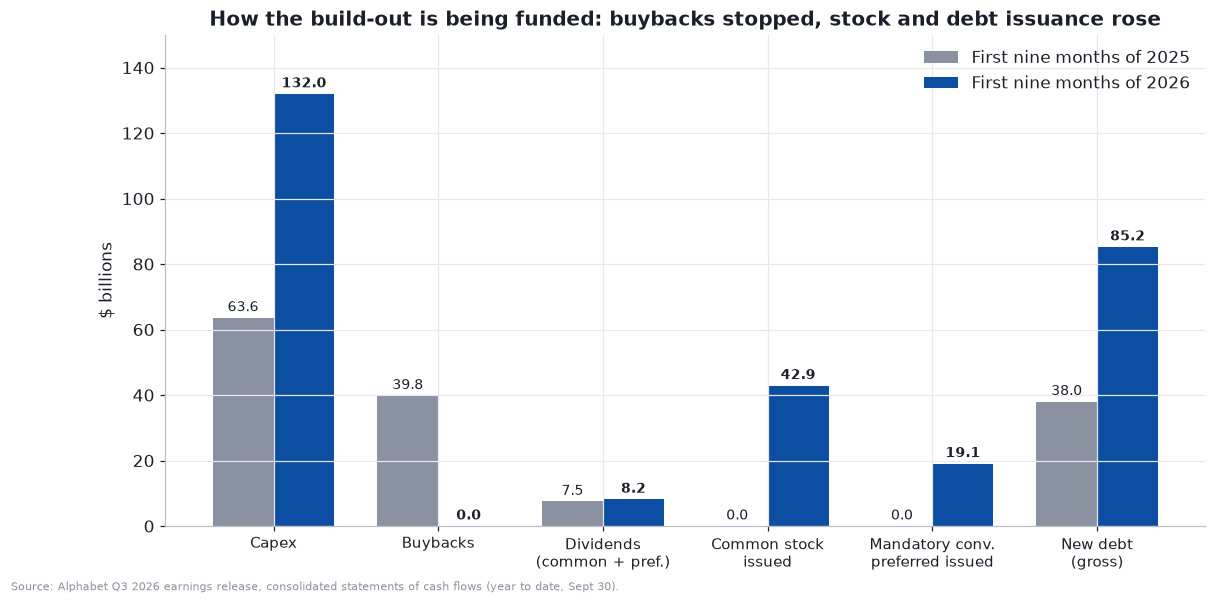
Buybacks, which were $39.8 billion in the first nine months of 2025, were zero in the same period of 2026. The company raised $85.2 billion of new debt (gross), issued $42.9 billion of common stock (the release describes an at-the-market program with $27.6 billion of capacity left) and issued $19.1 billion of mandatory convertible preferred stock. In the third quarter alone it issued senior notes for $28.7 billion of net proceeds. The share count is therefore rising, not shrinking. A reader who remembers Alphabet as a company that returned $47.3 billion through buybacks and dividends in the first nine months of 2025 alone should update that picture. It is now a net issuer of capital.
Management’s defense is that returns will be high: the CFO said the company expects an “attractive ROIC that remains meaningfully above our cost of capital,” and that inventory and capex “will put pressure on free cash flows.” The backlog is the evidence for that claim. The risk is on the other side of the ledger: the CFO put future purchase commitments at $924 billion and pre-commencement leases and other obligations at $152 billion, against the $561 billion backlog. Some have volume flexibility, so these are maximum amounts, but the ratio shows why investors want proof that demand is real.
Fundamentals, part four: the balance sheet, the stakes and the dividend
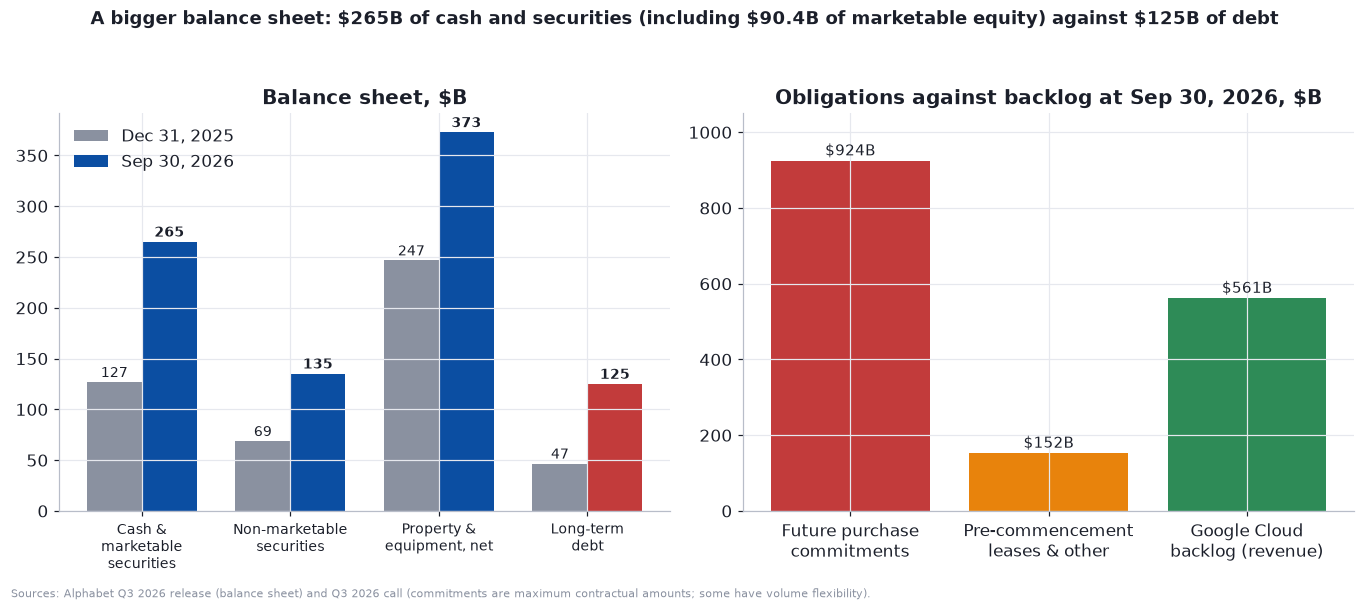
Alphabet ended September with $265.1 billion of cash and marketable securities, which includes $90.4 billion of marketable equity securities, against $125.1 billion of long-term debt. Non-marketable securities, which are private stakes carried at cost or fair value, were $135.2 billion, up from $68.7 billion at the end of 2025. I cannot split that figure into individual holdings from the release, so I will say only what is public elsewhere. Alphabet owns a stake in SpaceX: CNBC says SpaceX went public about five months ago in a record $85.7 billion offering, and Investing.com shows it trading at $141.70 on Tuesday. And Alphabet is a large shareholder of Anthropic, whose IPO is the subject of the calendar below. The Motley Fool, citing Anthropic’s filing, put Alphabet’s post-IPO stake at 13.7% (worth about $132 billion at the $74 midpoint of the price range).
Those stakes cut both ways. They are real assets, and they are a reason the sum-of-the-parts value comes out higher than the earnings-based value. But they are marked to market every quarter, which injects volatility into reported earnings that has nothing to do with Search or Cloud. The third-quarter loss on equity securities was $8.7 billion.
Other Bets (Waymo and others) had $372 million of revenue and a $2.0 billion operating loss. On the call, Alphabet said Waymo has driven more than 300 million fully autonomous miles and operates in 15 major U.S. cities. Waymo raised $16 billion in February at a $126 billion valuation, per Reuters, with Alphabet as the majority investor. That is the only market-set price for any of Alphabet’s non-core assets, and I use it in the sum-of-the-parts. Alphabet-level activities, mostly shared AI research and development, cost $7.7 billion in the quarter against $4.5 billion a year earlier. That line has grown faster than any other cost.
The dividend is $0.22 per quarter ($0.88 a year, a 0.31% yield), with the next one payable December 14 to holders of record on December 7, per the release. The payout ratio is under 5% by Yahoo’s figure. It is a token payment relative to the capital being deployed, and it is not the reason to own the stock.
Fundamentals, part five: the antitrust overhang
Two U.S. cases are still live, and both have moved this fall.
The search case. Judge Amit Mehta found in August 2024 that Google illegally maintained a search monopoly. His September 2, 2025 remedies decision barred exclusive default contracts for Search, Chrome and Google’s AI products, ordered Google to share search-index and user-interaction data and to syndicate search results to qualified rivals (including generative-AI companies), but let Google keep paying for non-exclusive defaults and refused to order a sale of Chrome or Android. A six-year final judgment was entered December 5, 2025, per the TopDisputes case tracker. Both sides appealed to the D.C. Circuit, where briefing finished in October. A joint request for argument as early as December 9 is pending, one docket summary says argument is calendared for January 2027, and no date is confirmed. The data-sharing remedies were not stayed.
The ad-tech case. On September 16, 2026, Judge Leonie Brinkema, in the Eastern District of Virginia, ordered behavioral remedies, according to the Department of Justice: required integration of Google’s ad exchange (AdX) and publisher ad server (DFP) with the open-source Prebid standard, AdX bidding into rival publisher ad servers, data export rights for publishers, a ban on AdWords bidding preferentially into Google’s own ad tools, and a monitor, all for six years. She did not order a sale of AdX or DFP. The DOJ said it is still reviewing its options, and press summaries say Google will appeal the liability ruling.
How much does this matter to the stock? The remedies as they stand are costly and annoying, not existential. There is no break-up. The risks that remain are an appeals-court surprise in either direction, rules that make Search distribution more expensive, and, over years, the data-sharing remedies helping AI rivals. I treat antitrust as a slow-burn drag and a source of headline volatility, not as the thing that explains $120 of lost share price.
Valuation, part one: Alphabet against its peers
Start with the cheap-looking numbers and then take them apart. On Yahoo Finance’s data, Alphabet has a market value of $3.44 trillion, an enterprise value of $3.39 trillion, a trailing price-to-earnings ratio of 14.6, a forward ratio of 18.5, and an operating margin of 33.3%. Revenue is growing at 24.7%.
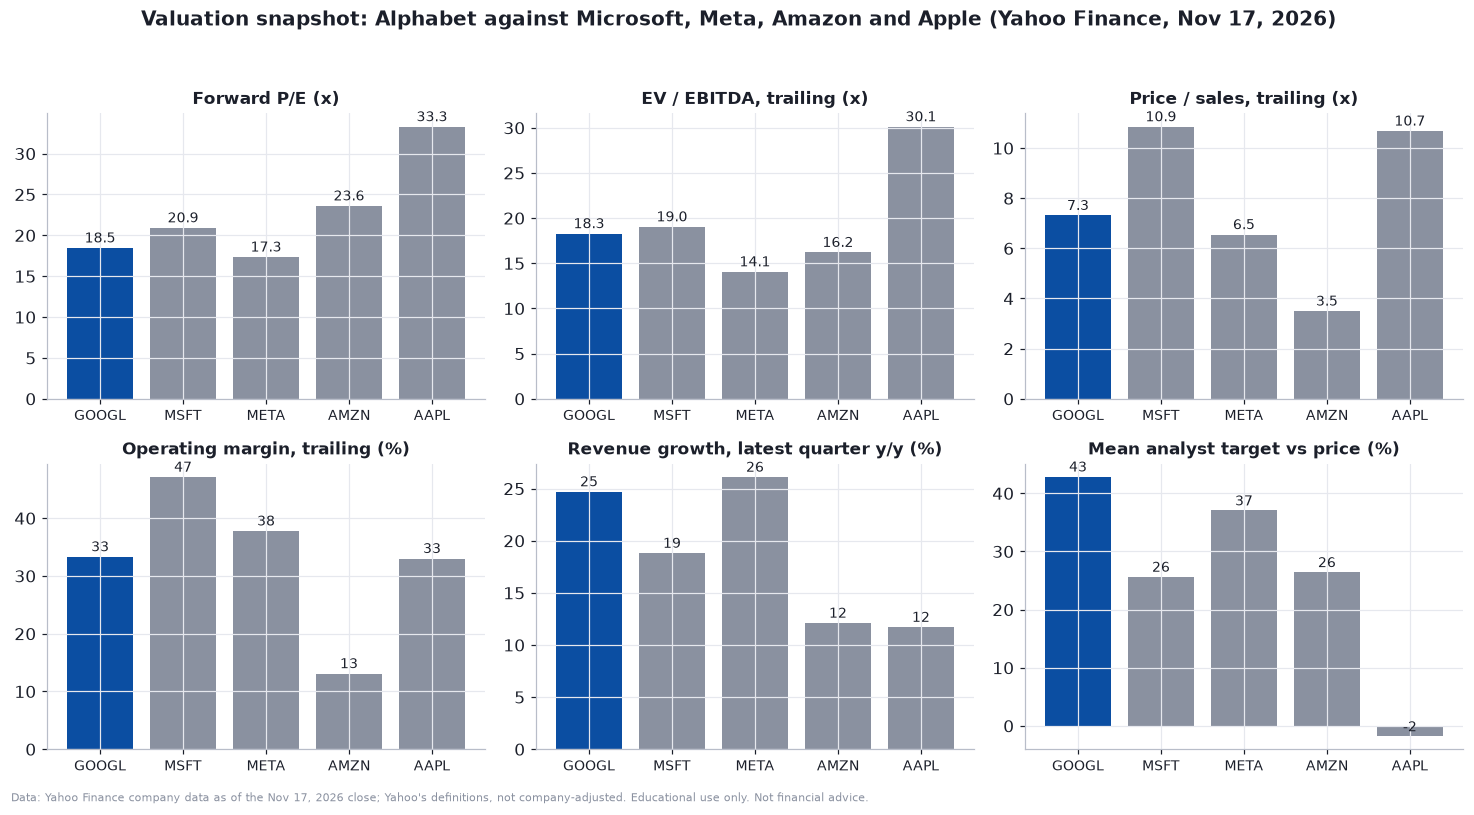
A trailing P/E of 14.6 looks like a bargain, but it is not. Alphabet’s reported profit margin on Yahoo’s trailing data is 50%, inflated by large gains on equity stakes in the first half of the year (other income was $127.5 billion in the first nine months, per the release). That is why second-quarter reported earnings were $9.11 per share against $2.90 expected. The forward P/E is the better number, and it uses Yahoo’s consensus forward earnings of about $15.18 per share, which I back out from the forward ratio. On that basis:
Alphabet trades at 18.5 times forward earnings.
Microsoft trades at 20.9 times, Meta at 17.3 times, Amazon at 23.6 times and Apple at 33.3 times.
On enterprise value to EBITDA, the same ordering holds: Alphabet 18.3, Microsoft 19.0, Meta 14.1, Amazon 16.2 and Apple 30.1.
Alphabet is therefore in the middle of the megacap group: cheaper than Microsoft, Amazon and Apple, slightly dearer than Meta, and growing at nearly Meta’s pace and faster than the other three. Applying each peer’s forward P/E to Alphabet’s $15.18 gives $317.61 at Microsoft’s multiple, $263.35 at Meta’s, $358.31 at Amazon’s and $505.34 at Apple’s, with a median multiple of 22.3 implying about $338. I do not take Apple’s multiple seriously for Alphabet, because Apple’s capex is a fraction of Alphabet’s. That is the real difference, and it is why peer multiples are only a starting point.
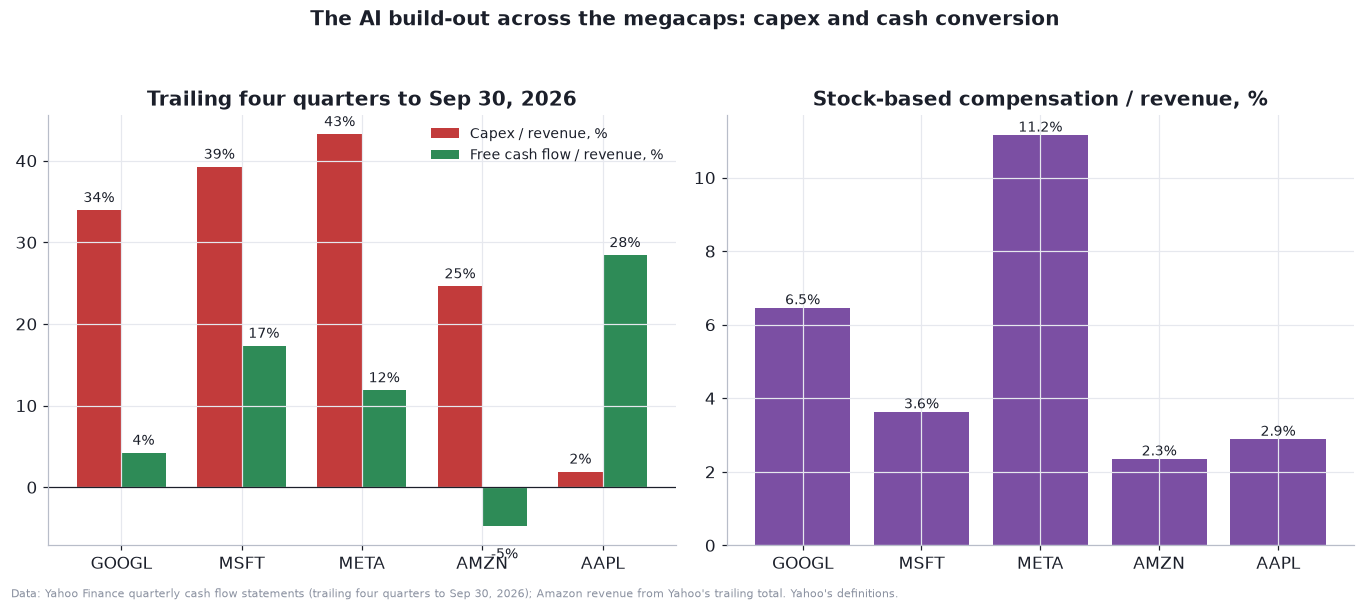
On trailing four-quarter cash flow statements (operating cash flow minus capex, my definition), Alphabet spent about $159.8 billion on capex against $135.9 billion at Microsoft, $104.4 billion at Meta, $196.1 billion at Amazon and $9.0 billion at Apple. Free cash flow was $19.7 billion at Alphabet, about $60 billion at Microsoft, $28.6 billion at Meta, negative $37.6 billion at Amazon and $136.1 billion at Apple. Alphabet and Amazon spent the most relative to the cash they generate, and the market is not paying Alphabet a premium for that.
Valuation, part two: a DCF sketch, run backwards
A discounted cash flow model is only as good as its inputs, and for a company in the middle of a capex surge the inputs are especially soft. So instead of asking “what is Alphabet worth,” I ask the reverse: what would you have to believe for $280.20 to be fair?
Here is the setup. Take trailing revenue of $471.1 billion. Let growth start at 18% in year one and fade in a straight line to 3% by year ten. Let free cash flow margin start at 2% (roughly where the capex surge has left it) and rise in a straight line to a target margin m-star by year seven, then hold. Discount at a rate r, add a terminal value growing at 3%, and add net non-operating assets: cash and securities ($265.1 billion) minus debt ($125.1 billion) plus non-marketable securities ($135.2 billion), less a 25% haircut on the equity stakes. That is $218.8 billion, about $17.80 per share on 12.29 billion shares. The first equation is the definition of free cash flow.
In plain English: the cash the business really throws off is what operations bring in, less what has to be spent to keep growing. For Alphabet that number has gone from $73.3 billion in 2025 to $19.7 billion over the last four quarters.
In plain English: today’s value per share is the present value of ten years of free cash flow (F(t), revenue R(t) times margin m(t)), plus the value of everything after year ten (a growing perpetuity at rate g), plus net non-operating assets (NNA), divided by the share count N. Discounting by (1+r) raised to the power t converts a dollar received later into a smaller dollar today.
The reverse step is to hold everything else fixed and solve for the margin that makes the answer equal the market price.
In plain English: find the long-run free cash flow margin that justifies the current price, at each discount rate. It is a “what you’d have to believe” number, not a forecast.
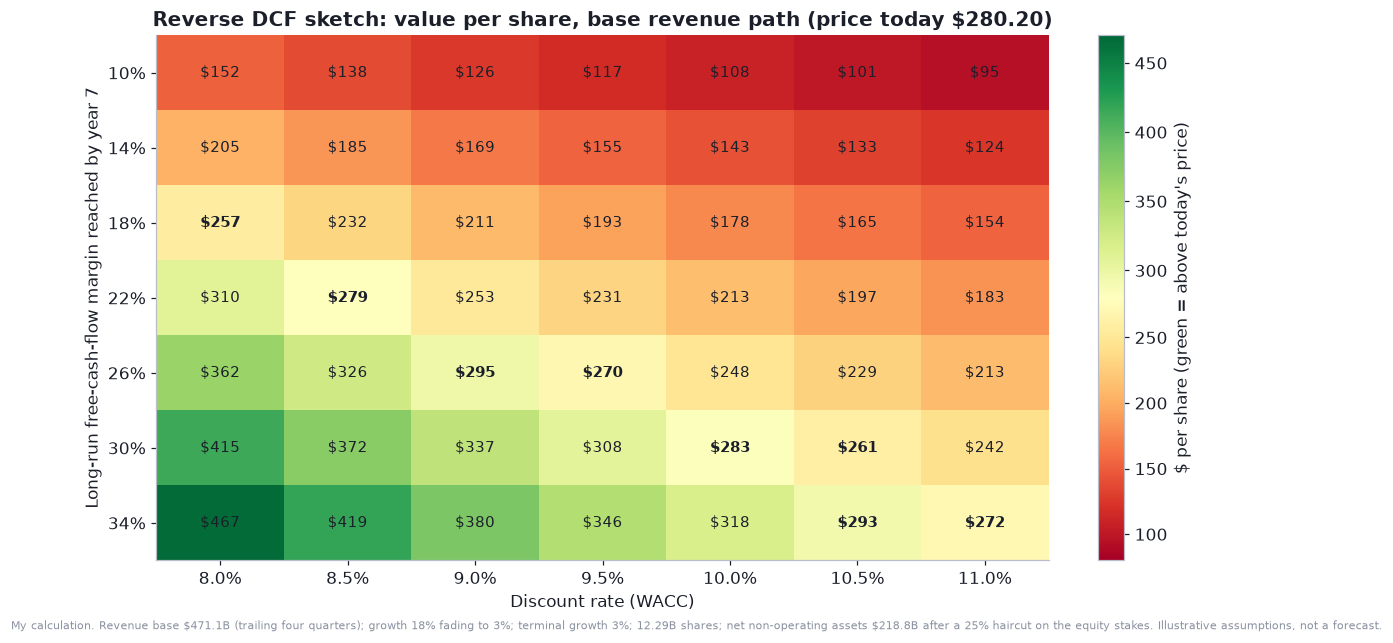
The answer depends heavily on the discount rate. A CAPM estimate (equation below) with the 10-year Treasury yield at 5.10%, a beta of 1.2 and an equity risk premium of 4.5% gives a cost of equity of 10.5% and a blended cost of capital of about 10.3%.
In plain English: what investors demand for owning the stock is the risk-free rate plus a premium scaled by how much the stock moves with the market, and the company’s overall cost of capital blends that with the after-tax cost of its debt. These inputs are my assumptions, and the 5.1% yield is Yahoo’s reading of the 10-year as of the close.
Here is what the reverse DCF says for the price to be fair:
At an 8% discount rate, Alphabet needs a long-run free cash flow margin of 19.8%.
At 9%, it needs 24.6%.
At 10%, it needs 29.7%.
At 11%, it needs 35.1%.
For comparison, Alphabet’s free cash flow margin was 21.2% in 2022, 22.6% in 2023, 20.8% in 2024 and 18.2% in 2025. At a discount rate near 8% the market is pricing a return to that old margin, which looks reasonable. At the 10.3% my CAPM inputs suggest, it is pricing a margin above anything Alphabet has achieved, on a much larger revenue base with a much higher capex burden. The honest reading is that the price is neither screaming cheap nor obviously expensive. It is sensitive to a question the next few quarters will start to answer: how much of the capex becomes durable profit.
To put numbers on that, I run three scenarios, with my own probabilities, and take the expected value.
In plain English: weight each scenario’s value by how likely I think it is, and add them up.
Bear (30%): free cash flow margin reaches 14%, growth starts at 12%. Value per share is $135 at a 9% discount rate, $115 at 10% and $101 at 11%.
Base (45%): margin reaches 22%, growth starts at 18%. Value is $253, $213 and $183.
Bull (25%): margin reaches 28%, growth starts at 22%. Value is $371, $310 and $265.
The probability-weighted values are $247 at 9%, $208 at 10% and $179 at 11%, every one below the $280.20 price. That does not mean the stock is overvalued. On these assumptions, which are mine and conservative about margins, the market is paying for something between my base and bull cases, or for a lower discount rate. You can reject my probabilities, and many analysts do: Yahoo’s 53 analysts have a mean target of $400.37, ranging from $300 to $500, and a mean rating of 1.34 on a scale where 1 is “strong buy.” I report that because it is the consensus, not because it validates anything.
Valuation, part three: a sum of the parts
Alphabet is not one business, and a sum-of-the-parts view lets each piece carry its own multiple.
In plain English: value each segment by multiplying a measure of its earnings or sales by a multiple, add them up, then add net non-operating assets and divide by shares.
My inputs are:
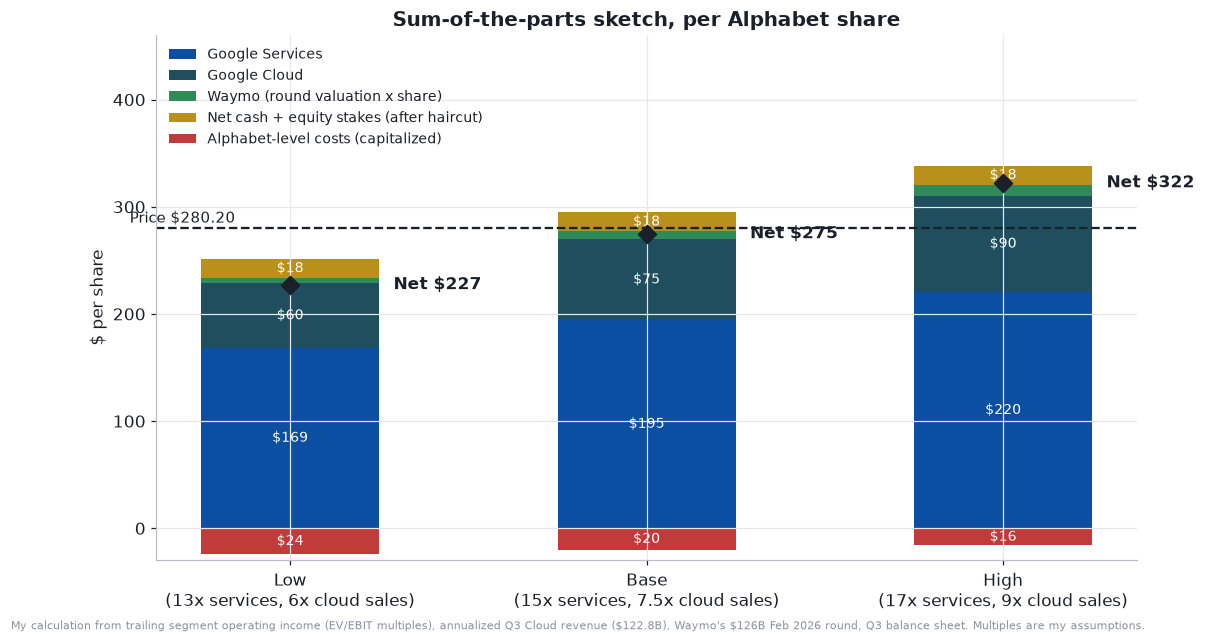
Google Services: trailing operating income of $159.4 billion at 13, 15 and 17 times (low, base, high). Google Cloud: Q3 revenue annualized, $122.8 billion, at 6, 7.5 and 9 times sales. Waymo: its February funding valuation of $126 billion, at 50%, 75% and 100%. Alphabet-level costs: trailing losses of $24.7 billion, capitalized at 12, 10 and 8 times as a negative. Net non-operating assets: $218.8 billion after the haircut.
The result is $227 per share in the low case, $275 in the base and $322 in the high, so the base case almost exactly equals the market price. It is rough: it ignores the $9.6 billion trailing loss in Other Bets beyond what the Waymo value implies, and it applies EBIT multiples to Services income before the cost of AI research, which sits in the Alphabet-level line I do capitalize. The takeaway is that when Cloud and Services get reasonable multiples and the stakes are counted, you land close to where the stock is.
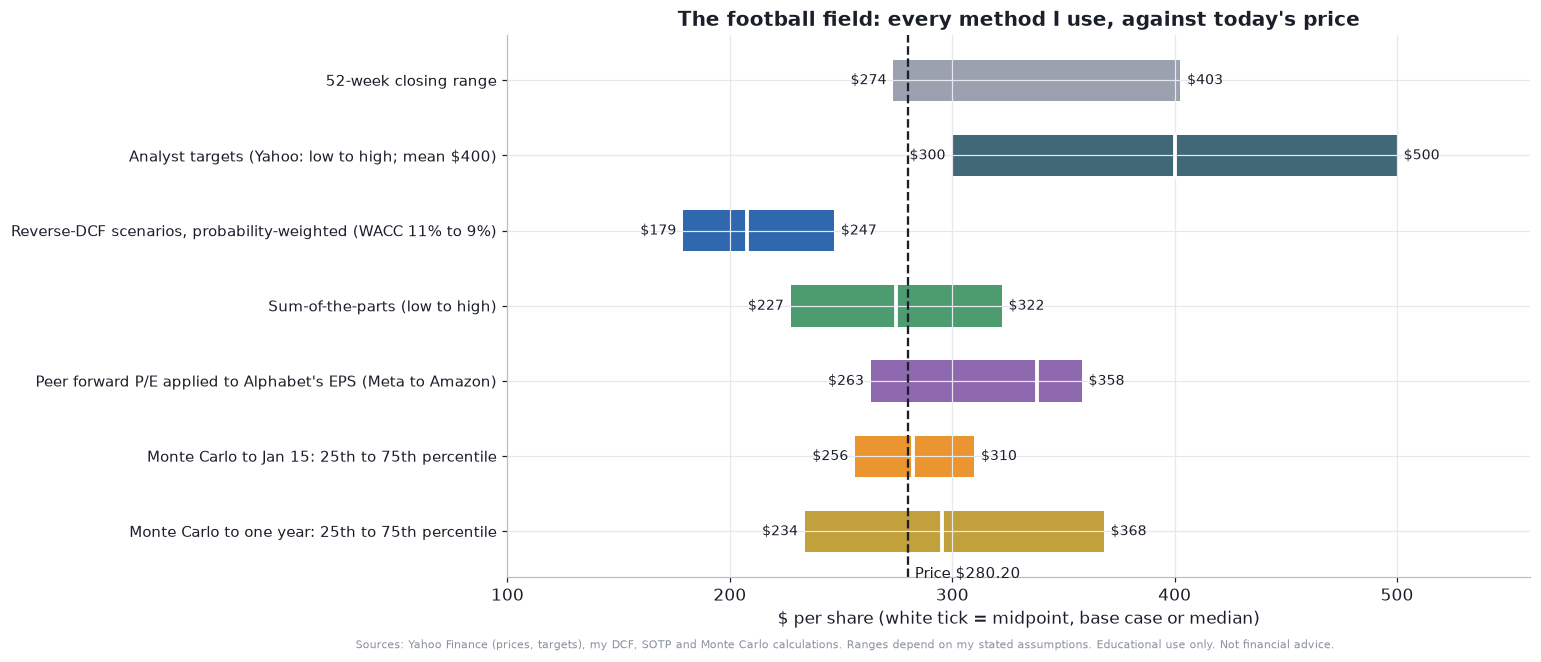
Put the methods on one line and the picture is a stock that sits inside the range of my own models: above the scenario-weighted DCF ($179 to $247), near the middle of the sum of the parts ($227 to $322) and of the peer forward multiples (about $263 to $358), and well below the analyst targets ($300 to $500). The 52-week closing range was $273.50 to $402.62, so the stock is sitting near the bottom of its own year.
The risks, in order of how much they could matter
Capex and cash burn. The 2027 plan arrives in early February. If it lands near a figure like $300 billion, which one investor quoted by Reuters said “could potentially scare the market,” free cash flow could stay negative well into 2027, and funding it dilutes holders.
Search monetization. Two quarters below estimates and a fourth-quarter currency headwind. If AI Mode queries do not monetize like classic queries, the profit pool that funds the build-out shrinks.
Demand concentration and circularity. Anthropic is a TPU customer, a large shareholding (about 13.7% after the IPO, per press reports) and a competitor to Gemini. A cooling AI market could hit all three at once. CNBC describes a public market that has “grown increasingly skeptical of the AI trade.”
Execution on capacity. The backlog is only revenue if Alphabet can build or rent the capacity, and third-party capacity costs more.
Equity-stake volatility. SpaceX and Anthropic marks can move reported earnings by billions in either direction.
Antitrust. The search appeal (argument date unconfirmed) and the ad-tech appeal.
Rates and the macro backdrop. The 10-year yield is 5.10% and the VIX is 25.5. Long-duration growth assets are sensitive to both.
The technical picture
The chart tells a plainer story than the fundamentals.
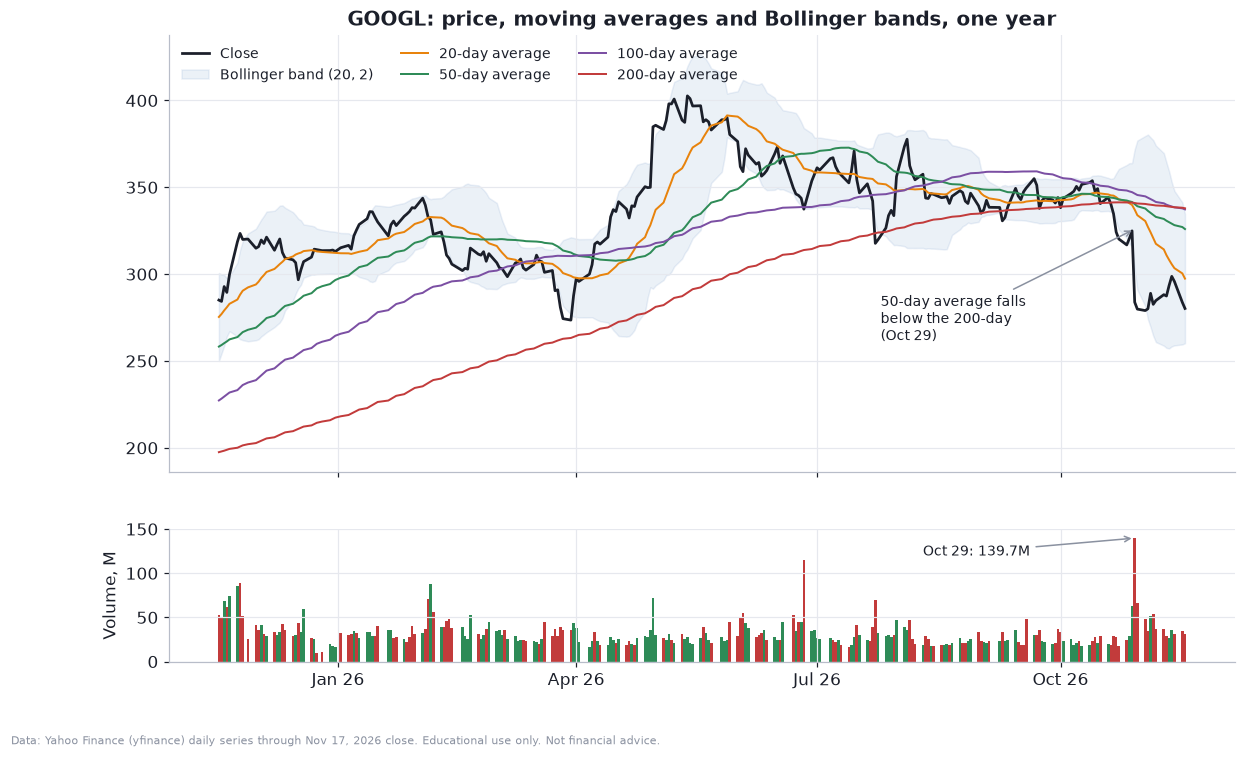
Alphabet’s 50-day moving average ($325.93) crossed below its 200-day ($337.89) on October 29, a “death cross.” The stock is below its 20-day ($297.39), 50-day, 100-day ($337.26) and 200-day averages, 17.1% below the 200-day, and has given back about 95% of the rally from the March 30 closing low of $273.50 to the May 13 closing high of $402.62. The cross is a lagging signal that mostly confirms what price has done, and the two averages are only $12 apart.
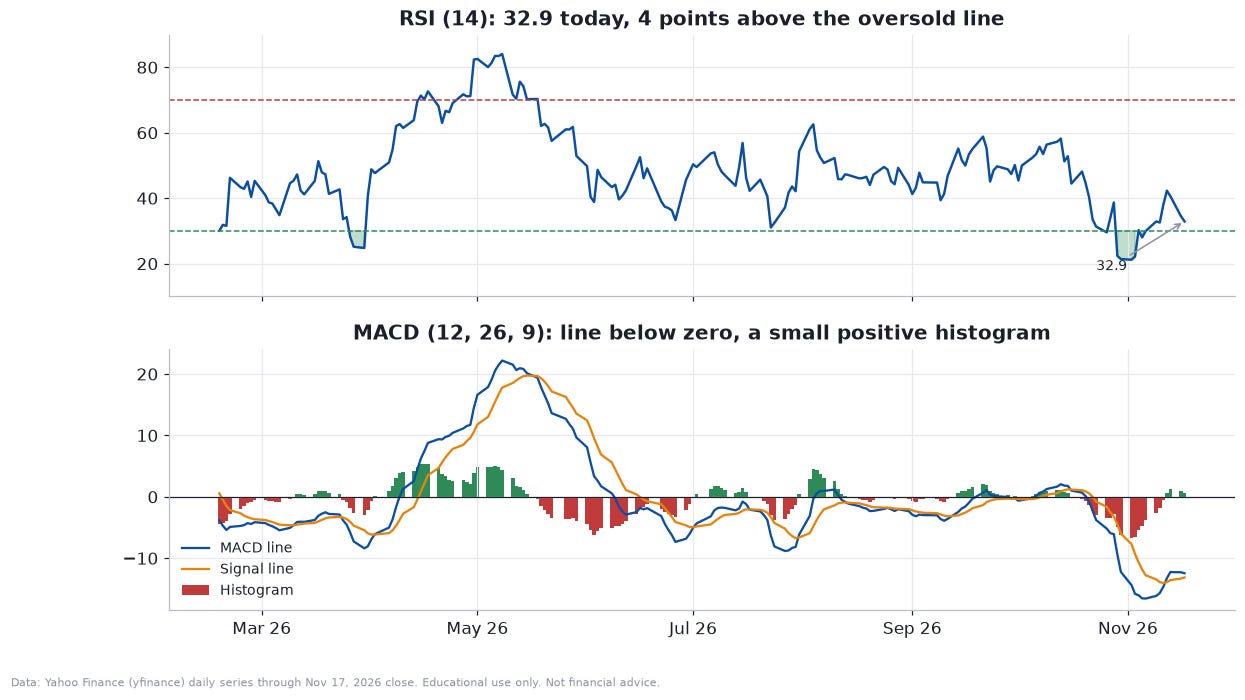
Momentum indicators are oversold but not yet reversing. The standard relative strength index (RSI), computed over 14 days, is 32.9, after touching 21.2 earlier this month.
In plain English: RSI compares the size of recent up days with recent down days on a 0-to-100 scale. Below 30 means sellers have dominated, which says the move is stretched, not that a bounce is due.
In plain English: MACD is the gap between a fast and a slow average of price, and the histogram H(t) is the gap between that and its own smoothing. The MACD line is $-12.46$ and the signal line is $-13.14$, leaving a small positive histogram of $0.68$ that is shrinking from $1.02$ the day before. It is a very early and very weak sign that downside momentum is fading.
The average true range, a measure of how far the stock typically travels in a day including gaps, is $12.31, or 4.4% of the price.
In plain English: each day’s “true range” is the biggest of the day’s high-to-low spread and the gaps from yesterday’s close, and the ATR averages the last 14. I use the ATR later when I look at stop distances.
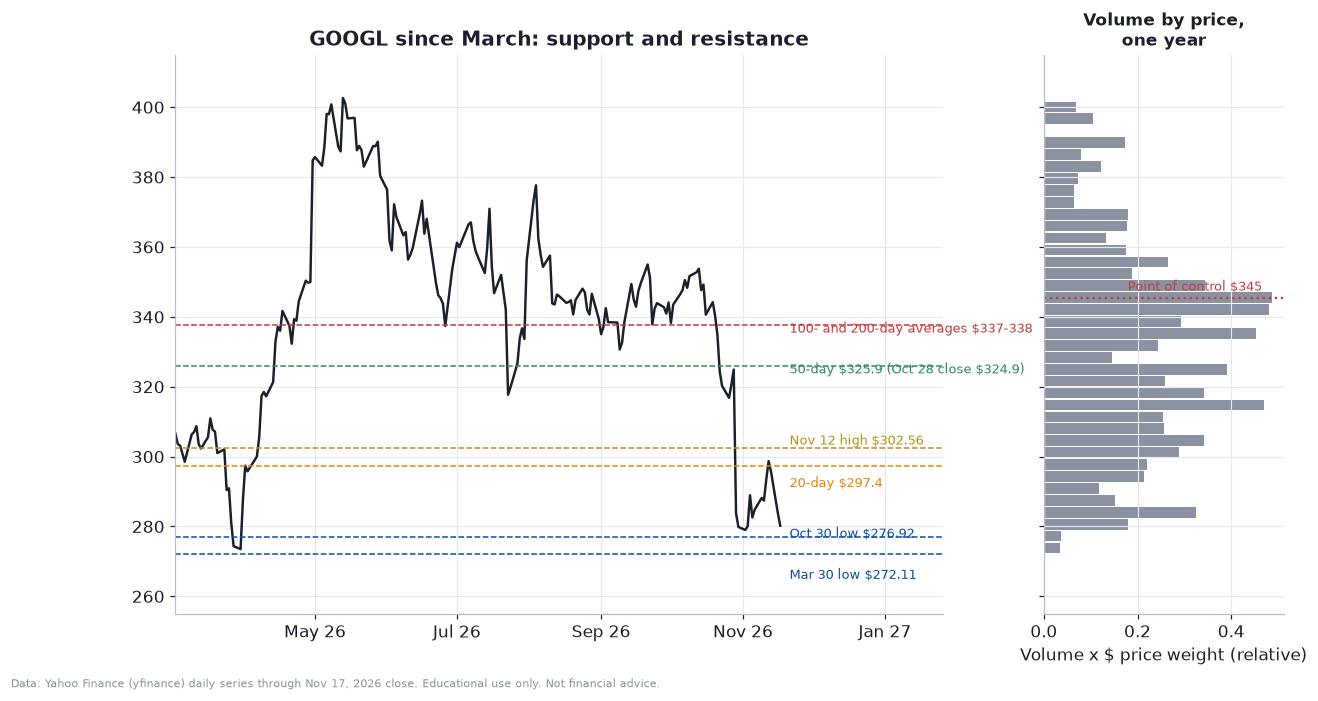
Support and resistance. From recent pivots and a volume profile: support at $276.92 (the October 30 low), $272.11 (the March 30 intraday low and 52-week low) and the prior range at $294 to $296. Resistance at $297 (the 20-day average), $322 to $326 (the 61.8% retracement and the 50-day average), $337 to $338 (the 100- and 200-day averages) and $345 (the point of control, where the most volume traded in the past year). October 29’s volume was 139.7 million shares against a 50-day average of 32.2 million, and Tuesday’s was 31.3 million, so the selling has dried up, though a quiet tape is not the same as a bottom.
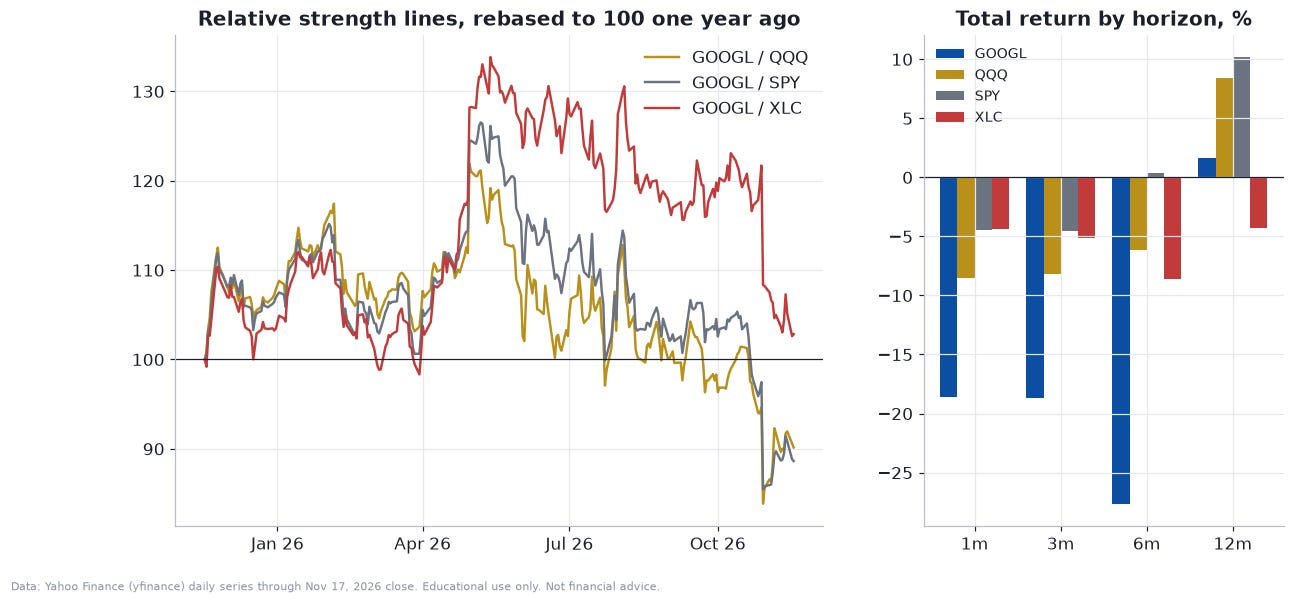
Relative strength. Alphabet’s one-month return is -18.6%, against -8.5% for the Nasdaq-100 ETF (QQQ), -4.4% for the communication-services sector ETF (XLC) and -4.4% for the S&P 500 ETF (SPY). Over three months, it is -18.7% against -8.2% for QQQ. Over six months, -27.6% against +0.3% for SPY. Over twelve months it is roughly flat, +1.6% against +10.2% for SPY. So the damage is stock-specific, not a market event.
In plain English: divide Alphabet’s price by the Nasdaq ETF’s price to get a relative-strength line, and measure how far today’s reading is from its one-year average in standard deviations. Today the ratio is 0.427 against a one-year mean of 0.500, a z-score of -2.25. It is still above its five-year average of 0.388, so the stock has given back relative strength rather than lost it.
The peer picture in the next chart is blunt. NVIDIA fell 28.4% in a month and Oracle 11.3%, so “AI stocks” as a group are under pressure, with Broadcom (+2.1%) the exception, and Apple (+2.7%) the other megacap that held up.
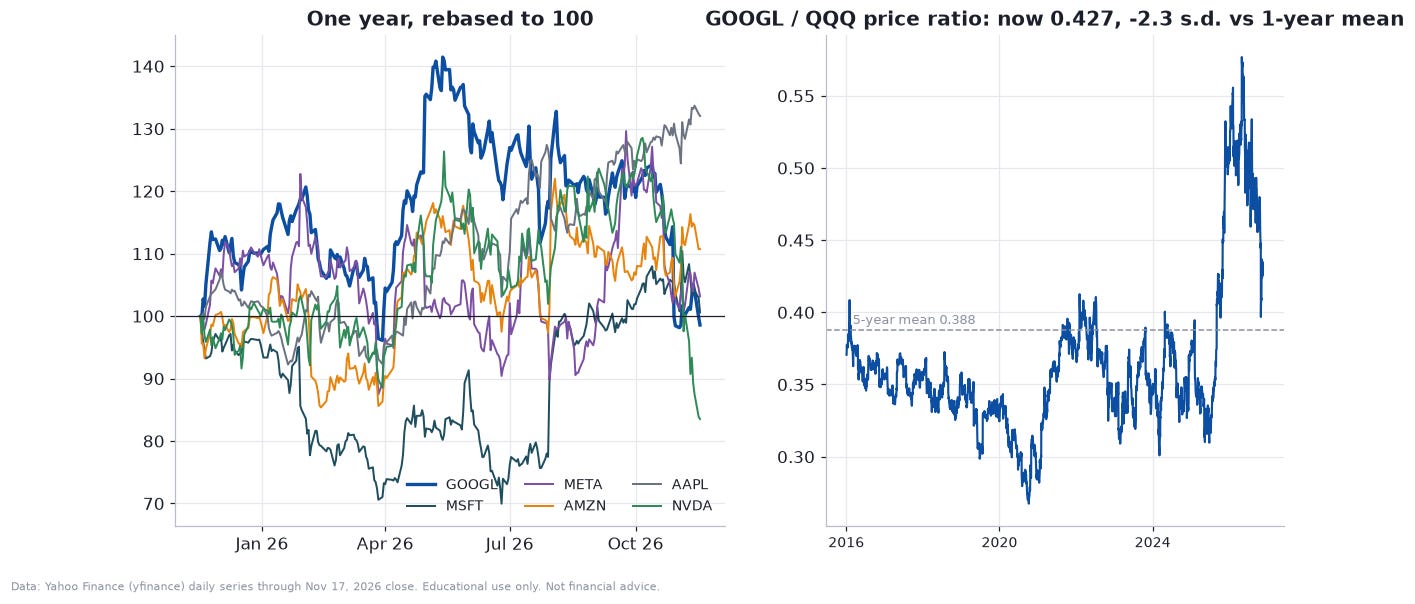
The technical verdict: a broken trend that is oversold and quiet. It needs the stock to reclaim the high $290s, and then the mid-$320s, before the picture changes. A close below $273.50 would be a new 52-week closing low.
The quant section: how Alphabet actually behaves
Now the statistics. Everything here is computed from Yahoo Finance daily data for GOOGL through November 17, 2026 and option chains pulled after the close, unless I say otherwise. I flag where an assumption of mine drives a result.
The return distribution
Start with how the stock’s daily returns are spread. I use log returns, which add up over time.
In plain English: a log return is the natural logarithm of today’s price divided by yesterday’s. Volatility is the standard deviation of those returns, scaled by the square root of the 252 trading days in a year so that a daily number becomes an annual one.
Over the past five years (1,260 trading days), Alphabet’s annualized volatility has been 32.6%. Its daily returns have a skew of -0.20 and an excess kurtosis of 4.09. Excess kurtosis is how much fatter the tails are than a normal bell curve, which scores zero. A value of 4 means big moves happen far more often than a normal distribution allows, and a formal normality test rejects at any sensible threshold. Over the past year the numbers are more extreme, with a skew of -0.62 and an excess kurtosis of 7.7, driven by the October 29 fall.
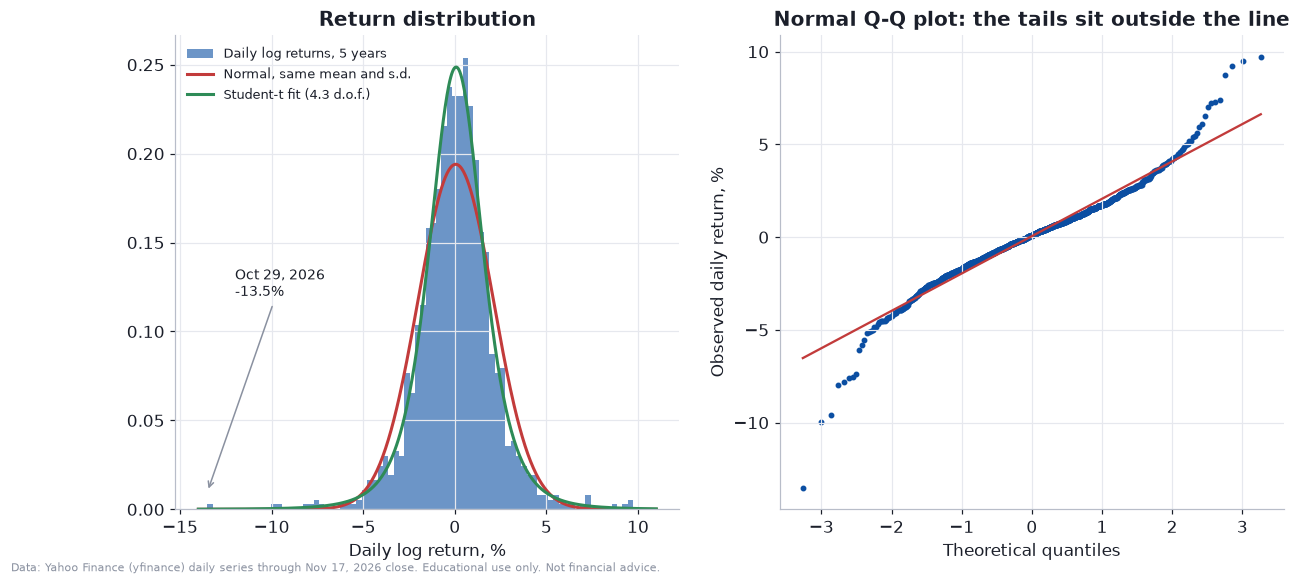
Look at the tails. The worst day in my data was October 29, 2026, a log return of -13.5%, followed by March 16, 2020 (-12.4%), October 25, 2023 (-10.0%) and October 26, 2022 (-9.6%). Three of those four came the morning after an earnings report, and two of the three best days (+9.7% on April 26, 2024 and +9.5% on April 30, 2026) were earnings reactions too. The fifth-percentile daily return is -3.2% and the first percentile is -5.1% over five years, against -3.3% and -4.7% for a normal curve with the same mean and spread. A Student-t distribution with about four degrees of freedom, the fit I use below, tracks the real shape much better.
Volatility: realized, EWMA and GARCH
Volatility is not constant. It clusters: big days follow big days. Two standard tools capture that.
In plain English: tomorrow’s variance is a base level (ω), plus a reaction to yesterday’s surprise (α times the squared shock ε), plus a memory of yesterday’s variance (β). This is the GARCH(1,1) model. The sum α+β says how slowly shocks fade, and the half-life converts that into days. The simpler “EWMA” estimate is a special case with exponentially declining weights on past squared returns.
I fit GARCH with Student-t errors to daily returns from 2019 to date. A longer sample gave a persistence of 0.9989, so close to 1 that the model never forgets, so I restricted the fit to the more recent period. The fitted values are ω = 0.121 (percent squared per day), α = 0.066, β = 0.909 and about 4.0 degrees of freedom. Persistence is 0.975, the half-life is 27.9 trading days, and the long-run volatility is 35.2% a year. The model’s estimate of today’s conditional volatility is 45.0%, and a simple EWMA gives the same.
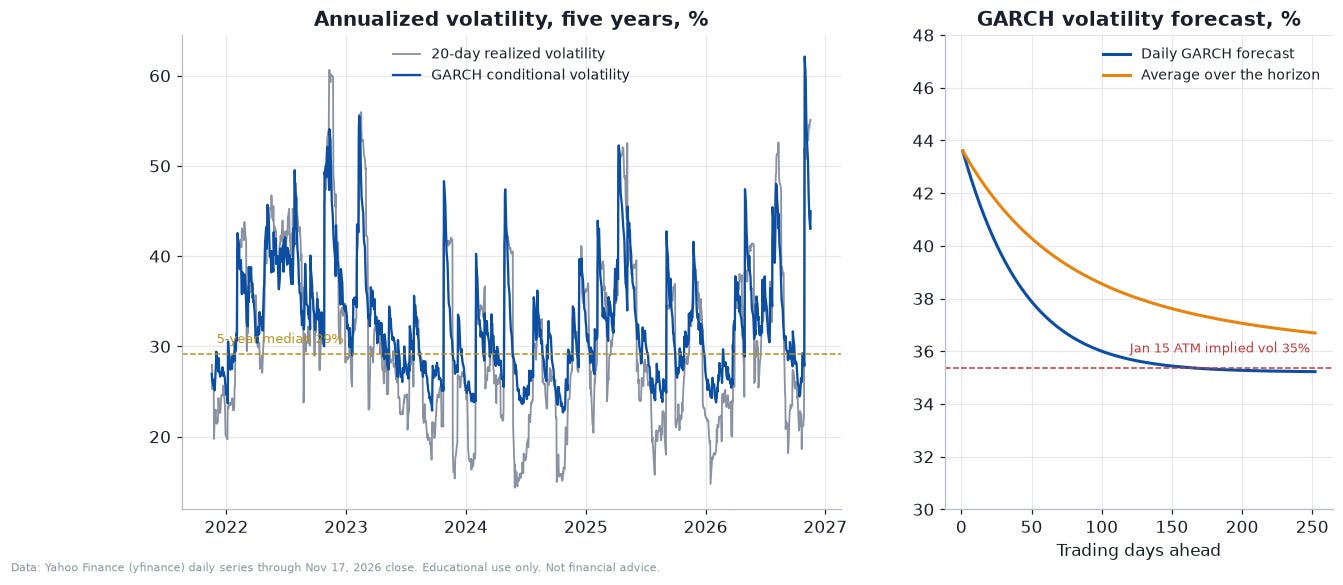
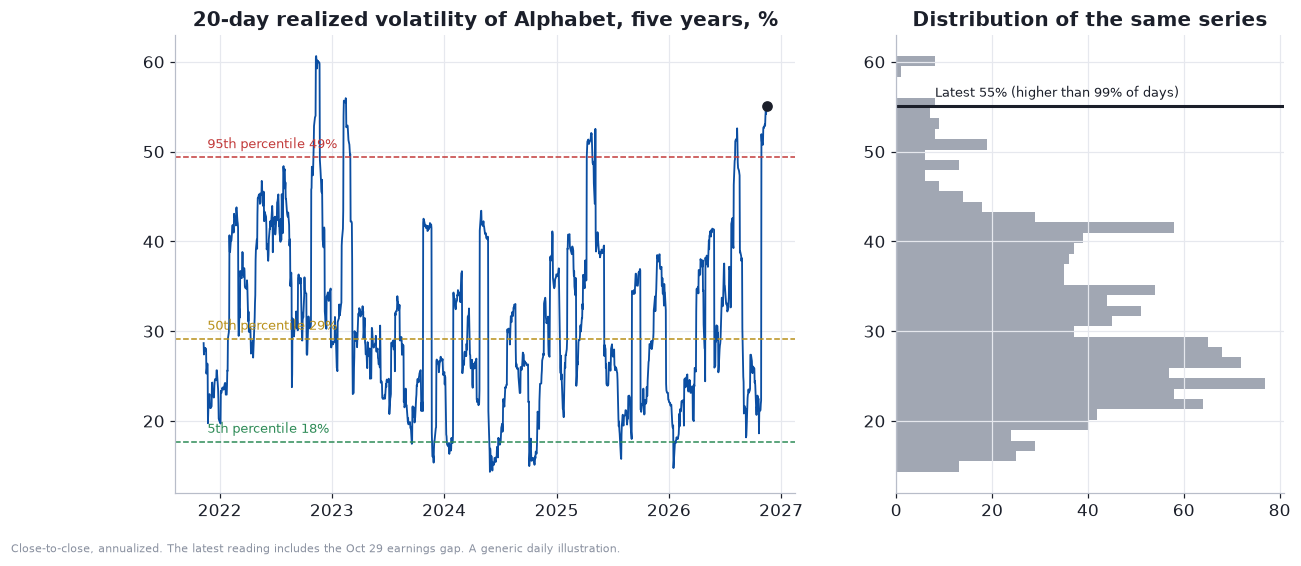
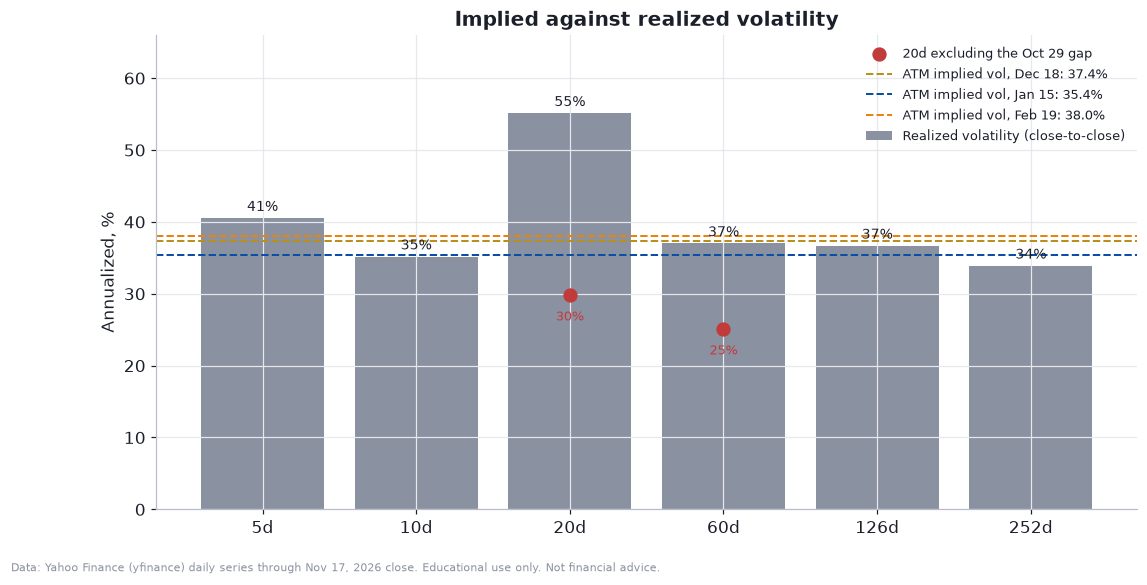
The practical read: the model expects volatility to drift from 45% toward 35%, averaging about 41.8% over the 23 trading days to December 18 and 36.7% over a year. Realized volatility over the last 20 trading days is 55.1%, in the 99th percentile of the past five years (the median is 29.2%), but that number is dominated by one day. Without October 29, 20-day realized volatility is 29.8% and 60-day is 25.1%, and in the 13 trading days since the earnings reaction it has been 31.2%. The stock has been volatile mostly because of one gap.
Beta to the market and what the stock responds to
Beta measures how much a stock moves for a given move in the market. It is the slope of a regression.
In plain English: fit a line through Alphabet’s daily returns plotted against the S&P 500 ETF’s. The slope is beta, and a beta of 1.2 means the stock tends to move 1.2% for each 1% in the index.
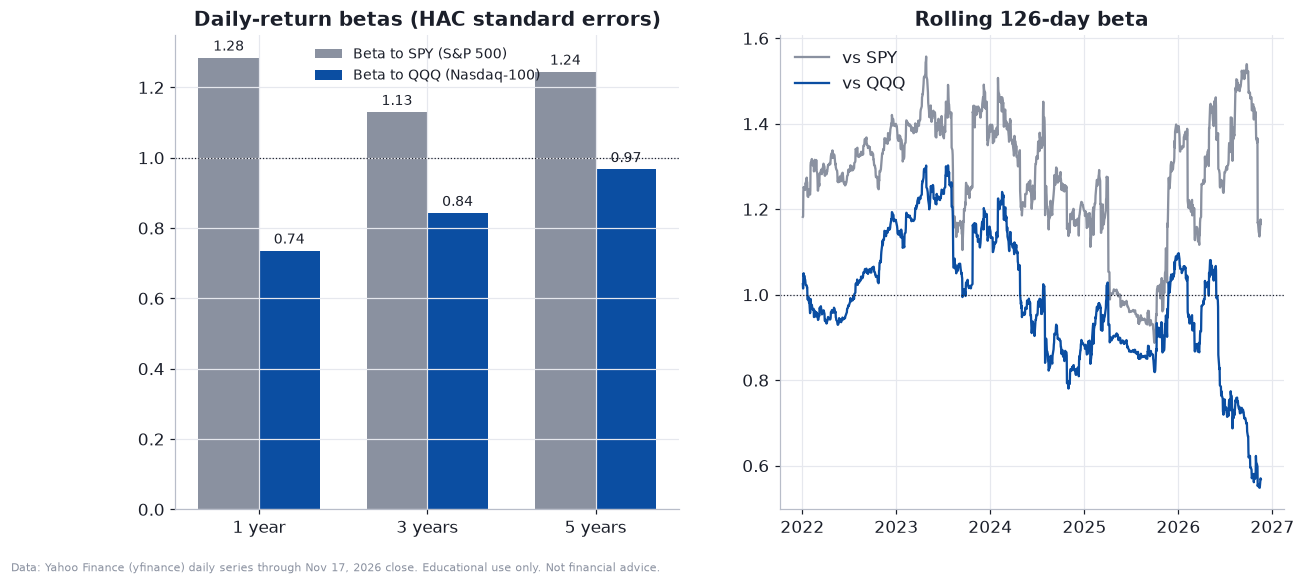
Against the S&P 500 ETF (SPY), Alphabet’s daily-return beta is 1.28 over one year, 1.13 over three and 1.24 over five. Against the Nasdaq-100 ETF (QQQ) it is much lower: 0.74, 0.84 and 0.97. The rolling 126-day beta against QQQ has fallen to about 0.57, within a hair of its lowest reading since the data begin in 2016 (0.55 on November 12), while the beta against SPY is near 1.17. Alphabet has been trading increasingly on its own news and apart from the Nasdaq.
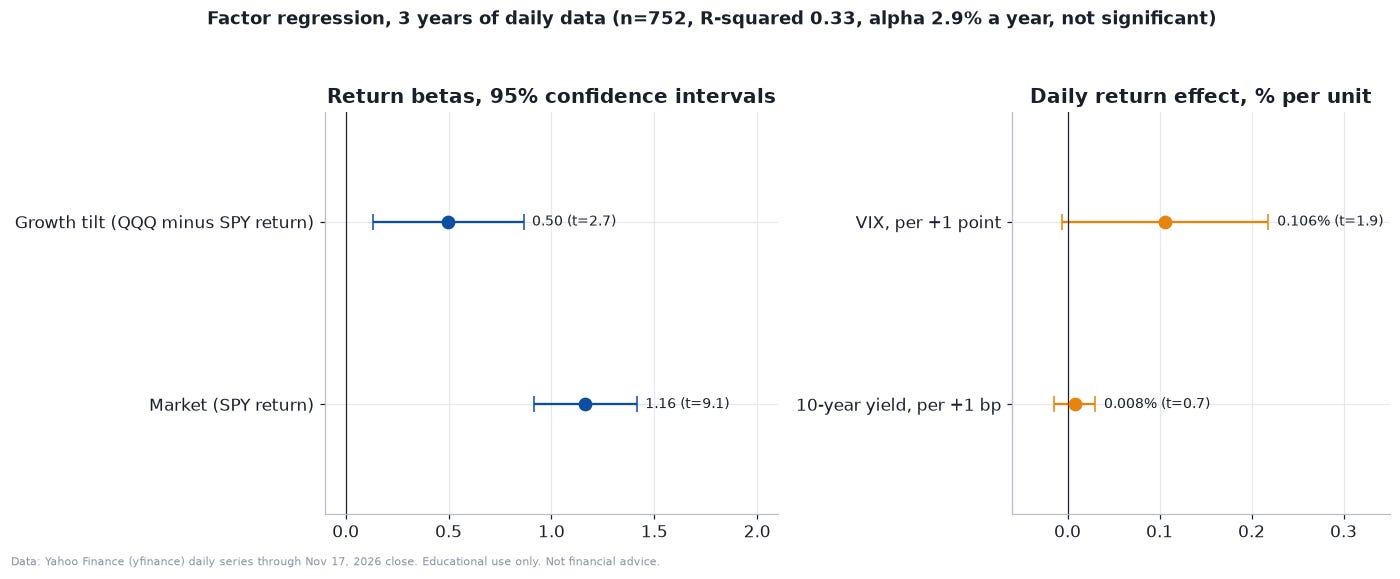
A single beta hides what is driving the stock, so I run a multi-factor regression over three years (752 days) with the market, a “growth tilt” (QQQ’s return minus SPY’s), the change in the 10-year yield and the change in the VIX.
In plain English: separate how much of Alphabet’s daily move comes from the broad market, from tech leading or lagging the market, from rates and from fear. The results:
Market: 1.16 (95% interval 0.91 to 1.42, t-statistic 9.1). Growth tilt: 0.50 (0.13 to 0.87, t-statistic 2.7). - Rates and VIX: +0.008% per basis point of change in the 10-year yield (t-statistic 0.7) and +0.11% per one-point rise in the VIX (t-statistic 1.9), neither reliably different from zero. Alphabet tends to rise slightly on days when the VIX rises, after controlling for the market, a sign that surprised me. - Alpha: 2.9% a year, which is not significant (t-statistic 0.2), as one would expect from a single stock. The R-squared is 0.33, so two-thirds of daily variation is stock-specific.
The solid conclusions are the market beta of about 1.2 and the fact that most of the stock’s daily moves come from something other than the factors in the model. I would not lean on the rates and VIX coefficients; the sample is short and the standard errors are wide.
Monte Carlo: probability cones
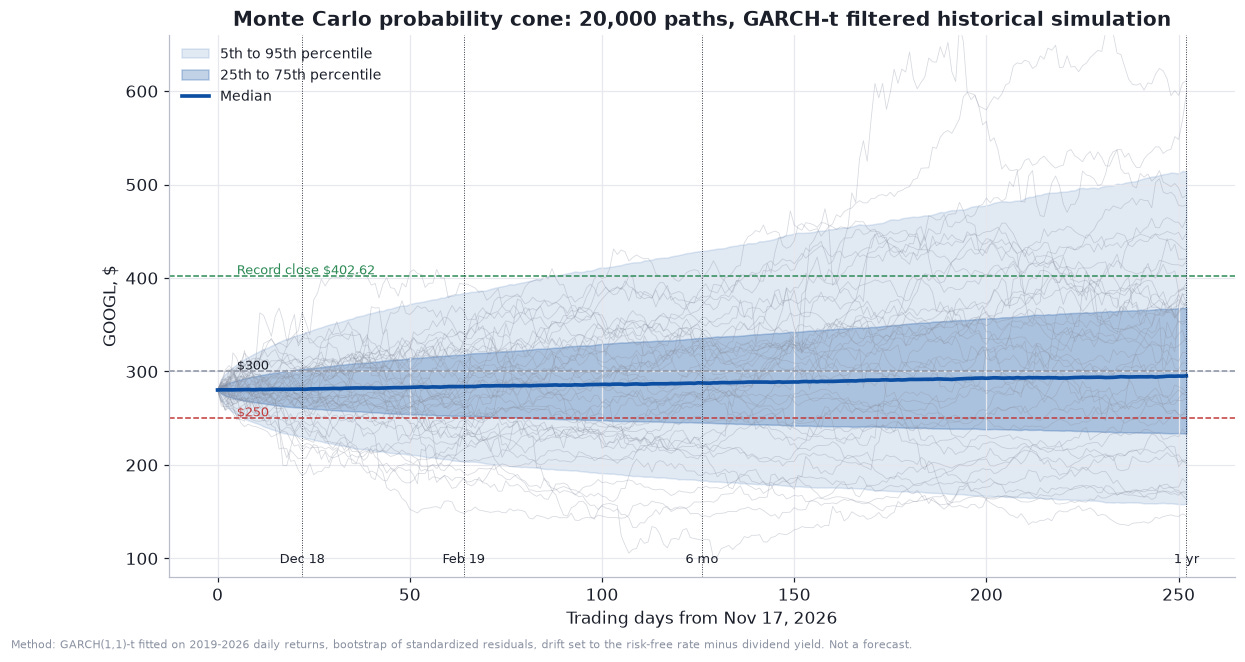
To turn volatility into a range of outcomes, I simulate 20,000 price paths for a year of trading days. Each path follows the same one-day step.
In plain English: tomorrow’s price is today’s times the exponential of a small drift m plus a random shock: the GARCH volatility σ times a random draw z. I draw z from the model’s own standardized past residuals (a bootstrap), preserving the fat tails, and set the drift at the risk-free rate (4.14%) minus the dividend yield, 3.83% a year. The simulation is deliberately neutral: it does not assume the stock will do better or worse than cash.
The results, from $280.20:
To December 18 (22 trading days): median $281, 5th to 95th percentile $230 to $340.
To February 19 (64 days, after the next earnings report): median $284, 25th to 75th percentile $253 to $318, 5th to 95th percentile $204 to $384.
To one year: median $295, mean $311, 5th to 95th percentile $158 to $514. The mean is above the median because the distribution is skewed to the upside, which comes with compounding.
How likely is the stock to touch a level along the way, not just end there? That is a “first-passage” question, and the reflection principle gives a rough answer for a driftless random walk.
In plain English: the chance of touching a level H at any point is about double the chance of ending above it, because a path that touches the level and then falls back still counts. Φ is the standard normal cumulative distribution.
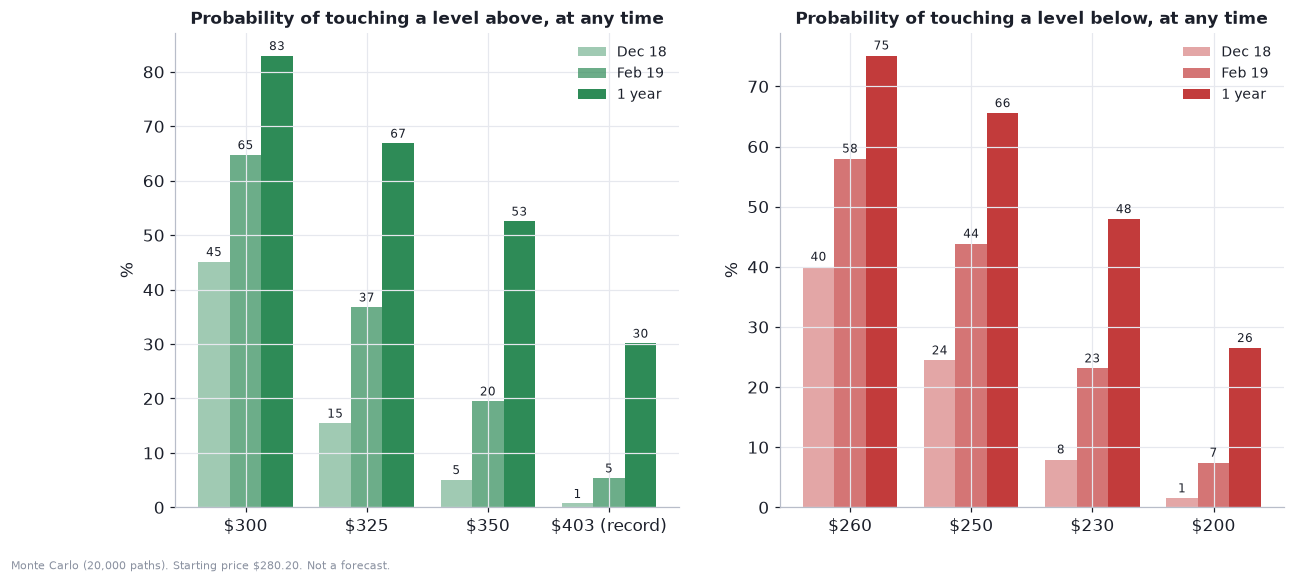
On the simulation, the chance of touching $300 by December 18 is 45%, $325 is 15% and $350 is 5%. On the downside, $260 is touched with 40% probability, $250 with 24% and $230 with 8%. By February 19 those become 65%, 37% and 20% on the upside and 58%, 44% and 23% on the downside. The chance of touching the old record close of about $403 within a year is 30%. The odds of ending above today’s price are 51% by December 18, 53% by February 19 and 56% in a year. That is what 40%-plus volatility does to a stock with no assumed edge. The median maximum drawdown along a one-year path is -28%.
Value at Risk and Expected Shortfall
VaR asks how much you could lose on a bad day. CVaR (also called expected shortfall) asks how much you lose on average when you are already in the bad tail.
In plain English: VaR at 95% is the loss that is exceeded on only 5% of days. CVaR is the average loss on those worst 5% of days. I compute both three ways for a $100,000 position: from the past five years of actual returns, from a normal distribution, and from the GARCH-t simulation, which reflects today’s elevated volatility.
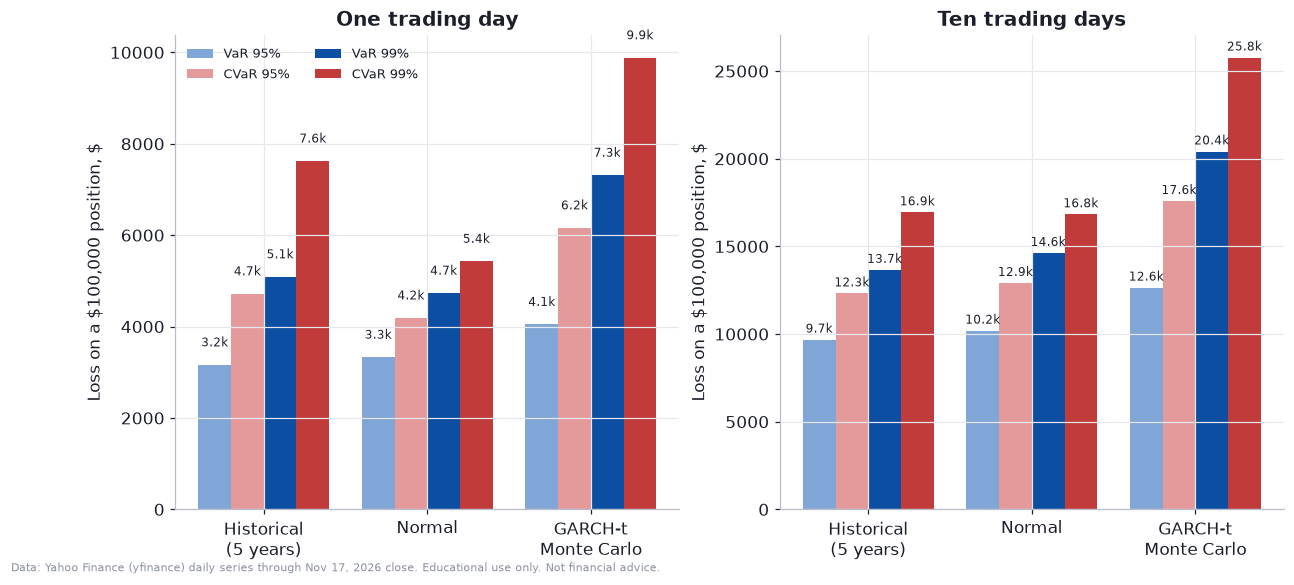
One day, 95% VaR: $3,165 (historical), $3,332 (normal), $4,050 (GARCH-t). CVaR: $4,721, $4,191 and $6,163.
One day, 99% VaR: $5,092, $4,734 and $7,314. CVaR: $7,624, $5,431 and $9,885.
Ten days, 95% VaR: $9,678, $10,189 and $12,645. CVaR: $12,314, $12,907 and $17,583. At 99% over ten days, the GARCH VaR is $20,410 against $13,655 historical.
The GARCH numbers are 28% to 52% higher than the historical ones because the model starts from 45% volatility, not the five-year average. The normal-distribution method understates the 99% one-day CVaR by about 29% against history, which is the textbook case for why a bell curve is not enough for a stock like this.
What the options market says
The options market is a forward-looking measure of volatility. First, a pricing reference. The Black-Scholes value of a call, adjusted for the dividend, is:
In plain English: the call is worth the stock you would receive (weighted by N(d1)) minus the discounted strike you would pay (weighted by the probability, N(d2), that you exercise). Everything is known from the market except σ, so I solve for the σ that matches each quoted option price. That is the implied volatility.
An at-the-money straddle (a call and a put at the same strike) is a quick way to read the market’s expected move.
In plain English: the price of the straddle is roughly the market’s expected absolute move, and dividing by 0.8 converts it into a one-standard-deviation move.
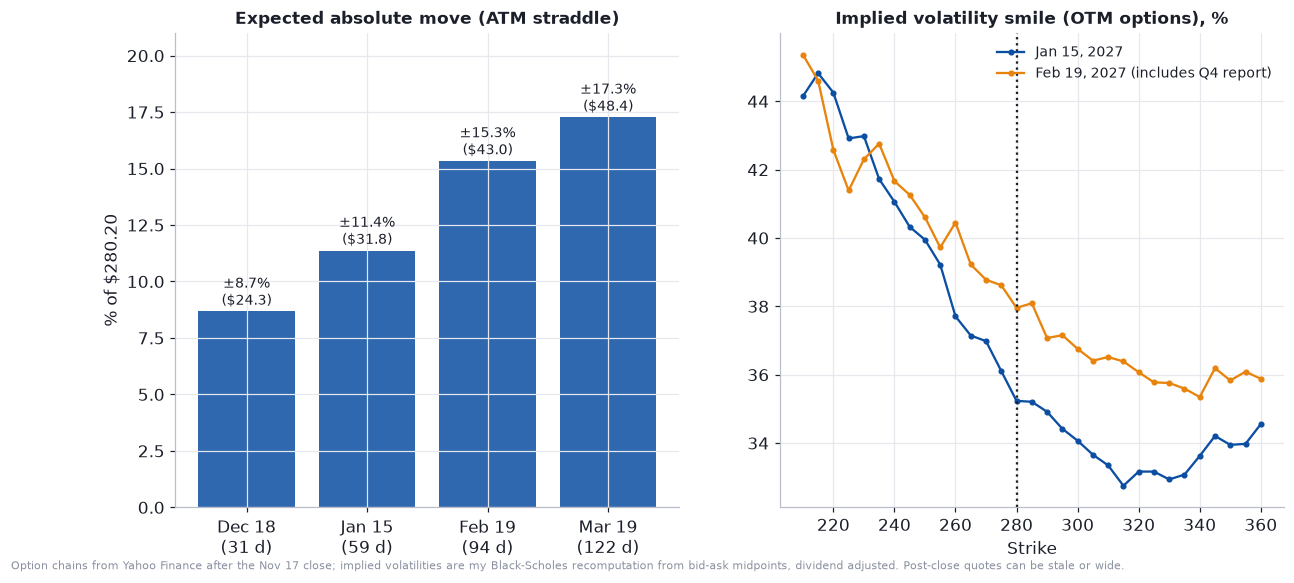
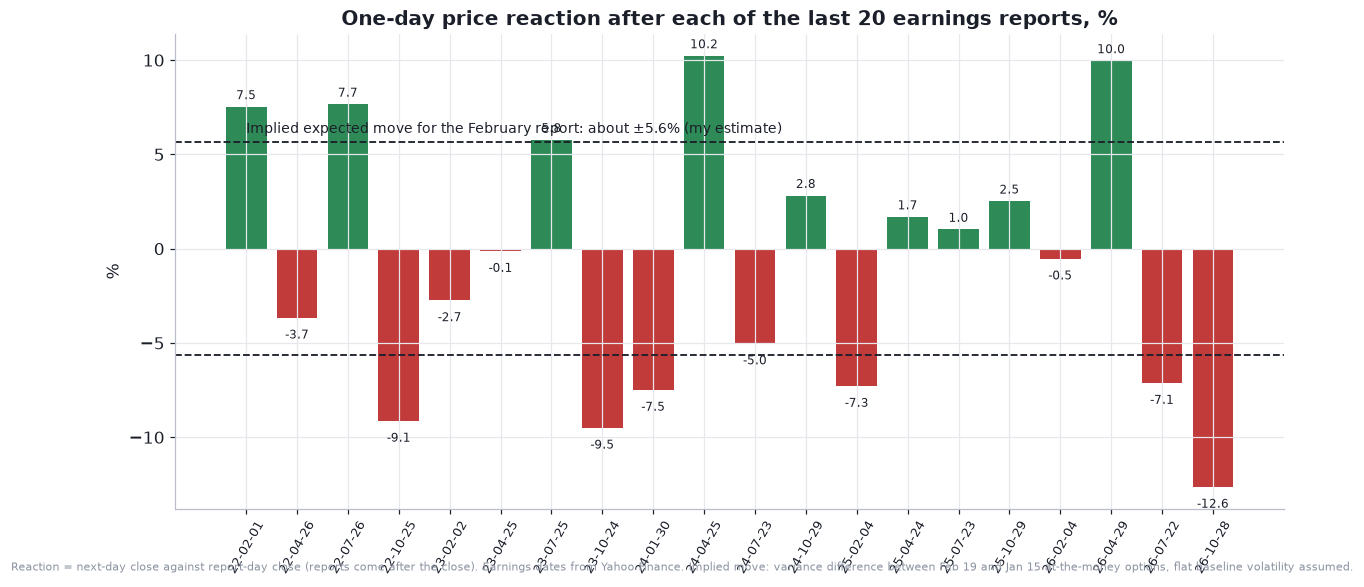
From post-close midpoints, the at-the-money implied volatility is 37.4% for December 18, 35.4% for January 15, 38.0% for February 19 and 37.7% for March 19. The straddles imply expected moves of $24.29 (±8.7%) to December 18, $31.85 (±11.4%) to January 15, $42.96 (±15.3%) to February 19 and $48.37 (±17.3%) to March 19. February’s implied volatility is higher than January’s because the February expiry contains the earnings report. Subtracting the variance of the two expiries gives an implied earnings move of about ±5.6%, against an average absolute reaction of 5.7% over the past 20 reports.
Two more details. First, the smile: for January 15, a put at about 90% of the price ($250) has an implied volatility of 39.9%, against 33.3% for a call at about 110% ($310). That 6.6-point skew means the market charges more for downside protection than for upside exposure. Second, at-the-money implied volatility of 35% to 38% is above the 25% to 30% of realized volatility without the October 29 gap, and below the 55% with it. It is priced as if more gaps are possible.
For futures traders, the fair value of the December contract (SGOOG or XGOOG) follows from the cost of carry.
In plain English: a futures price is the stock price, less the present value of dividends you would not receive, grown at the risk-free rate for the time to expiry. With the $0.22 dividend that goes ex on December 7 and a 4.14% rate, fair value for the December 18 contract is $280.97, or about 77 cents above spot.
Option strategy payoffs
The charts below show payoffs at January 15 expiry, using bid-ask midpoints. These are illustrations of how the structures behave, not recommendations, and they ignore margin, early assignment, taxes and commissions.
In plain English: a covered call is owning the stock and selling a call. Your profit is the stock’s change, plus the premium you collected, minus whatever the call costs you at expiry if the stock rises above the strike.
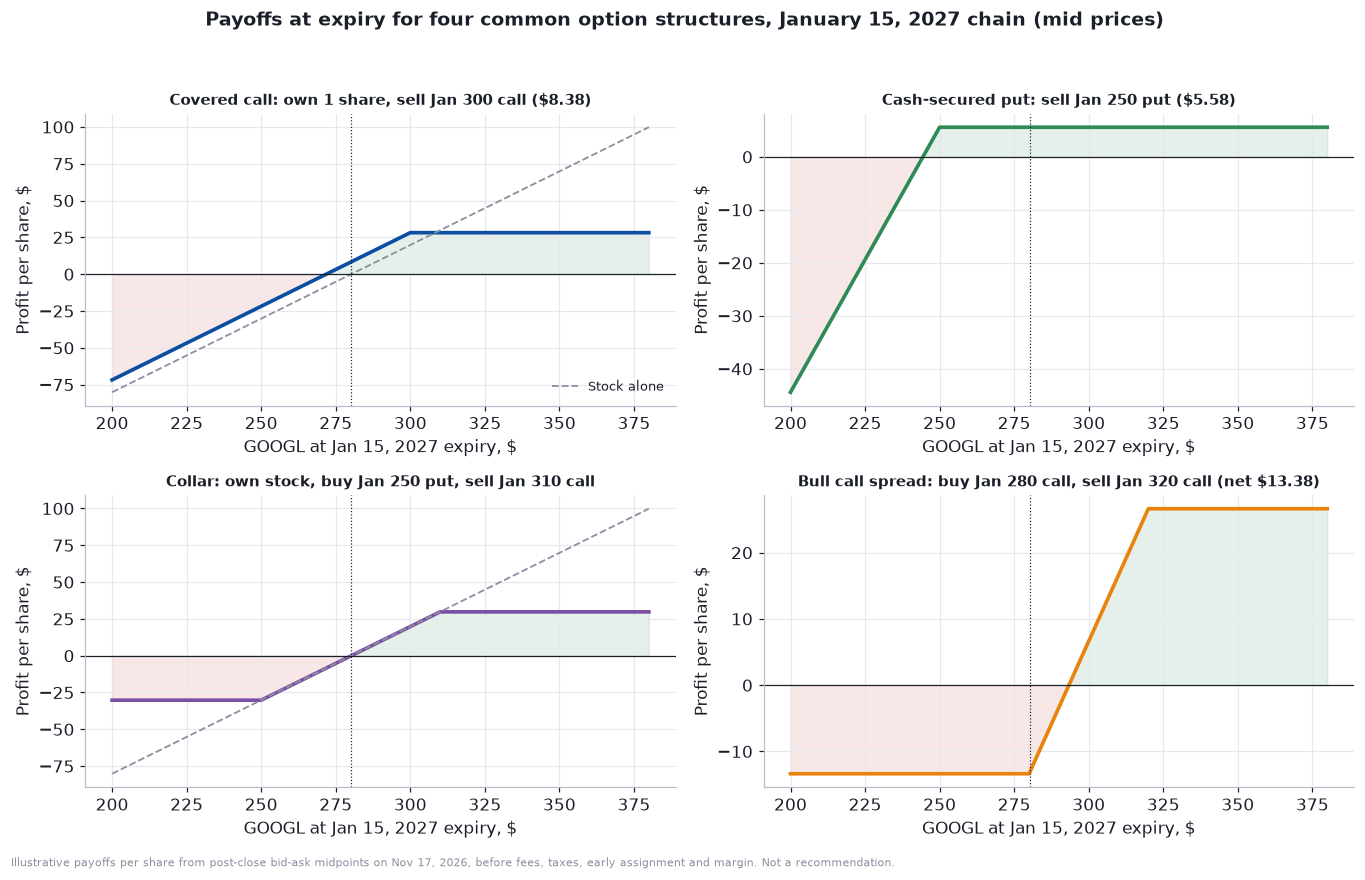
Covered call: own a share, sell the $300 call for $8.38. Maximum gain $28.18 per share (stock at or above $300); downside break-even $271.83. Cash-secured put: sell the $250 put for $5.58 with cash set aside. Maximum gain $5.58; break-even $244.43. Collar: own the stock, buy the $250 put and sell the $310 call, for a net cost of about five cents, confining profit and loss to roughly -$30 to +$30 per share. Bull call spread: buy the $280 call at $17.00 and sell the $320 call at $3.63, for a net cost of $13.38. Maximum gain $26.63, maximum loss $13.38, break-even $293.38.
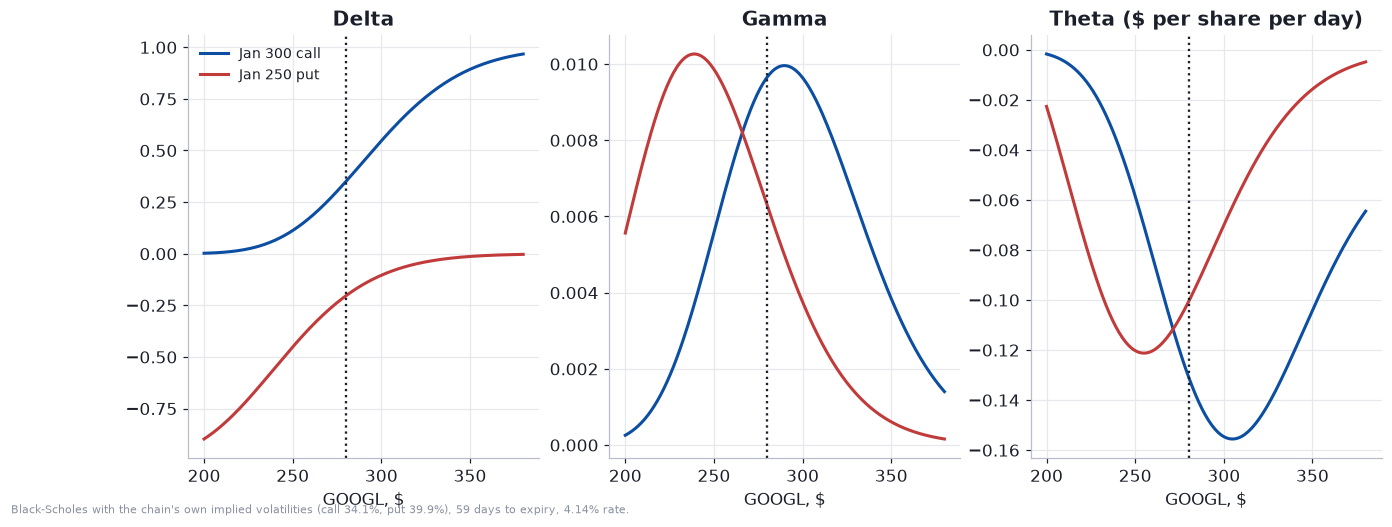
The chart below shows delta (the option’s move per $1 in the stock), gamma (how fast delta changes) and theta (the daily cost of time) for the $300 call and the $250 put. An option bought into an earnings report can lose value even if the stock moves the right way, because implied volatility drops after the event.
The bot against the stock
Now to the second thread. This section tests the pieces of the bot’s design that can be tested with public data, then sets it beside the Alphabet view I have built up. Everything is at the concept level. None of the bot’s own parameters appear, and the tests use generic stand-ins I built from standard indicator settings, not the bot’s.
Test one: does a momentum score lead returns in Alphabet?
The bot’s entry idea is that when a composite of trend, RSI, MACD, breakout and volume readings is high relative to its recent history, the next move up is more likely. I built a generic version on Alphabet’s daily bars from 2016 to 2026: standard readings, equal weights, and an “entry-ready” flag when the score sits above its own recent typical level. The flag was on for 42.7% of days. I then compared the average return over the following 5 and 10 trading days after flagged days against all other days, using the usual two-sample comparison.
In plain English: it asks whether the gap in average returns between the two groups is large compared with how noisy those averages are. A gap that is small relative to the noise is, statistically, nothing.
Next 5 trading days: after flagged days (1,167 of them) Alphabet averaged +0.42%, against +0.35% after all other days (1,563). The difference is +0.07 percentage points, with a bootstrap 95% interval from -0.22 to +0.37 and a p-value of 0.62. The hit rate (share of positive outcomes) was 58.3% against 56.2%.
Next 10 trading days: +0.75% against +0.76%, a difference of -0.01 percentage points (interval -0.42 to +0.38, p = 0.97). The hit rate was 61.6% against 57.4%.
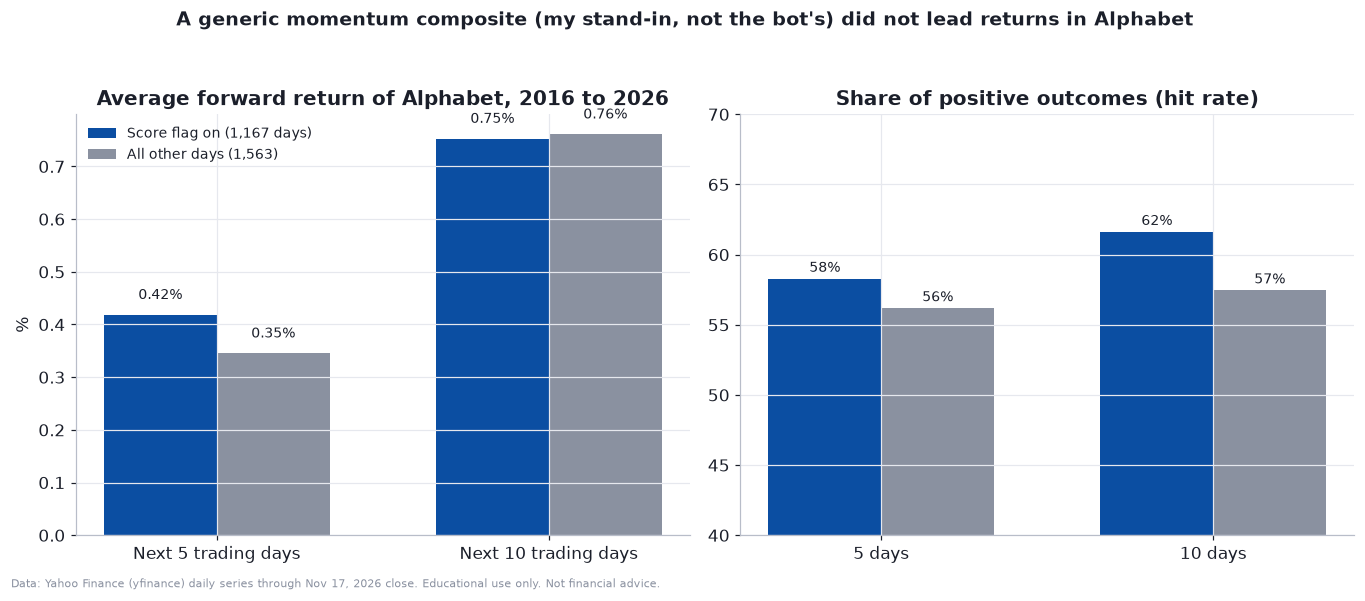
The flag did not separate good days from bad ones for returns, though it showed a slightly higher share of winners. Two caveats: the stand-in is generic and uses daily bars, so it is a loose analog, not a replication; and a long-only trend system does not need the entry flag to lead returns to make money. It needs winners to run further than losers, which I cannot test without the bot’s trade history. Today the generic flag is off, with the score at 28 against a typical-level line near 36.
Test two: how often does a volatility stop get hit?
The bot sets its stop at a multiple of ATR. I can measure from history how often a stop at k times the average true range below entry would have been touched within a few days, using daily lows, 2016 to 2026:
One ATR away: touched within three days 34% of the time, within five days 45% and within ten days 58%.
Two ATRs: 11%, 19% and 30%.
Three ATRs: 4%, 8% and 17%.
The reflection-principle formula from the quant section gives similar but slightly higher answers, as expected, since it assumes continuous watching while I checked daily lows.
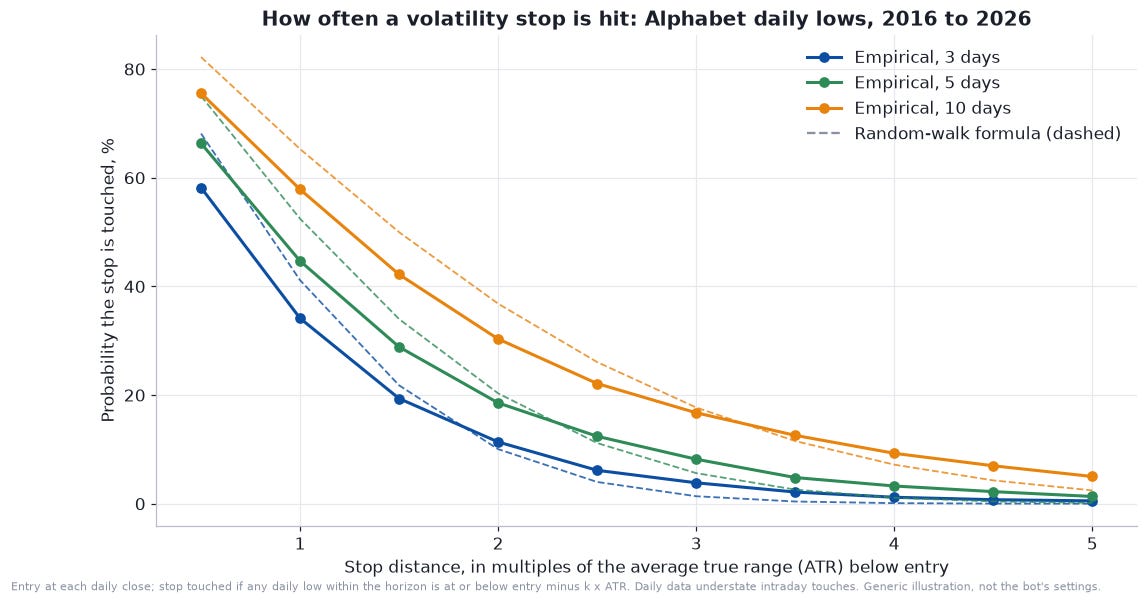
The lesson is not about the bot’s setting, which I do not disclose. A tight stop, one ATR away as a generic example, gets hit more often than not within two weeks on a stock like Alphabet even if the thesis is right, so whether a stop pays depends on how big the winners are. Today’s ATR is $12.31, or 4.4% of the price, so even a stop two ATRs away is about $25 (nearly 9%) from entry. A stop also does nothing against a gap: on October 29 the stock opened at $286.88 after closing at $324.89, and traded no higher than $288.33.
Test three: does the “AI rotation” label mean anything?
The label says the bot plays a divergence between Alphabet and NVIDIA and Oracle. The code has no NVIDIA or Oracle input and no divergence calculation, so I cannot test its logic. I can test the idea in the label: if Alphabet has outperformed those two over the last 20 trading days, do its next 10 days look better?
In plain English: G is Alphabet’s 20-day return minus the average 20-day return of NVIDIA and Oracle. A positive value means Alphabet is leading the pair. I split every day since 2016 into thirds by G and look at Alphabet’s average return over the next 10 trading days.
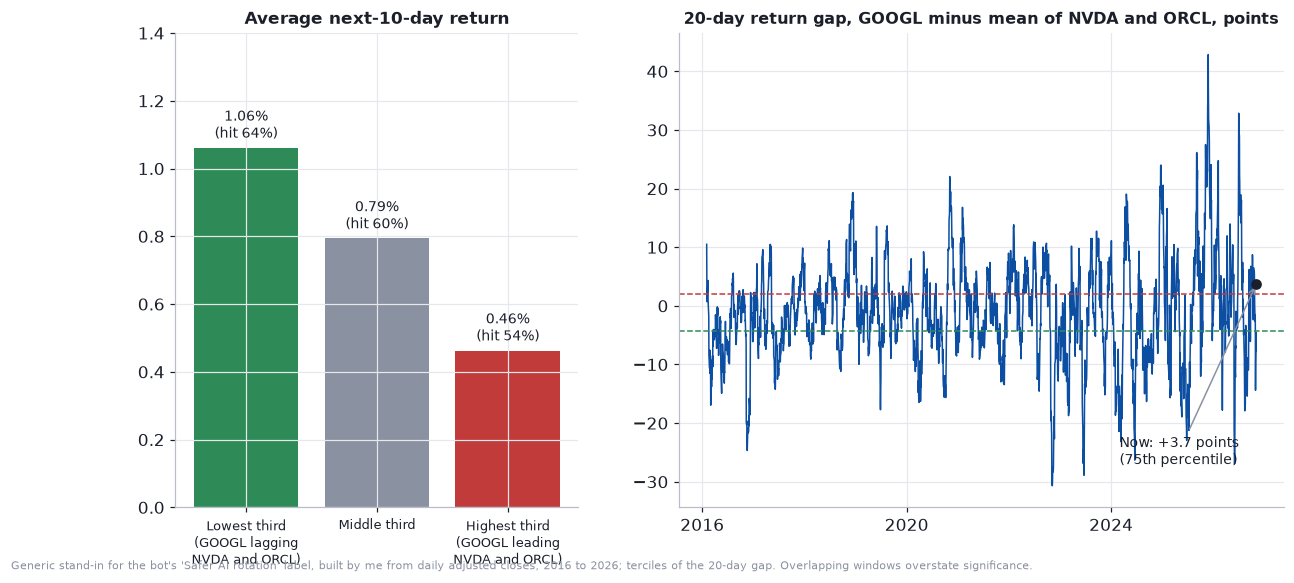
The result runs the opposite way from the label. After days when Alphabet lagged the pair most, its next-10-day return averaged +1.06% (64% hit rate). In the middle third it was +0.79% (60%), and after days when Alphabet led most it was +0.46% (54%). The high-minus-low difference is -0.60 percentage points, with an interval from -1.11 to -0.07 and a p-value of 0.019. Because 10-day windows overlap, that p-value is overstated, so I call it “no support for the label,” not “evidence it backfires.”
Where is the gap today? Over the last 20 trading days Alphabet is down 19.4%, NVIDIA 33.1% and Oracle 13.1%. The gap is +3.7 points, in the 75th percentile and the “leading” third. But nobody is diverging upward. All three are falling, and Alphabet is simply falling less than the average of two stocks that have been hit harder.
The header profit range, as arithmetic
The script’s header carries a “short-term profit potential” estimate of $700 to $3,500, with no stated horizon, number of trades, test period or contract size. I treat it as unverified, since I have no trade log, backtest or live results behind it. But I can ask what it would require of Alphabet’s price.
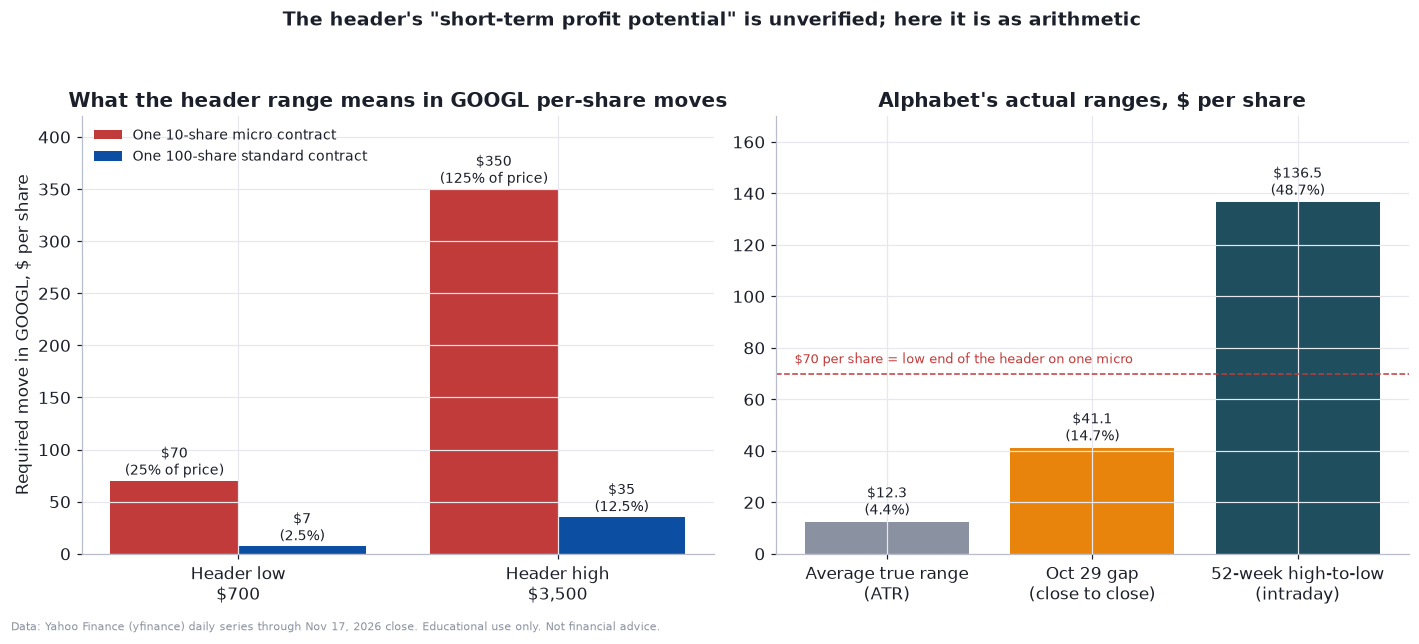
On a 10-share Micro contract every $1 per share is worth $10, so $700 needs a $70 move per share, which is 25% of today’s price, and $3,500 needs $350, or 125%. For one 100-share standard contract, the figures are $7 and $35 per share, or 2.5% and 12.5%. Alphabet’s own ranges: an average true range of $12.31 a day, the October 29 gap of $41.07, and a 52-week intraday range of $136.50 (from $272.11 to $408.61). Whatever number of contracts the bot trades, the arithmetic says the header is an unverified claim, not an expectation.
The plumbing risks
The symbol. “XGOOGL” is not the code CME lists for Micro Alphabet (XGOOG). If the framework matches symbols exactly, the bot may receive no data.
Gates it does not control. Several gates (the momentum gauge, warm-up, spread and stale-data checks) come from a parent framework I cannot see, so I cannot evaluate them from the file.
A gate that cannot fail. One of the bot’s own entry checks, a reward-to-risk validation, is built so that it passes every time. It looks like protection but does no work.
Simulated fills. Entries and exits are logged at the midpoint of the latest bar, so the bot never pays the spread or slippage. That overstates what a live account would get, particularly in a new contract that may be thin. CME’s single stock futures launched on July 27, 2026, and I found no public volume or open-interest figures for XGOOG.
Contract expiry. The December contract stops trading on December 18, and the bot has no roll logic.
A noisy correlation gate. Standing aside when Alphabet moves in lockstep with Nasdaq futures is sensible for a stock whose beta to the Nasdaq has recently been low, but a correlation from a short stream of price changes is noisy.
Event blindness. There is no earnings calendar, so a position held through the February 3 report is exposed to a move that has averaged about 5.7% in absolute terms.
Agreement, conflict and blind spots
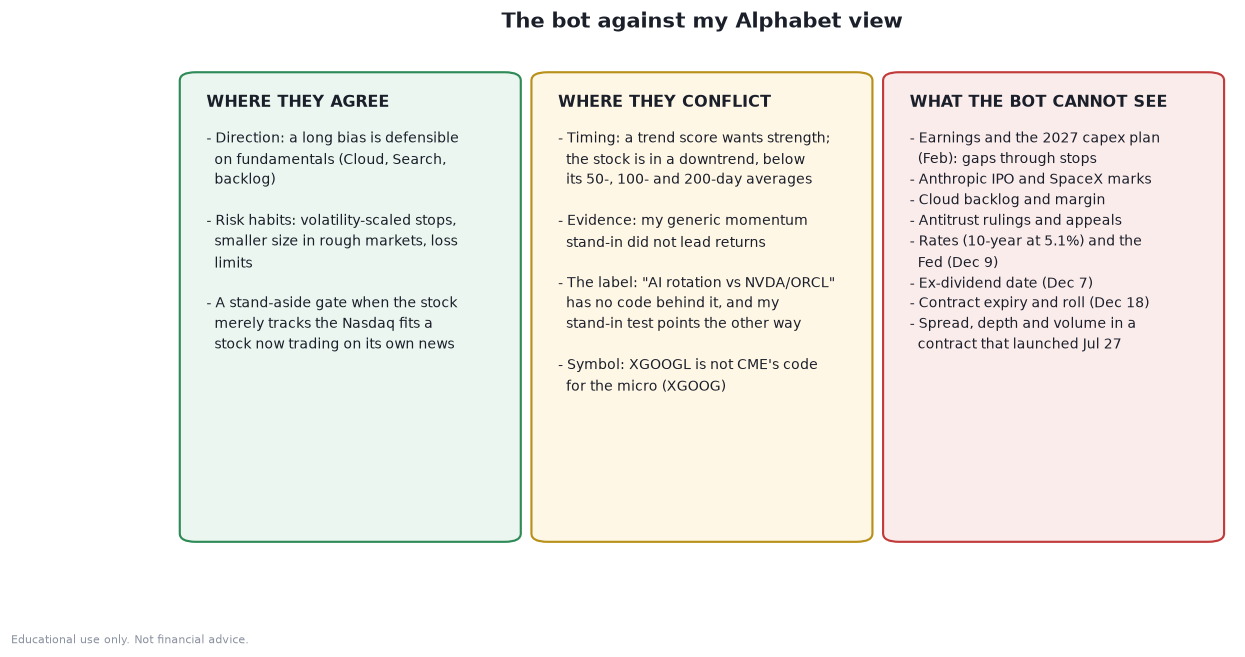
Where they agree. A long bias is defensible on fundamentals: Cloud grew 103%, its margin is 36%, backlog is $561 billion and operating income rose 30%. The risk habits are sound: volatility-scaled stops, smaller size in rough markets, loss limits and a streak breaker matter more for a stock that can gap 12%. And standing aside when the stock only tracks the Nasdaq is a sensible filter, since Alphabet’s one-year correlation with Nasdaq futures is 0.46 and its beta to QQQ has dropped to about 0.57.
Where they conflict. A trend-following score wants strength, and Alphabet has a broken trend: below its 20-, 50-, 100- and 200-day averages, with a death cross on October 29. Waiting for strength can be a feature (it avoids catching a falling knife) or a cost (it misses the turn). My generic momentum stand-in did not lead returns over a decade. The “AI rotation” label has no code behind it, and my stand-in test points the other way. And XGOOGL is not CME’s code for the Micro.
What the bot cannot see. The earnings report and 2027 capex plan in early February, the biggest gap risk on the calendar. Anthropic’s IPO and the SpaceX mark, which move Alphabet’s reported income. Cloud backlog, margin and capacity. Antitrust rulings. Rates and the Fed: the 10-year is at 5.10% and the Fed meets December 8 and 9. The ex-dividend date (December 7) and the contract expiry (December 18). And spread, depth and volume in a contract that is less than four months old.
My view, with scenarios
Here is where I land. The business is strong and the stock’s reaction to October 28 was severe. Cloud is growing at a rate that is rare at this size, with a backlog that supports years of revenue. But Alphabet is now a net borrower and issuer of stock, its free cash flow is negative, Search is growing below expectations, and the price has broken its trend. On valuation the stock sits in the middle of my models: not cheap enough to be an obvious bargain after a 30% drawdown, and not expensive. The decisive variable is the 2027 capex plan and whether it comes with a believable return story.
These are my scenarios through the February 19 options expiry. The percentages are my judgment, nudged toward the simulation’s odds, not model output, and none of this is a forecast.
Bear, 25%: capex and cash burn dominate. The February report brings a 2027 capex figure well above expectations, Cloud margin drops as rented capacity ramps, and Search stays soft. The stock retests $272 and the $230 to $250 area. The simulation gives about a 23% chance of ending February below $250.
Base, 50%: a range while the market waits. Cloud strength and capex worry offset each other. The stock trades between roughly $255 and $320, reclaims the high $290s and fails near the 50-day average at $326. The options market’s expected move to February 19 is about ±15% ($43), so this range sits inside it.
Bull, 25%: the story turns. Search growth stabilizes with AI Mode ads, Cloud margin holds in the mid-30s, and the 2027 capex comes with a financing and returns outline the market accepts. The stock reclaims $326 and heads for $340 to $350. The simulation gives about a 37% chance of touching $325 by February 19 and a 20% chance of touching $350, so those levels are not remote.
What would change my mind? On the upside, a close above $326 on rising volume, or a Cloud margin that holds despite third-party capacity costs. On the downside, a close below $273.50 on heavy volume, a 2027 capex figure that keeps free cash flow negative for another year, or another quarter of Search below estimates. I am not calling a bottom, and I would not use the bot’s long signal, or anyone’s, as a reason to override that.
The calendar to watch
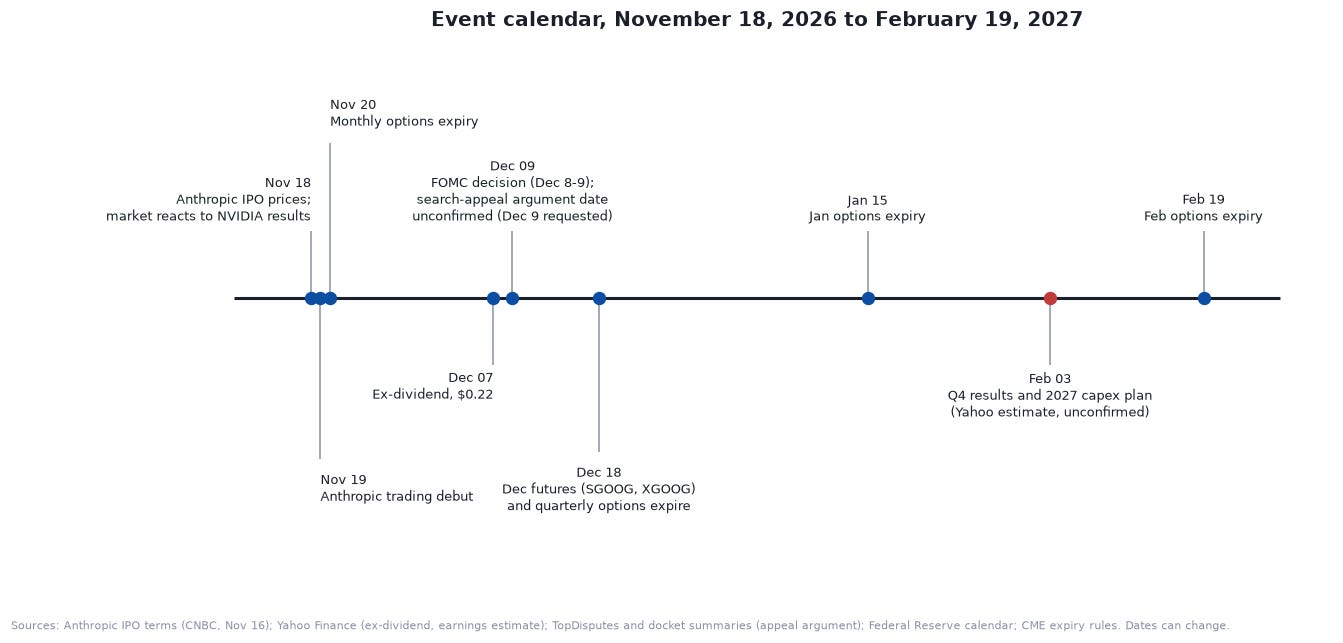
The chart lists the dates. The ones that matter most: Anthropic’s IPO, expected at or above its $70 to $78 range with Nasdaq trading as “ANT” from November 19 (CNBC); NVIDIA’s report, due after the close on November 17 (Investing.com); the ex-dividend date on December 7 ($0.22); the Fed on December 8 and 9; the search-appeal argument, which the parties asked to be held as early as December 9 (unconfirmed); the December futures and quarterly options expiry on December 18; and fourth-quarter results with the 2027 capex plan, expected February 3 (Yahoo’s estimate, not company-confirmed).
Data-quality caveats
Prices and returns come from Yahoo Finance via yfinance through the November 17 close. Class A (GOOGL) is the main series, and Class C (GOOG) is within about 1%.
Option implied volatilities are my recomputation from post-close bid-ask midpoints with the dividend adjusted. Post-close quotes can be stale or wide, and the earnings component for February is my estimate from the difference between two expiries.
Financial statements come from Alphabet’s third-quarter release and call, earlier releases and Yahoo’s statements. Cloud backlog for end-2025 and the first two quarters of 2026 comes from press reports of the calls.
Valuation multiples are Yahoo’s definitions, not company-adjusted, and Alphabet’s trailing P/E is distorted by equity-stake gains. Peer cash flow figures are my own calculations.
The DCF, scenarios and sum-of-the-parts are my assumptions, sensitive to discount rates, the margin target and the multiples. They show what you would have to believe, not what will happen.
News and legal facts come from CNBC, Reuters, the Department of Justice and case trackers. On the search appeal, sources disagree on whether an argument date is set, so I treat it as unconfirmed. Alphabet’s expected Anthropic stake comes from a Motley Fool article citing Anthropic’s filing, which I did not read directly.
The bot analysis covers only what is visible in the script. I have no trade log, backtest or live results, and the bot depends on a framework I cannot see. The stand-in tests use generic scores on daily data and are not a replication.
CME facts come from CME’s public Special Executive Report as reported in search results and a broker contract table. CME’s own pages did not load from my environment, so I could not read the contract specifications directly.
GARCH and Monte Carlo depend on the sample window. A longer window gave near-unit persistence, so I used 2019 to date. The simulation uses a risk-neutral drift and is not a forecast.
Disclaimer
This article is for education and discussion only. It is not financial, investment, tax or legal advice, a recommendation to buy or sell any security or contract, or an offer. I do not know your circumstances. Stocks, options and futures can lose money, and futures and options can lose more than you put in. All figures are as of November 17, 2026, and may change. All scenarios are illustrations from historical statistics and my own assumptions, and none is a forecast. Past performance does not predict future results. The trading bot discussed belongs to a third party, and I make no claim about its past or future performance. Do your own research, and talk to a licensed professional before acting.