


Educational analysis only. This is not financial advice, a recommendation or an offer to trade anything. Every price, probability and payoff below is either sourced to a named outlet or document, computed by me from public Yahoo Finance data, or labelled illustrative. The bot results quoted are simulated and come from the documents, not from live trading. News items are marked as secondary-source reports where I could not verify them at the primary source. Moving averages, RSI readings and volatility figures are my own standard chart calculations, not the bots’ settings. Stocks, futures and options can lose money, and futures and options can lose more than you put in.
Thursday, November 19, 2026: gold breaks, crude fades, Bitcoin sinks, and eight bots are all leaning on a story
At 8:39 a.m. on Thursday an automated pipeline wrote a 103-page strategy report. About forty minutes later it produced six more documents: a backtest term sheet, a trading analysis, a portfolio workbook, a risk-protocol reference, a signals summary and an options-chain summary. Together they describe ten trading bots, each built on one sentence of macro storytelling, and eight of those bots arrived as Python files. This article is a full audit of all of it: what the documents claim, what the code does in concept, what the markets are doing today, and what the numbers say about whether any of it can be trusted.
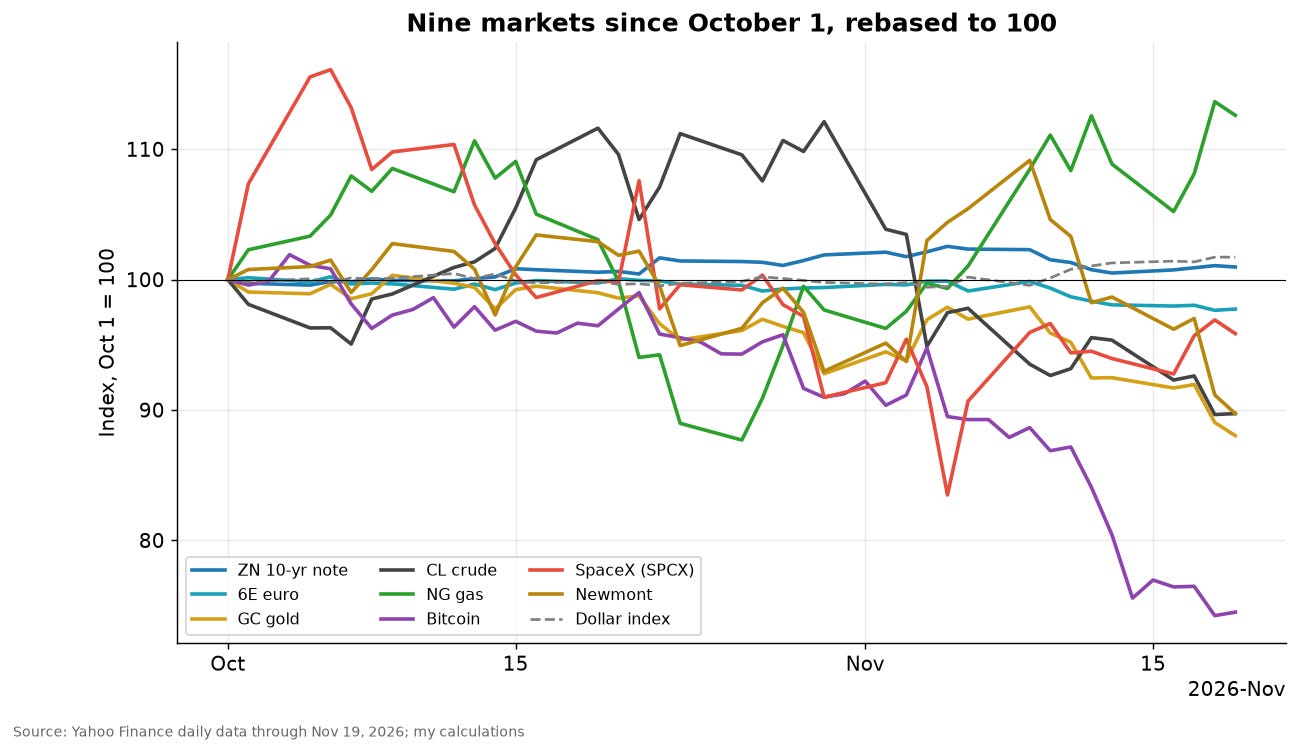
The date matters. This morning the dollar index sat near 104, a 19-month high, after minutes of the Federal Reserve’s October meeting showed “almost all participants” judged more rate hikes appropriate and Governor Christopher Waller was quoted by CNBC saying the Fed may need to “shock people”, ahead of the December 8 to 9 meeting. The 10-year Treasury yield was near 5.09%, the 2-year near 4.83%. Spot gold touched $3,693, its lowest since September 2025, about a third below its January record, according to CNBC and Reuters. Bitcoin dipped to about $62,000 and sat near $63,500. WTI crude held near $83 after touching a three-month low of $81.20. That is one hawkish catalyst feeding a very uneven tape, and the eight bots were written to trade it from eight angles: short Treasuries, short the euro, long gold, short crude, short Bitcoin, long natural gas, long a SpaceX single-stock future and long a Newmont single-stock future.
Here is the short version of what I found, before the detail.
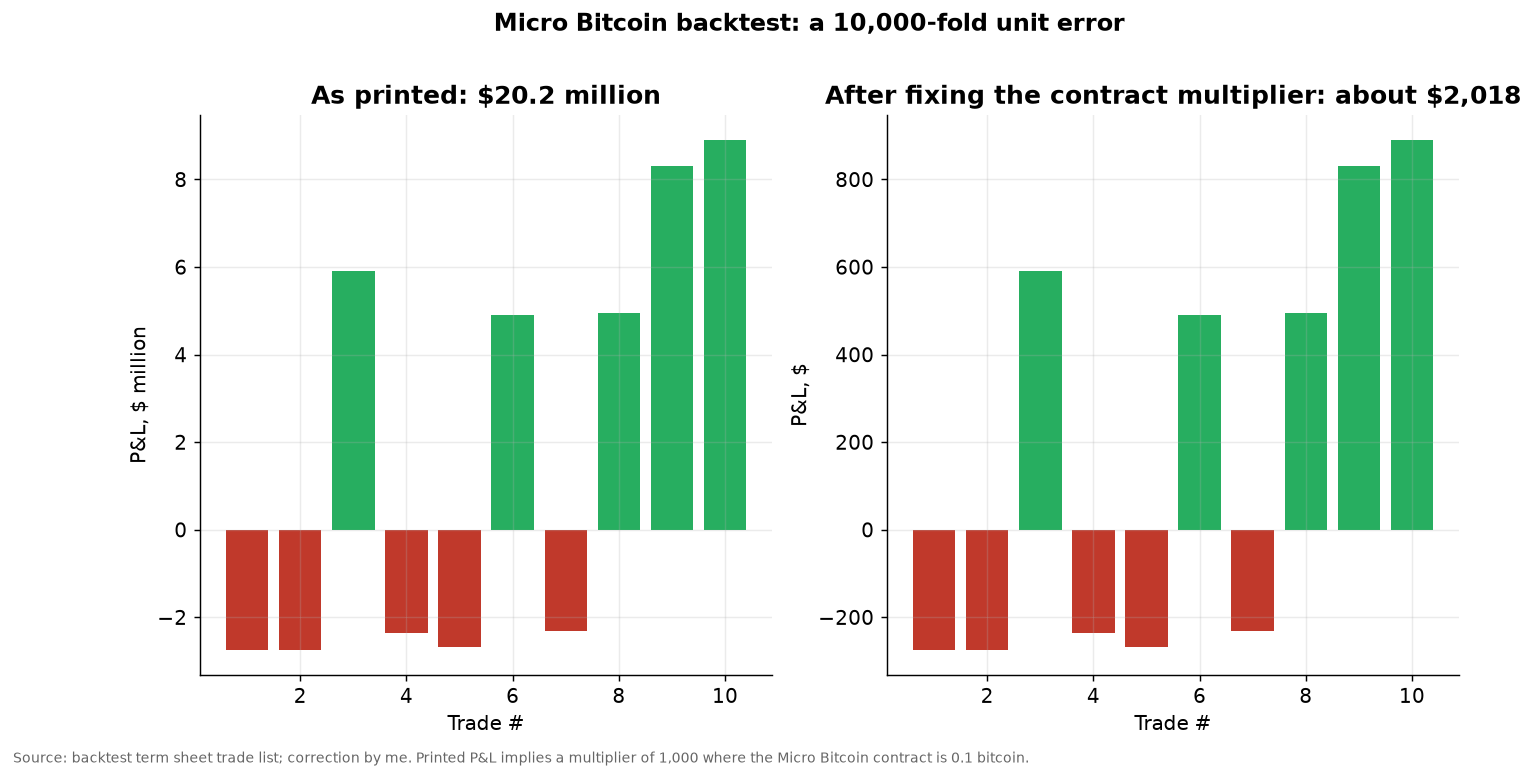
First, the headline number in the term sheet is wrong by a factor of ten thousand. It reports a combined backtest profit of $20.26 million. Of that, $20.18 million comes from one bot, the Bitcoin short, on ten trades. The trade list itself shows the cause: the profit per trade implies a contract multiplier of 1,000 at the contract count the document lists, while a Micro Bitcoin contract is 0.1 bitcoin. Corrected, the Bitcoin backtest earned about $2,000 gross. Everything downstream, including a “portfolio return” of 13,508% in one document, inherits the error.
Second, once that is fixed the evidence is thin. Six bots have any trades. Four of the ten planned bots, two of them among the eight reviewed here, were never tested at all, because the vendor feed had no entitlement or no such symbol. The six tested bots have between 10 and 98 trades, and my resampled 95% intervals for the average trade include zero in every case. The documents’ printed “Sharpe ratio” turns out to be nothing more than the t-statistic of the trade list, and their “probability of profit” figures of 79% to 95% run well above what the same trades support.
Third, the macro thesis in every bot is a label. In concept, each bot is a generic trend-and-momentum machine with a fixed direction. Nothing in the code reads the Fed, inventories, storage, ETF flows, contract rolls, earnings or the news item that inspired it. One bot is called a basis-carry strategy but trades only the short leg, and when its basis data are missing it manufactures them from price momentum.
Fourth, the tape is splitting the theses cleanly. Over the last five sessions the Bitcoin short, the crude short and the euro short are paying. The gold long and the Newmont long are losing badly, down 4.8% and 8.7% respectively for the bots’ direction. The gas long and SpaceX long are flat. And the strategy report itself told its readers not to buy gold outright, a warning that its own bot plan ignored.
Fifth, the book is not diversified the way eight markets suggests. A principal-components view finds about five independent bets in eight, one factor carrying 35% of the variance, and in my illustrative Fed-shock scenario the three shorts that the Fed story favours (Treasuries, the euro and Bitcoin) gain about $7,000 while the longs and the crude short lose about $28,000.
I will take these in order. The first half covers the documents, the macro backdrop, a conceptual view of the code, and the scorecard. The second half is bot by bot, then portfolio risk, then the backtest forensics, then the fix list and a calendar of what can break the book before year-end.
The attachment pile: seven PDFs, eight Python files, ten bots in the plan
The seven PDFs are seven views of one run, folder-stamped 2026-11-19_083951. The big one is the 103-page strategy report. It is not one analysis but six, stacked: five separate passes over the futures-and-options news flow and one pass over single-stock futures, each preceded by the model’s visible “Thinking...” scratchpad. That structure matters later, because the passes disagree with each other, and the bot plan inherited whichever pass its author happened to read.
The backtest term sheet runs 50 pages and is the only document with trades. The 38-page risk-protocol reference is rule text plus a rolled-up portfolio table. The 25-page trading analysis reports ten bots, zero ticks processed and zero trades. The options-chain summary is 13 pages built on an unrelated equity-index chain with a futures mid of zero. The signals summary is seven pages reporting zero signals. The portfolio workbook is nine pages of plan estimates for all ten bots.
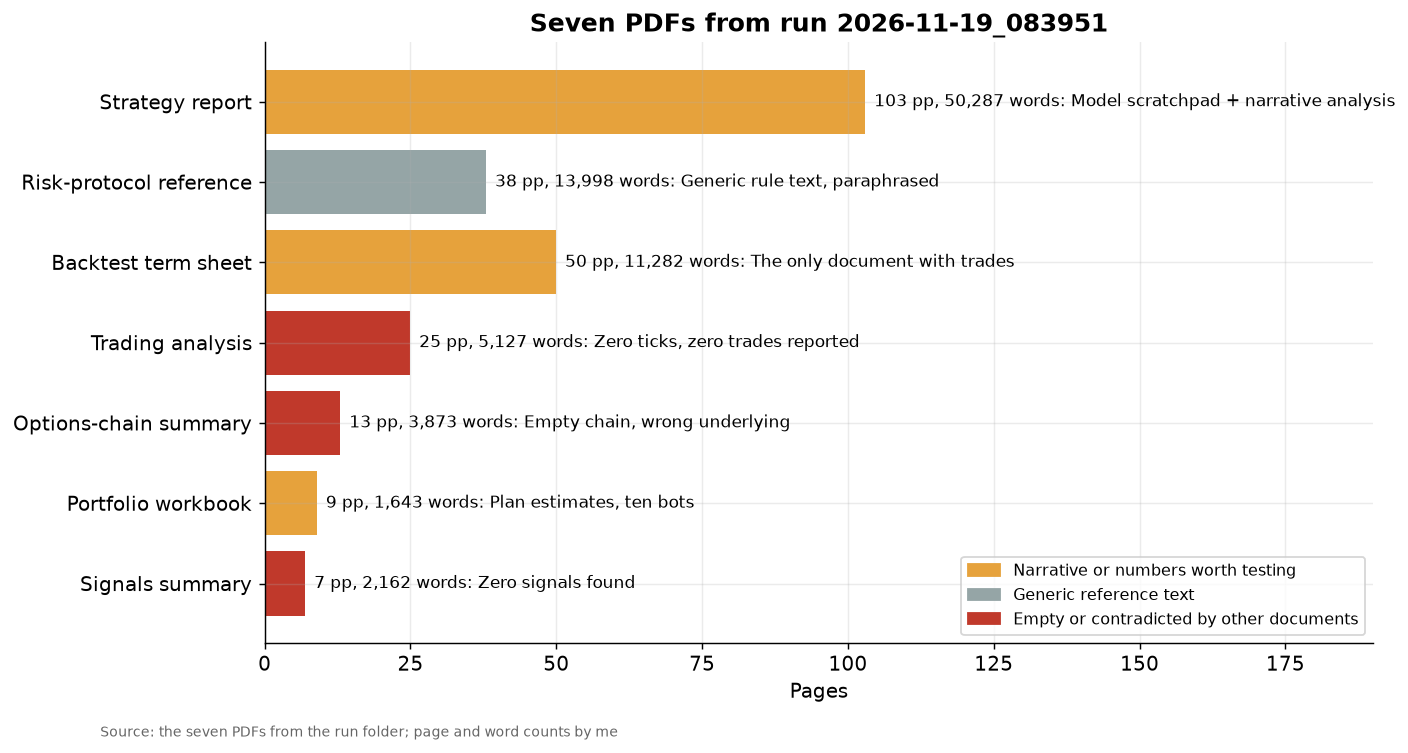
Two of the seven are broken in the plain sense that they cannot be right. The trading analysis contradicts the term sheet on whether any trades exist, and the options summary analyses a contract that no bot trades. The signals document is not broken, it is just empty. None of the seven are duplicates of each other.
The plan describes ten bots. Eight arrived as Python files: the 10-year note short, the euro short, the gold long, the crude short, the Bitcoin short, the natural gas long, a SpaceX single-stock-future long and a Newmont single-stock-future long. Two more, a Nvidia short and an AMD long, are in the plan and the documents but their files were not part of this batch, so they are outside this review. The folder’s own sorting is worth a note. It copies six of the bots, the five futures bots plus natural gas, into a “potential” group, and puts natural gas and the two single-stock-future bots into a “loser” group, so natural gas sits in both. The sorting shows the pipeline already doubted those three.
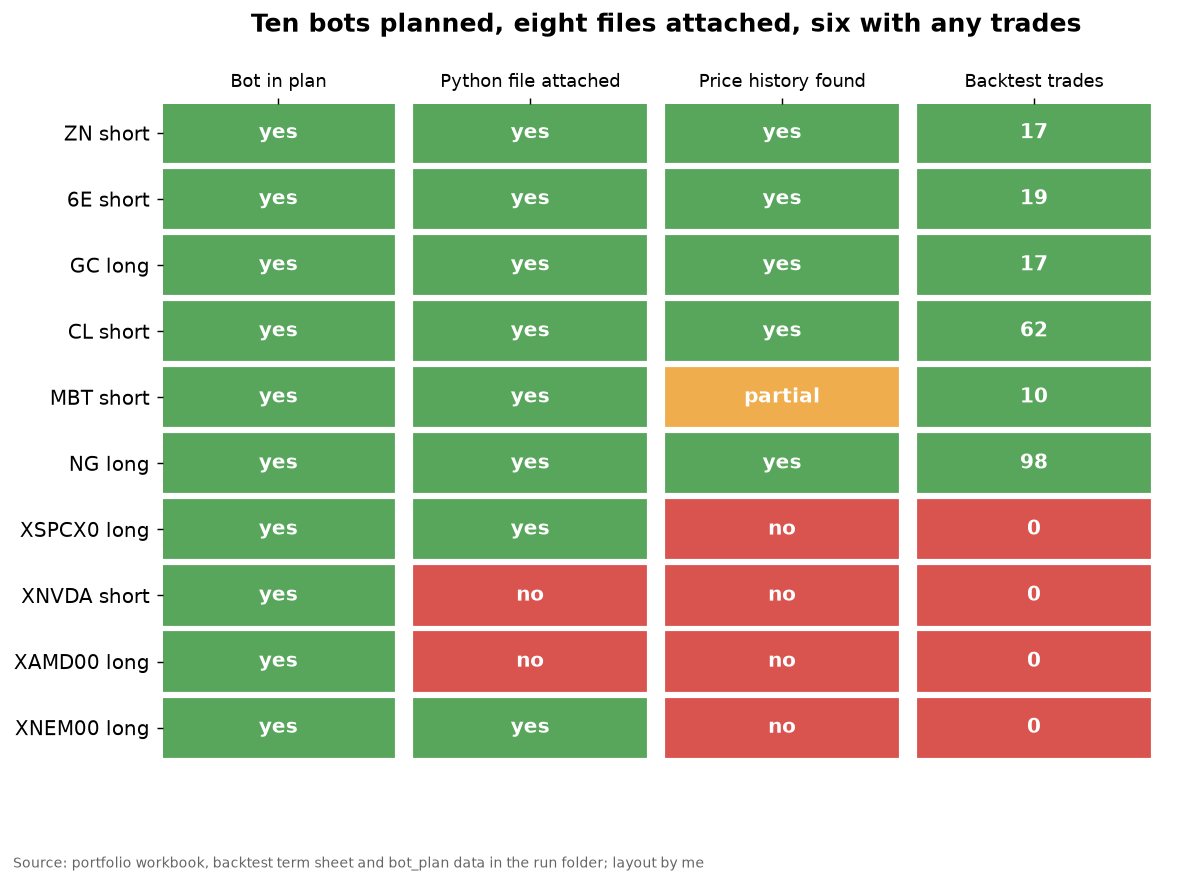
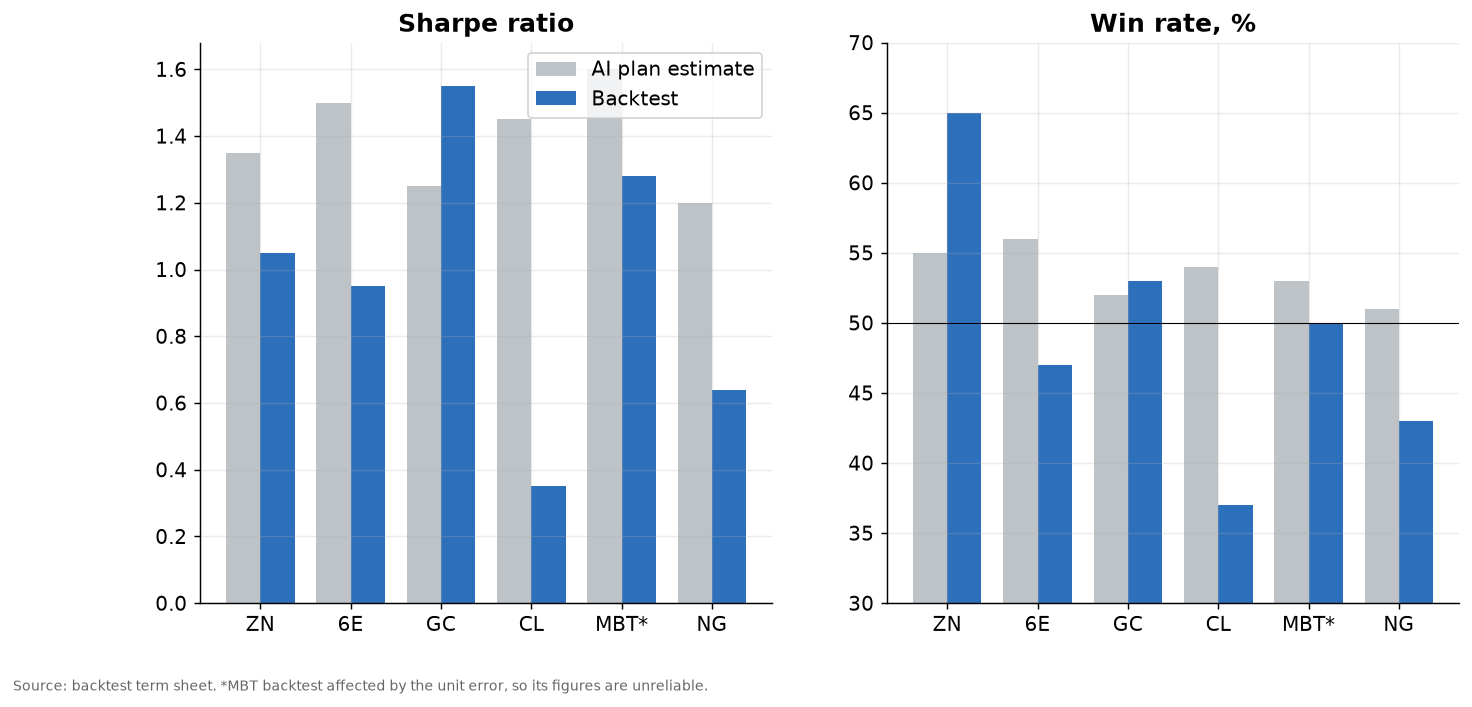
Now the contradictions, because they set the tone for everything that follows. The documents disagree about money three ways: the workbook, the rules reference and the options summary each use a different capital base to compute the same profit, so the same profit becomes three different returns. The workbook’s “average Sharpe 1.47, average win rate 54.5%, average maximum drawdown 14.1%” are plan estimates the pipeline wrote before any test. The backtest’s actual average Sharpe is 0.58, and its worst drawdown prints as 30,405%.
The term sheet’s capital table is also broken for every bot. It prints last-close prices unrelated to any market, about $6,000 for crude and $24 for the euro, and shows a notional leverage of exactly 1,000x for every single bot, which cannot be right for contracts that range from a $6,000 micro to a $370,000 gold contract. The risk-protocol reference labels all six profitable bots “micro futures”, while five of them are full-size contracts. The workbook and the term sheet disagree on Bitcoin margin by a factor of nine. I will return to all of this in the forensics section.
The macro frame: the dollar, the curve, and what the Fed has priced
Start with the thing every bot is secretly about. On Wednesday the minutes of the Fed’s October meeting showed “almost all participants” saw further rate hikes as appropriate, according to the OCBC Daily Treasury Outlook, a secondary source. CME FedWatch had roughly a 90% to 95% chance of a quarter-point hike on December 9 and about 11% for a half-point, via CNBC and Reuters.
The dollar rally began on November 10 when hotter-than-expected inflation data landed, CNBC reported. It ran seven sessions, ending Thursday morning with the index at 103.77 to 103.97. Deutsche Bank’s George Saravelos told CNBC the dollar “seems to be overshooting” the rate-differential move, and the FXStreet weekly chart had the index’s 14-period RSI at 70, overbought.
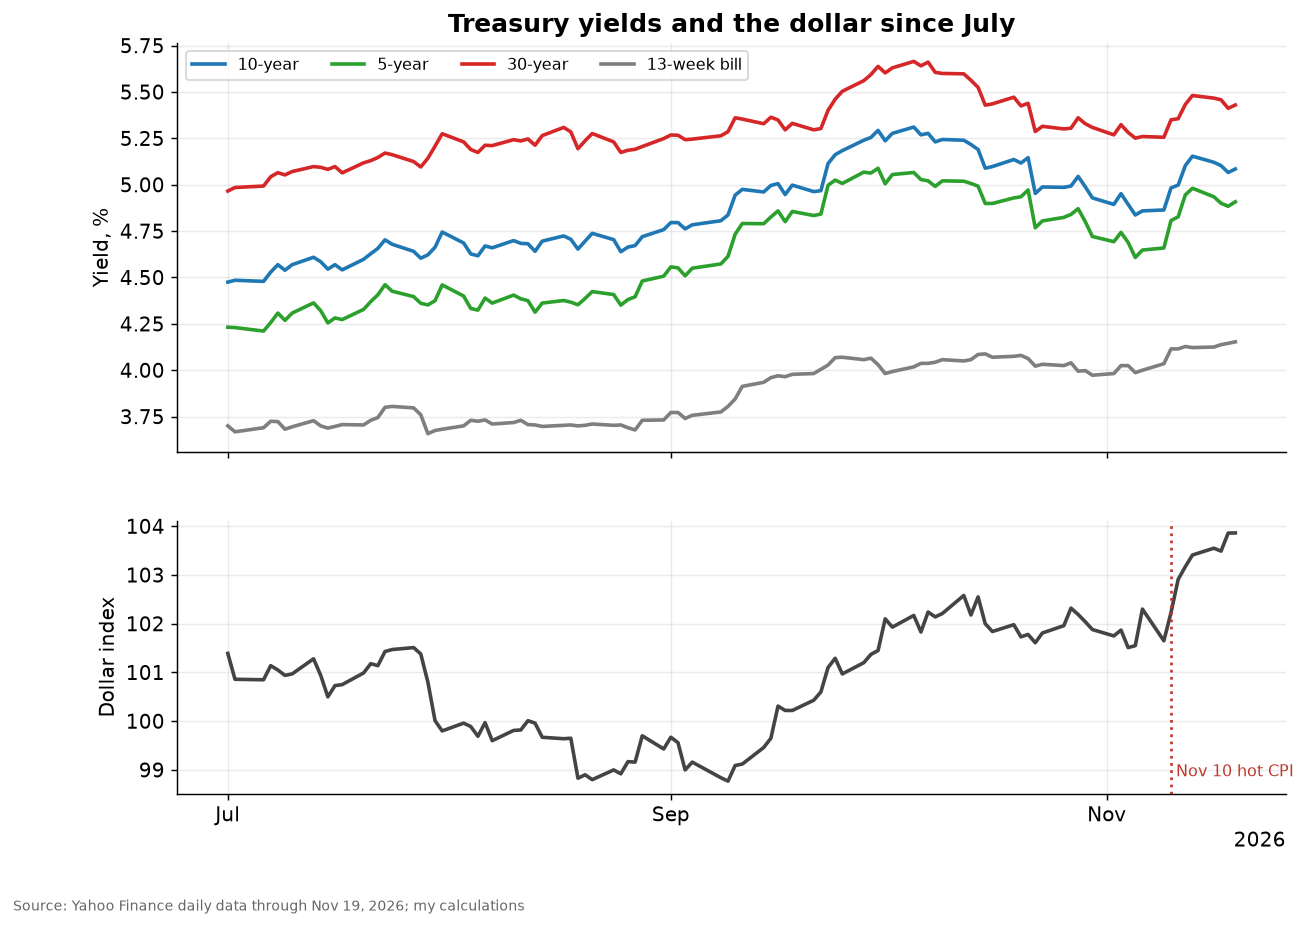
The curve matters for one bot in particular. The 10-year yield is 5.09% and the 2-year 4.83%, a spread of about 26 basis points, so the curve is positive, not inverted. The 30-year is 5.43% (CNBC) and the 13-week bill about 4.15% (Yahoo Finance). Fed funds futures, as OCBC tabulated them, price about 1.09 quarter-point hikes by December, 1.8 by late January, 2.5 by mid-March and 2.8 by late April.
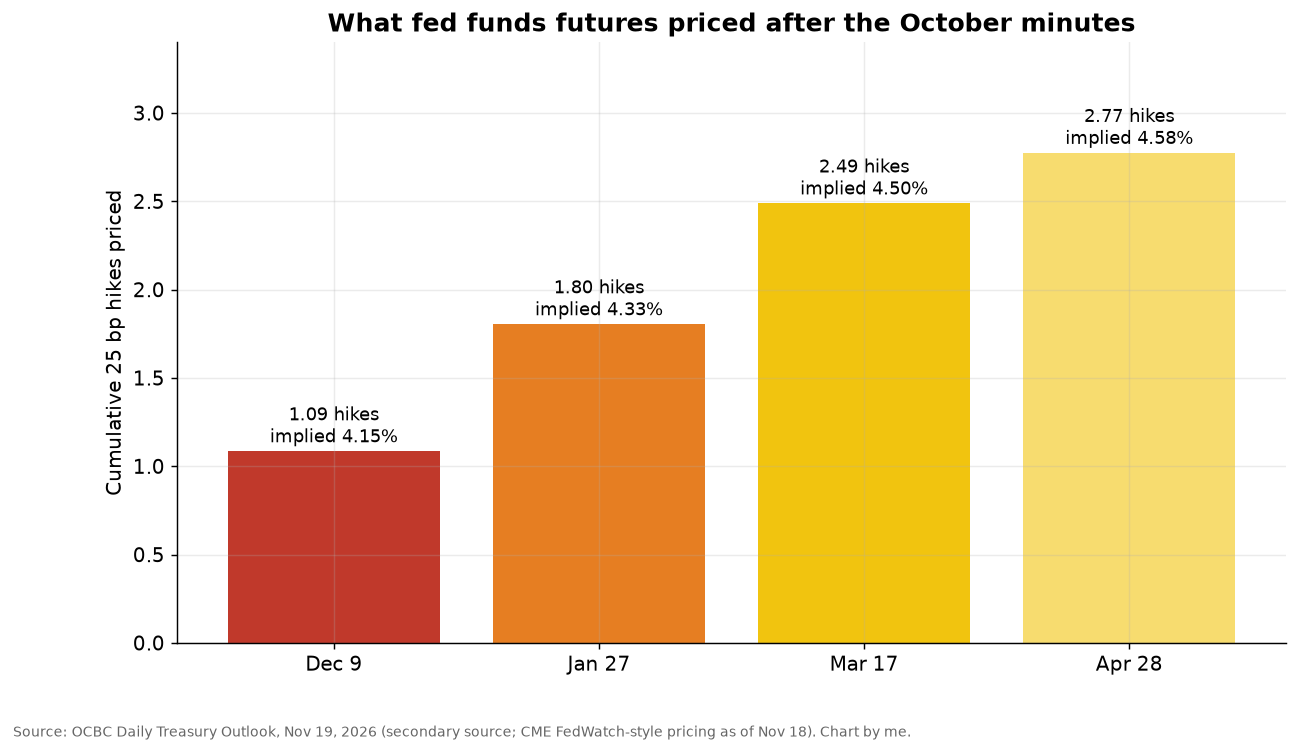
Expressed as a formula, the expected policy rate after k meetings is today’s rate plus a quarter-point for each expected hike:
where n_i is the expected number of quarter-point hikes at meeting i, read from the futures. The figures in the paragraph above are the cumulative sum of n_i.
Around that core sit the other forces. Iran widened its offensive against Kuwait and Bahrain, OCBC wrote. Anthropic priced its IPO at $83 and was indicated to open near $99.60 to $104, according to Newsquawk and the Guardian, so Thursday is a live test of risk appetite. The S&P 500 has fallen five straight sessions. Nvidia reversed from a post-earnings rally to close about 3% lower on Wednesday, and Nvidia’s chief executive resigned on November 12, which is the premise of one bot in the plan. Oil, gold, Bitcoin and the euro are all reacting to the same two variables, the dollar and the real cost of money, and that is the common thread the bots do not model.
I am not going to reproduce the code, its parameters, or its settings. What follows is the shared skeleton in generic terms, which is what every one of the eight files has in common. They are cousins: one template, eight directions.
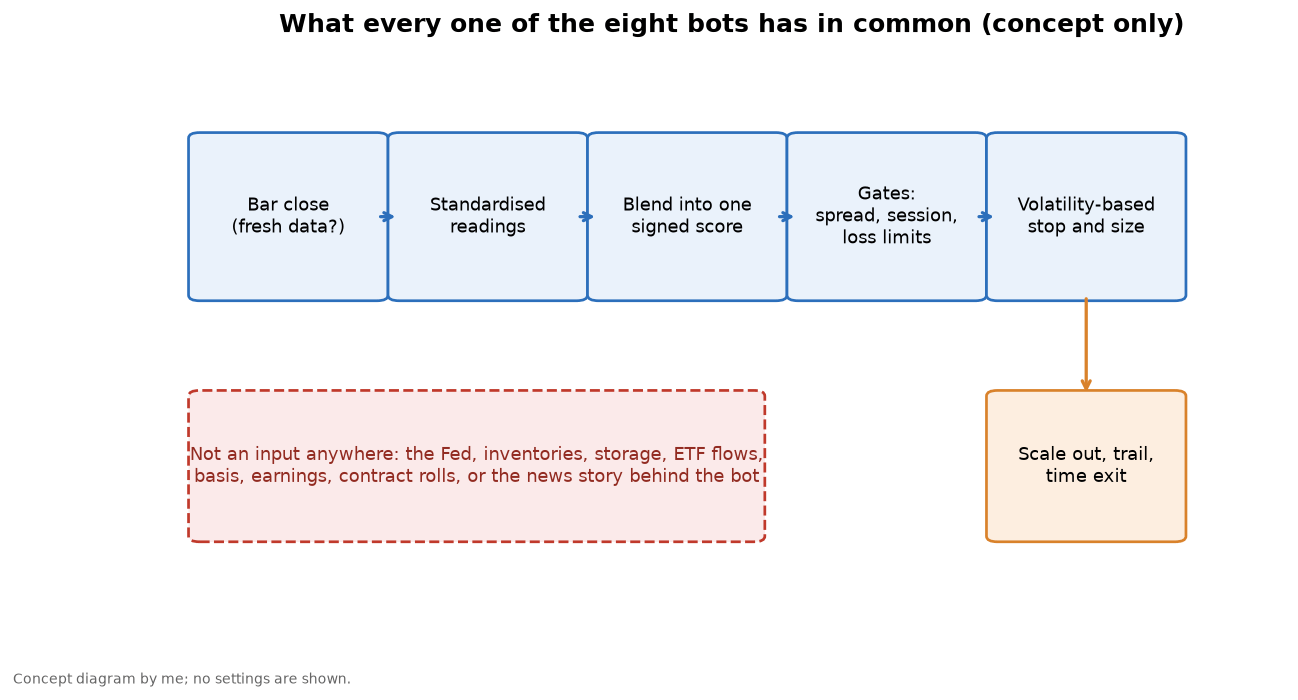
On each completed bar the bot computes a handful of standard technical readings, standardises them and blends them into one score whose sign is aligned with the bot’s fixed direction. Some of the files add a mean-reversion flavour, for example requiring price to have rallied above its own recent average before shorting. If the score clears a moving bar and a set of gates all pass, the bot enters. The gates are ordinary hygiene: market quality, fresh data, the trading session, and loss limits. After entry, a stop sits a volatility-scaled distance away, the position size is set so a stop-out costs a fixed small fraction of capital, and the trade is scaled out in stages with a trailing stop and a time limit.
In generic mathematics, the score is a weighted sum of standardised signals:
A trade is allowed when the signed score clears the bar and the gates pass:
Position size follows from a volatility-scaled stop and a risk budget:
Here ρ is the risk fraction, E the capital, σ̂ a volatility estimate, k a multiple, and M the contract multiplier in dollars per point. Outcomes are best measured in units of initial risk:
What is missing is the point. The bot has a direction field, d, that a human or a language model set from a headline. Nothing in the score is the headline. The ten-year note short does not look at the two-year yield. The natural gas long does not look at storage. The gold long does not look at the dollar. The Newmont long does not look at gold. Each bot’s “volatility regime” is not the VIX. In practice it is a proxy built from the bot’s own bars (one file can accept an outside VIX reading but otherwise falls back to the same proxy), so the rules reference’s talk of VIX regimes is implemented as the instrument’s own realised volatility.
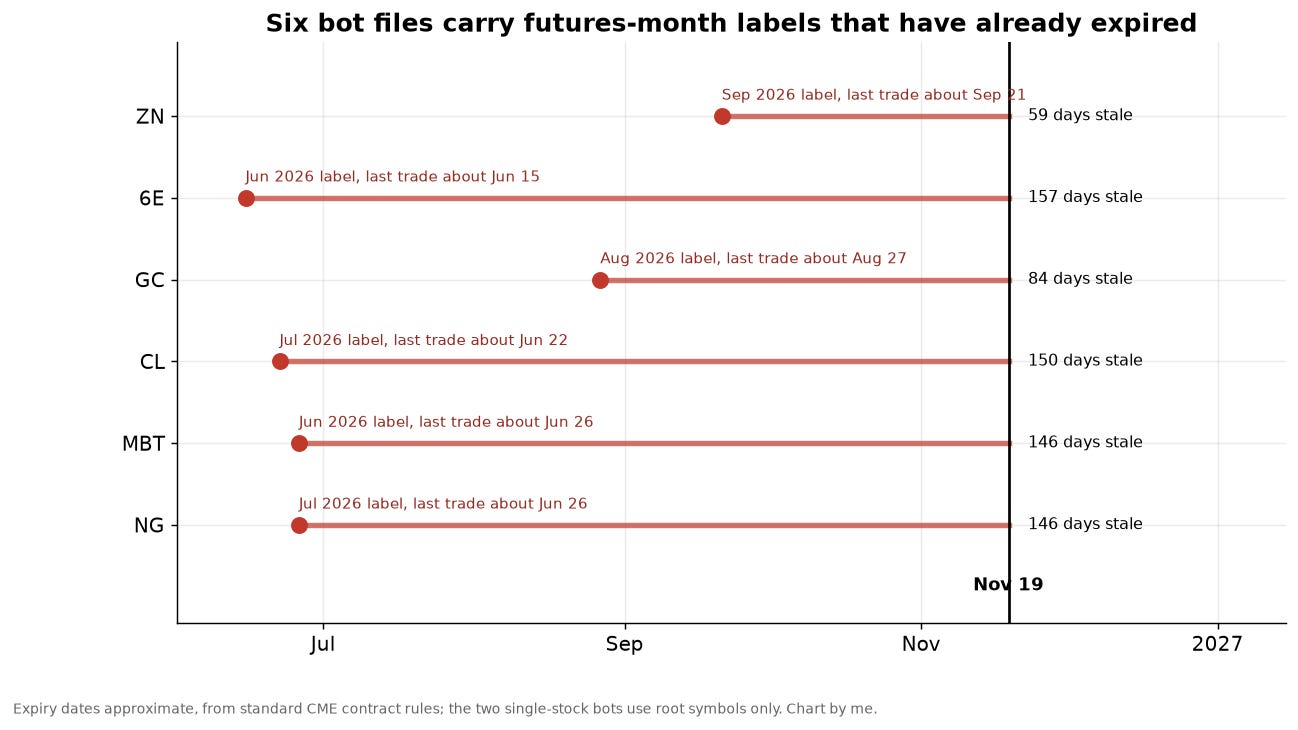
Two structural problems show up in every file. First, the contract-month labels. Six of the eight files carry futures-month labels that expired between June and September, so a bot launched as written would be asking its data vendor for a contract that no longer trades. The other two, the single-stock-future bots, use root symbols, but those roots do not match the symbols named in the plan, and the term sheet reports that the vendor has no such root configured.
Second, the calendar. None of the eight reads an economic calendar, an inventory report, a Fed meeting, an expiry or first-notice date, or an earnings date. The pipeline’s own smoke test, a one-shot dry run of each bot, ended with “no simulated order, a gate blocked entry” for all eight, which is the correct and unsurprising outcome for a bot started cold on a quiet morning. The pipeline’s linter also caught one real defect, an uninitialised loss-limit variable that would have raised an error on the first bar in the ten-year bot; the shipped file does initialise it, so that one was fixed in time.
Thesis versus tape
Here is the first scorecard. For each bot I measure the market’s move in the bot’s favour over three windows, using public Yahoo Finance data through Thursday’s session: the last month, the time since the hot November 10 inflation print, and the last five sessions. Positive means the thesis is being paid. Bitcoin uses a seven-day week, and the continuous futures series can contain roll gaps, so treat the figures as indicative.
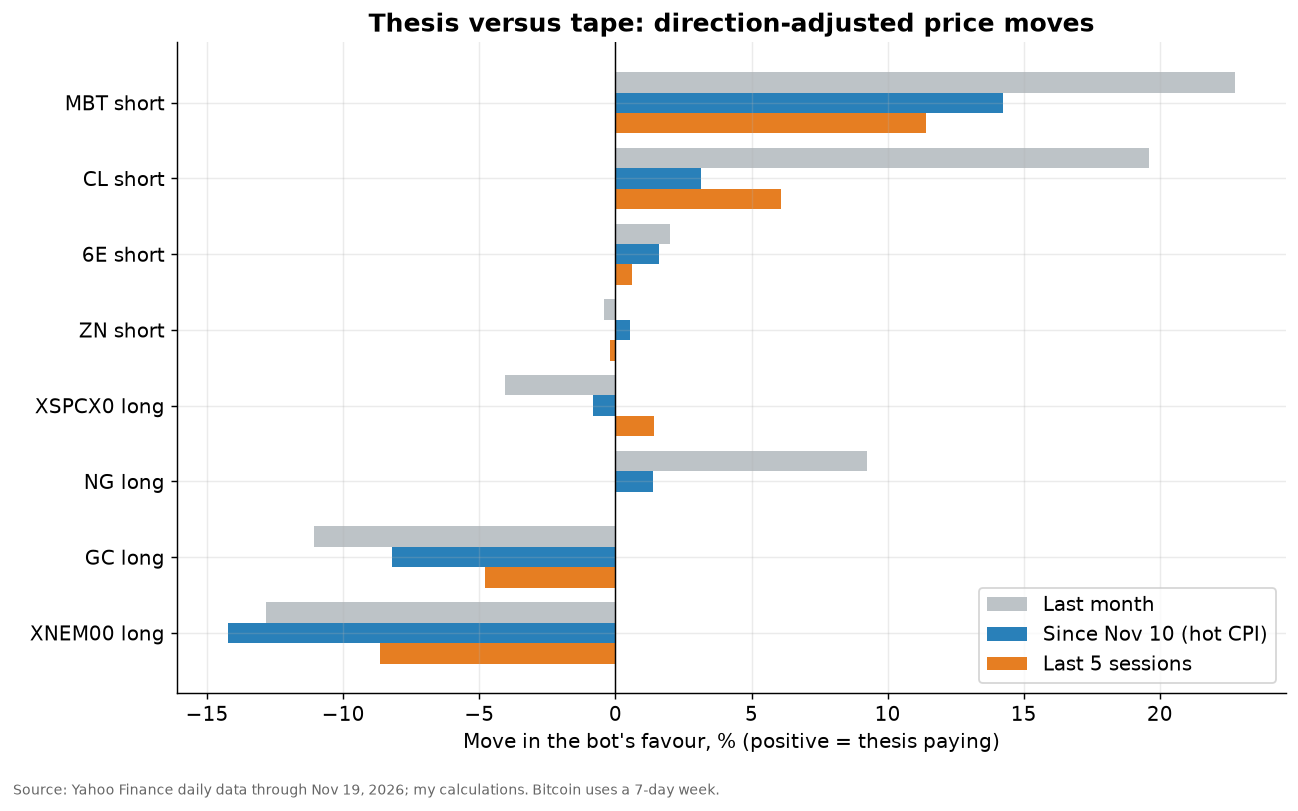
The Bitcoin short is the clear winner: 14% in its favour since November 10, 11% over five sessions and 23% over the month. The crude short has made 6% in the last five sessions and nearly 20% over the month, after a rally that stopped it out repeatedly, which I will show later. The euro short is up 0.6% this week and 1.6% since the CPI print, and sits on its 52-week low. The ten-year note short is basically flat, up 0.5% since the print and slightly negative this week. The SpaceX long is a wash: down 0.8% since the print, up 1.4% this week, down 4% on the month. Natural gas is up 9% over the month for the long, flat this week. The gold long is down 11% over the month and 4.8% this week. The Newmont long is the worst: down 14% since the print and 8.7% this week.
Call it four working, two flat, two failing. The four that are working all trade the same thing, a stronger dollar and higher yields. The two that are failing, gold and gold miners, are the same bet twice. The strategy report saw the conflict. Its closing synthesis reads “No outright long despite uncertainty” for gold, because the dollar-strength rule overrides the uncertainty rule, and recommends put spreads for the downtrend with far-out-of-the-money calls only as a tail hedge. The bot plan nonetheless includes both a gold long and a gold-miner long, both justified by the same uncertainty rule the synthesis said was overridden. The 103-page document argues with itself, and the bots took the losing side.
Bot 1: ZN 10-year Treasury hawkish-flattener short
The claim. The plan says to short 10-year note futures as the Fed’s double-hike repricing lifts yields, to trade the belly leg of a two-year versus ten-year flattener, and to flip to duration longs if the curve inverts. The AI’s plan estimate was a Sharpe of 1.35, a win rate of 55% and a 26.5% annual return.
The tape. Hawkish, but the note has already done much of the work. ZN trades near 105.7 against a 52-week high of 113.9, down 7.2% from the peak and down 6% this year, and it sits right on its own 50-day average, which I compute at 105.6, below a falling 200-day near 109. My daily RSI reads 46, so there is no oversold bounce signal. The short has earned only 0.5% since the November 10 print and given a little back this week, because yields have stalled near 5.1%.
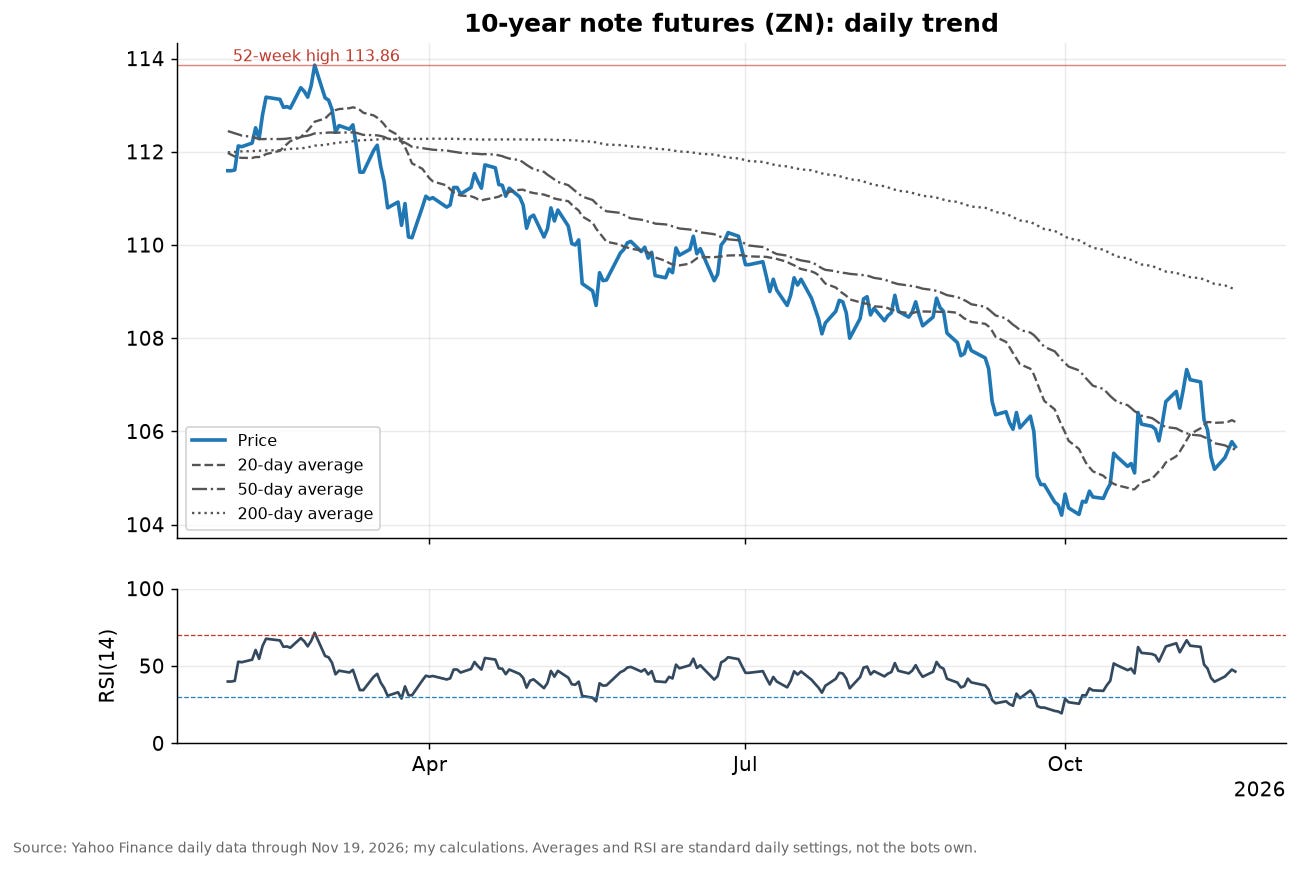
The quant view. A bond future is a yield bet with convexity. To first order the price change is minus modified duration times price times the yield change, plus a convexity term:
On a year of daily data the regression of ZN returns on changes in the 10-year yield has a slope of about −0.063% per basis point and an R² of 0.95, so the yield alone explains 95% of the contract’s variance and the effective duration is about 6.3. That makes the dollar value of one basis point on one contract roughly $67, so a 15-basis-point shock to the 10-year is worth about $1,000 per contract. The bot’s directional bet is therefore a clean, almost one-factor bet on the 10-year yield, which makes it the easiest of the eight to reason about and, tellingly, the one that has not moved with the story.
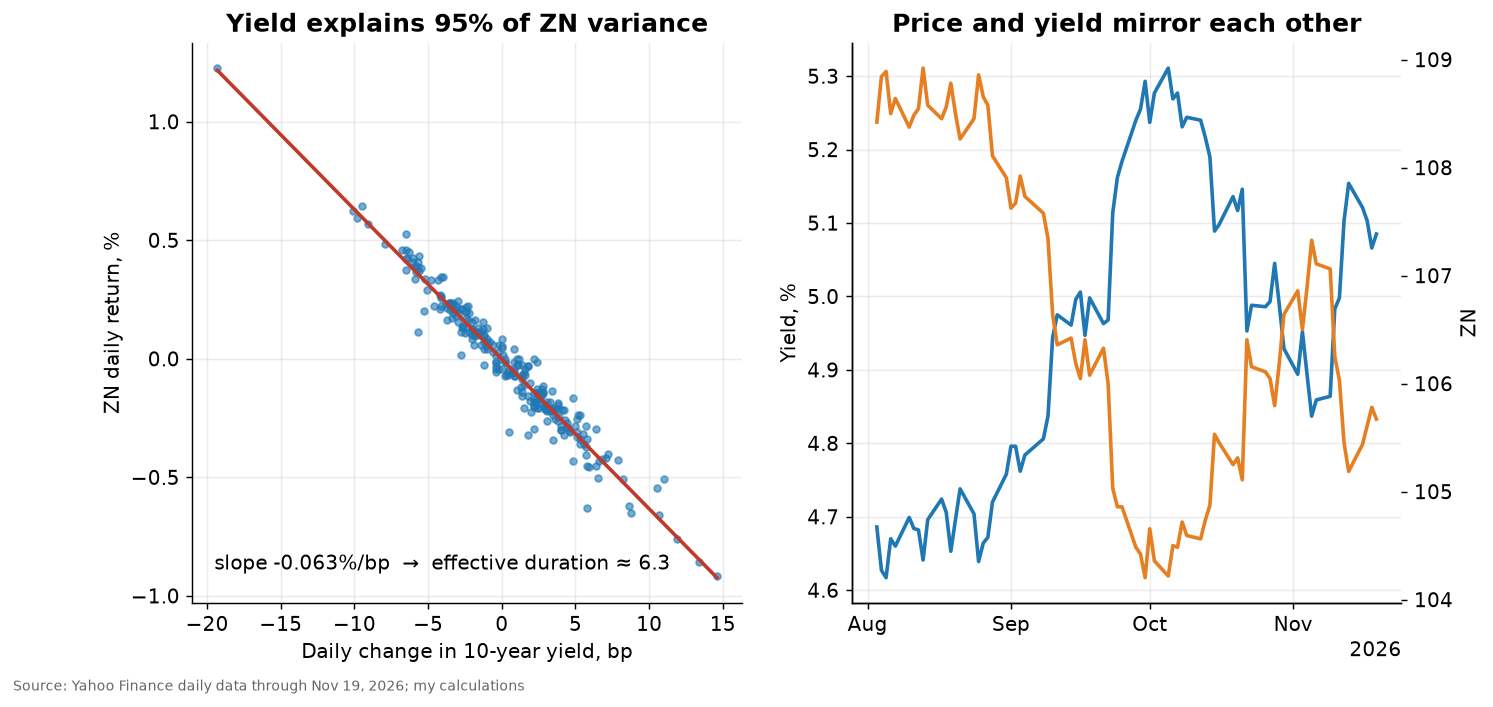
The fundamental view. The thesis is “flattener”, and the data do not support the label. The 10-year minus 2-year spread is about 26 basis points, positive and not near inversion. The bot trades the outright belly, not a curve spread: it has no two-year leg and no data on the front end. Its “inversion” exit is a proxy built from the note’s own fast-versus-slow trend, which fires when the note itself starts to rally, not when the curve inverts. The report’s closing synthesis for rates was to short the front end and the belly, with ZN put spreads as the defined-risk version, and to run curve relative-value trades alongside. The bot is the naked outright version of that, without the hedge and without the curve leg.
The next catalyst is December 9. The market has fully priced 25 basis points; about 11% is priced for 50. If the Fed delivers 25, the move is priced. If it delivers 50, the 10-year can lift quickly. The risk is the other side: a dovish tilt, or an equity sell-off driving a bid into duration. A belly short and a curve flattener are different trades, and only one of them is in the code.
Volatility. A GARCH(1,1) fit gives the following variance recursion for the log return ε:
Forecasts of that variance revert to a long-run level at rate α+β, and the horizon move adds up the daily variances:
For ZN the persistence α+β is about 0.99, annualised volatility is about 5.3% and the 20-day one-sigma move is about ±1.5%, or about ±1.5 points. In dollars that is about $1,500 per contract. The cone below places current 20-day volatility against its own history and shows the forward fan.
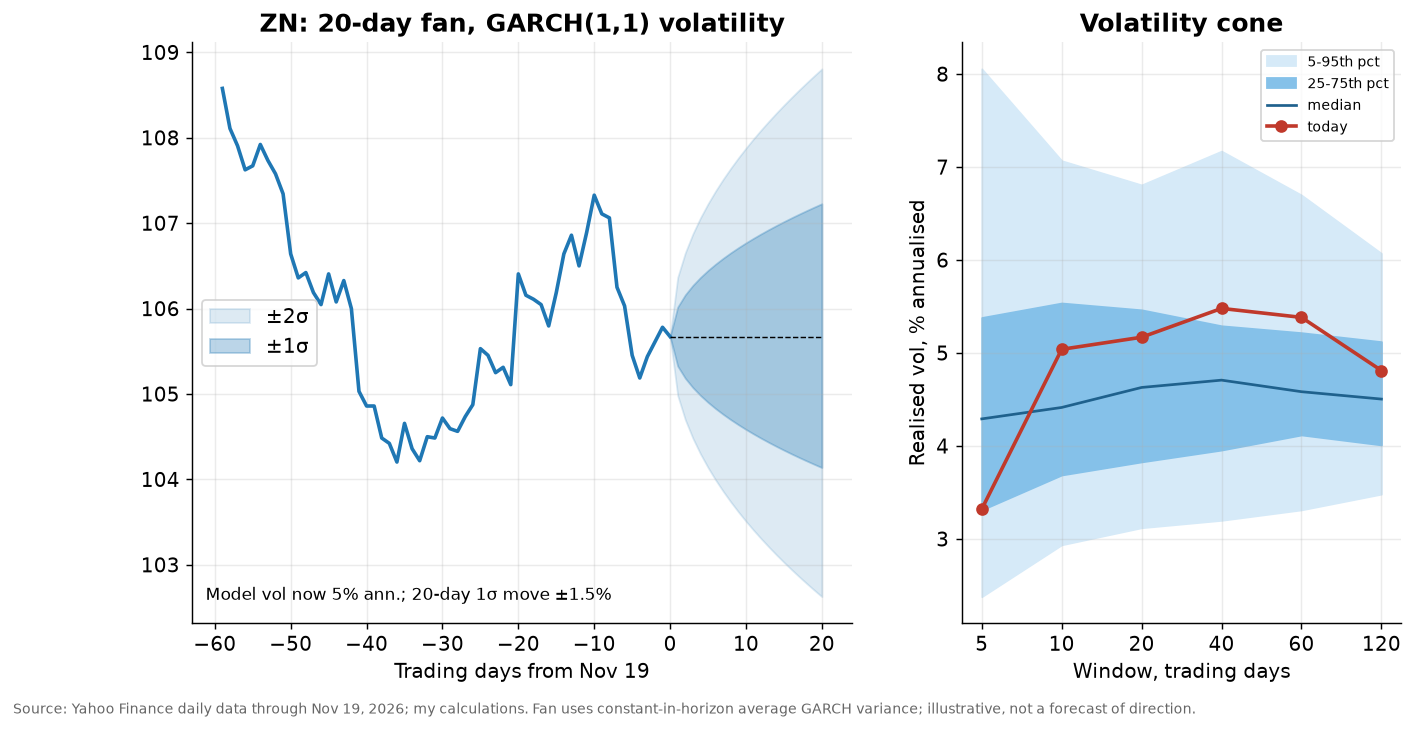
What the bot would do, and its record. A fresh short needs the instrument to be below its own recent trend, with weak momentum, and a gate stack that is satisfied. The term sheet shows 17 simulated trades, 11 winners (65%), and about $4,900 of profit. But the average winner is smaller than the average loser, with a ratio of about 0.93, so by the break-even formula the bot needs a win rate of about 52% to be worth running, and the headline 65% clears it on only 17 observations. Applying the textbook Kelly formula to those 17 trades would suggest staking about a quarter of capital per trade, which is exactly why a sample that small cannot be used for sizing. The printed Sharpe of 1.05 is a t-statistic with a one-sided p-value of about 0.15.
What the bot would not do is know that the Fed meets in twenty days, that the next contract’s first notice date falls at the end of this month, or that the contract month in its own file expired two months ago. One more oddity: the backtest resolved the instrument to a different bond contract, a 30-year bond contract with a price near 106, while the vendor price file I compared matches the 10-year. I could not resolve which was tested, so treat the ZN backtest as unverified. Verdict: right direction, plausible instrument, wrong label, and not yet paid this week.
The remaining sections are for paid subscribers: the euro, gold, crude, Bitcoin, natural gas, SpaceX and Newmont bots, then portfolio risk, backtest forensics, the fix list, the calendar and the verdict.
Bot 2: 6E euro short
The claim. Short euro futures on the rule that higher US rates mean a stronger dollar, as the double-hike expectations that have driven the Australian dollar and sterling lower extend to the euro. Plan estimate: Sharpe 1.50, win rate 56%, 32% annual return.
The tape. This is the cleanest tape of the eight, and the one most at risk of being late. The euro is at about 1.099, the lowest since April 2025 according to Reuters via CNBC, and exactly at its 52-week low of 1.0977. It trades below a falling 20-, 50- and 200-day average, and my daily RSI reads 30.7, oversold. Since the CPI print the short has made 1.6%, and over the last month 2%. The dollar index at a 19-month high is the other side of the same trade. A momentum short that enters on new lows is paid by the persistence of the trend and punished by sharp counter-rallies, which is exactly what the printed trade list shows.
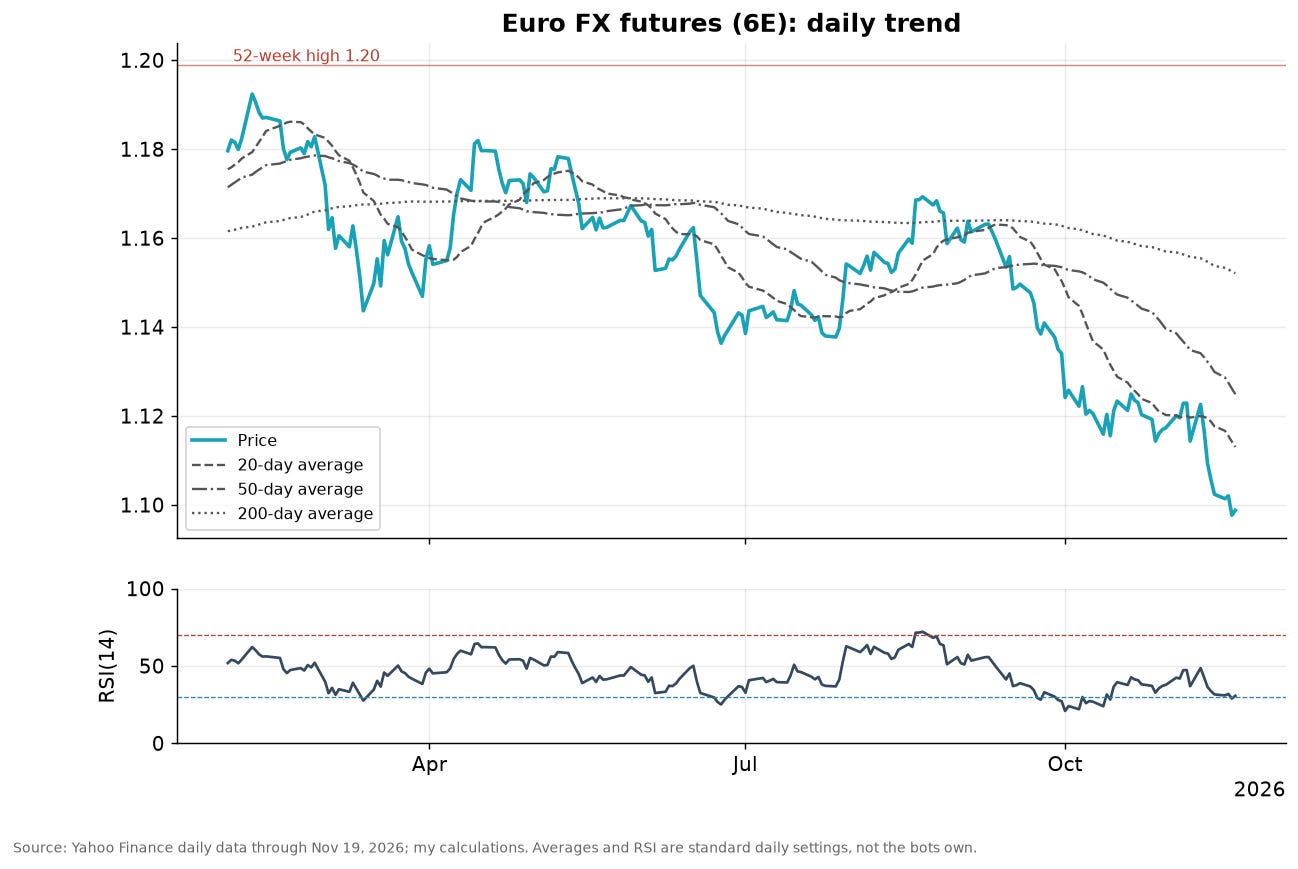
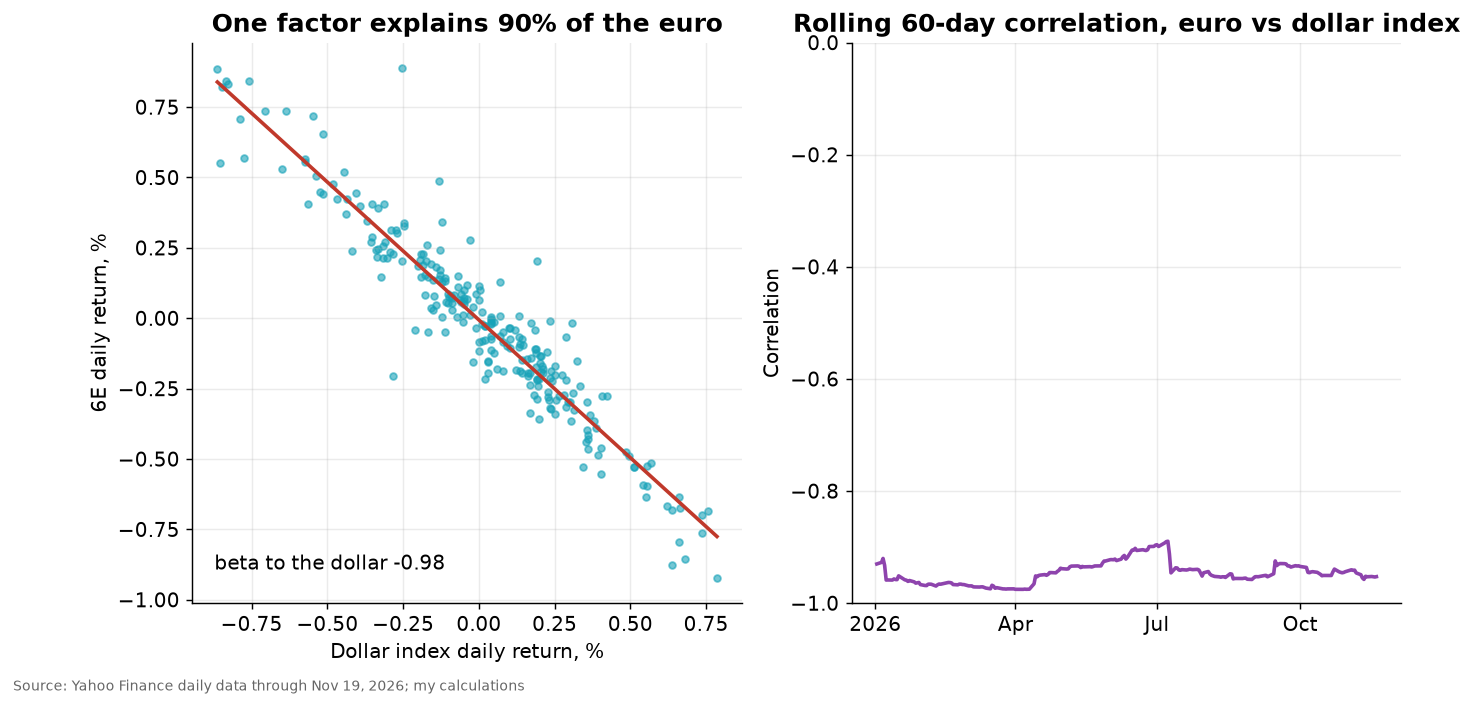
The quant view. One factor explains almost everything. Regressing daily euro returns on dollar-index returns over a year gives a beta of about −0.98 and an R² of 0.90, so the euro bot and the dollar index are one and the same trade for 90% of its variance:
That has two consequences. First, a euro short is not a separate view from a dollar-strength thesis, and any other bot that profits from a strong dollar adds to the same bet. Second, the thesis is really about rate differentials, which the cost-of-carry relation makes explicit:
The bot reads neither interest rate. If the European Central Bank turned hawkish, or the Fed softened, the differential would tighten with no signal reaching the code.
The fundamental view. The report called for euro put spreads and collars, an option structure that pays for protection and caps the cost of being wrong. The bot is a naked futures short. The macro setup is real: the Fed minutes pushed the rate differential wider and the euro has fallen with it. But with RSI oversold and Deutsche Bank describing the dollar as overshooting, a short entered now has less cushion than a short entered three weeks ago. The euro has lost about 2% in a month, not a collapse.
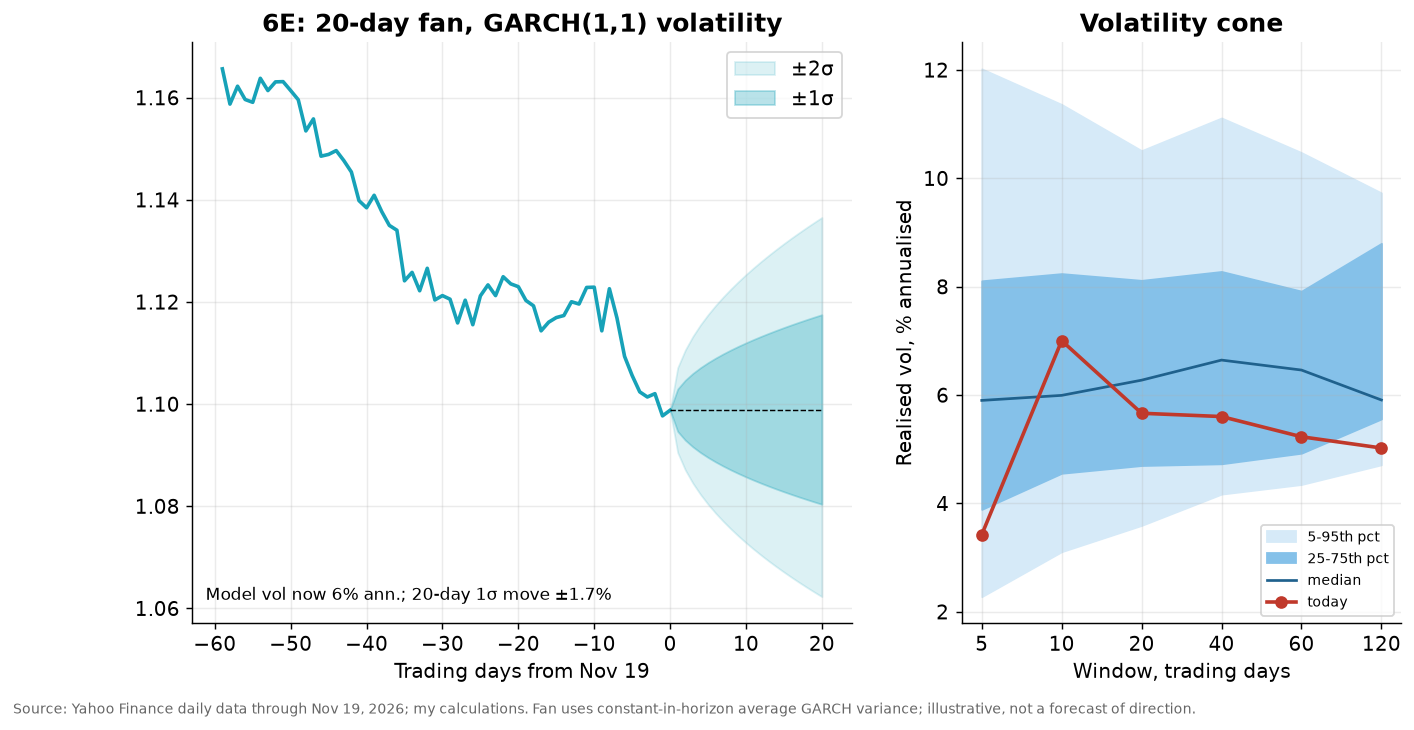
Volatility. Euro volatility is low, near 6% annualised by the GARCH fit with persistence about 0.99, so the 20-day one-sigma move is about ±1.7%. One contract has a notional of roughly $137,000, so one standard deviation over twenty trading days is about $2,300. That is a small number against gold and crude. It is also the reason this bot has the lowest tail risk in the book. A parametric value at risk and expected shortfall under normality, for a position of notional N, are:
and the stand-alone one-day 95% historical loss in the bot’s direction is about 0.8% of notional.
What the bot would do. Enter on momentum below trend, stop out on a counter-rally, scale out into continued weakness. The term sheet shows it did that 19 times with nine winners and ten losers, a win rate of 47% against the plan’s 56%, and a total of about $4,300 on a simulated account. Its own average winner is about 1.8 times its average loser, which is a good ratio, and the break-even win rate that follows from it is about 36%, so a 47% hit rate clears the bar with room. The sample is too small to bank on, but this is the bot whose mechanics fit its market best. Verdict: working, one-factor, late. The risk is a squeeze if the Anthropic debut sparks a risk-on bounce and the dollar finally mean-reverts.
Bot 3: GC gold uncertainty-bid long
The claim. Buy gold on the rule that uncertainty lifts gold, citing a Hong Kong regulator’s flag on a crypto platform, sovereign bitcoin supply risk and Iran headlines, “despite the real-yield headwind from double-hike pricing”. Plan: Sharpe 1.25, win rate 52%, annual return 24%.
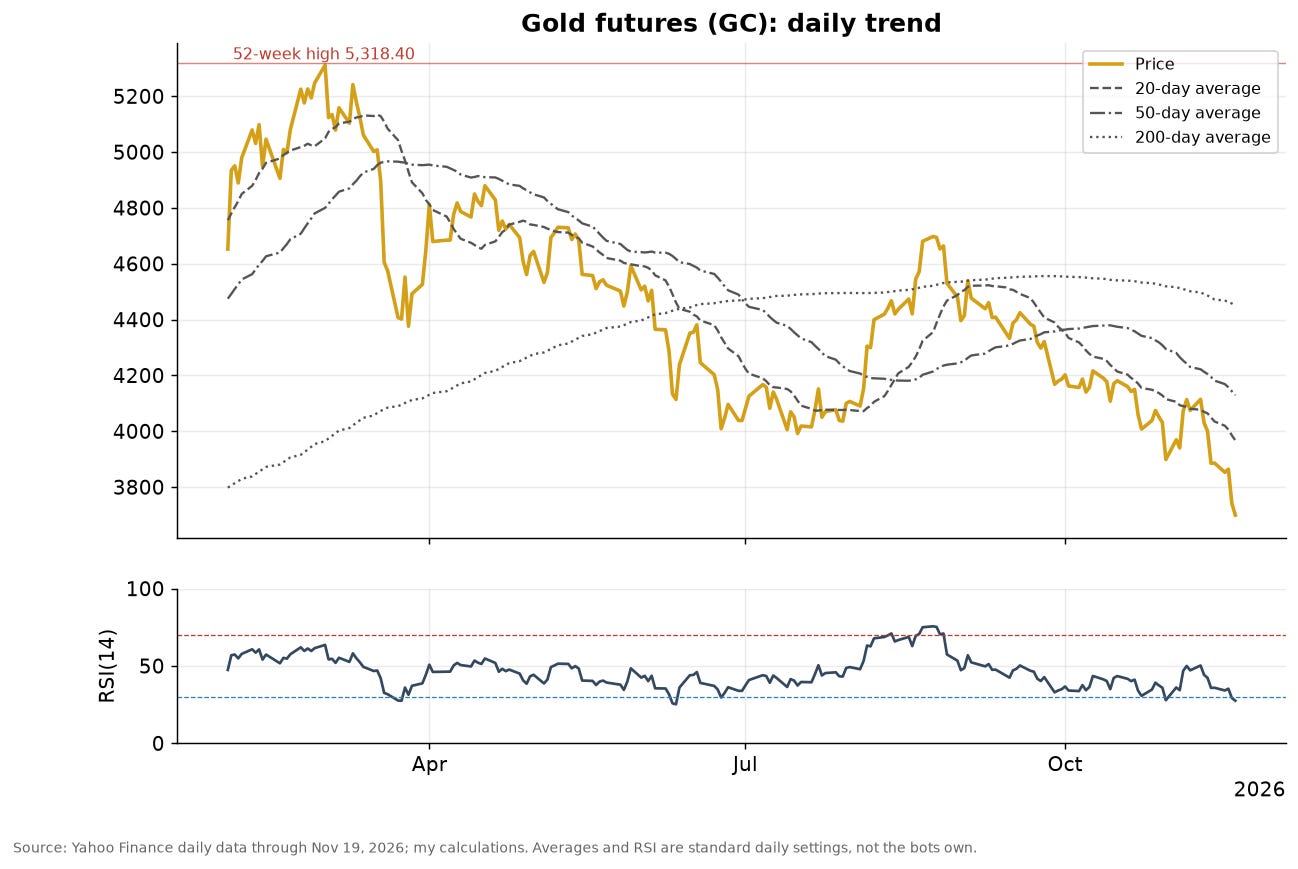
The tape. This thesis is losing. Gold has fallen from a record of $5,589 on January 28 to about $3,700 today, a 14-month low, with futures down 8.2% since the CPI print, 11% over the month and 4.8% this week, and roughly 30% below the 52-week high in the Yahoo series. My daily RSI reads 27.6, deeply oversold. It trades beneath its 20-day, 50-day and 200-day averages, which I compute near $3,967, $4,129 and $4,452.
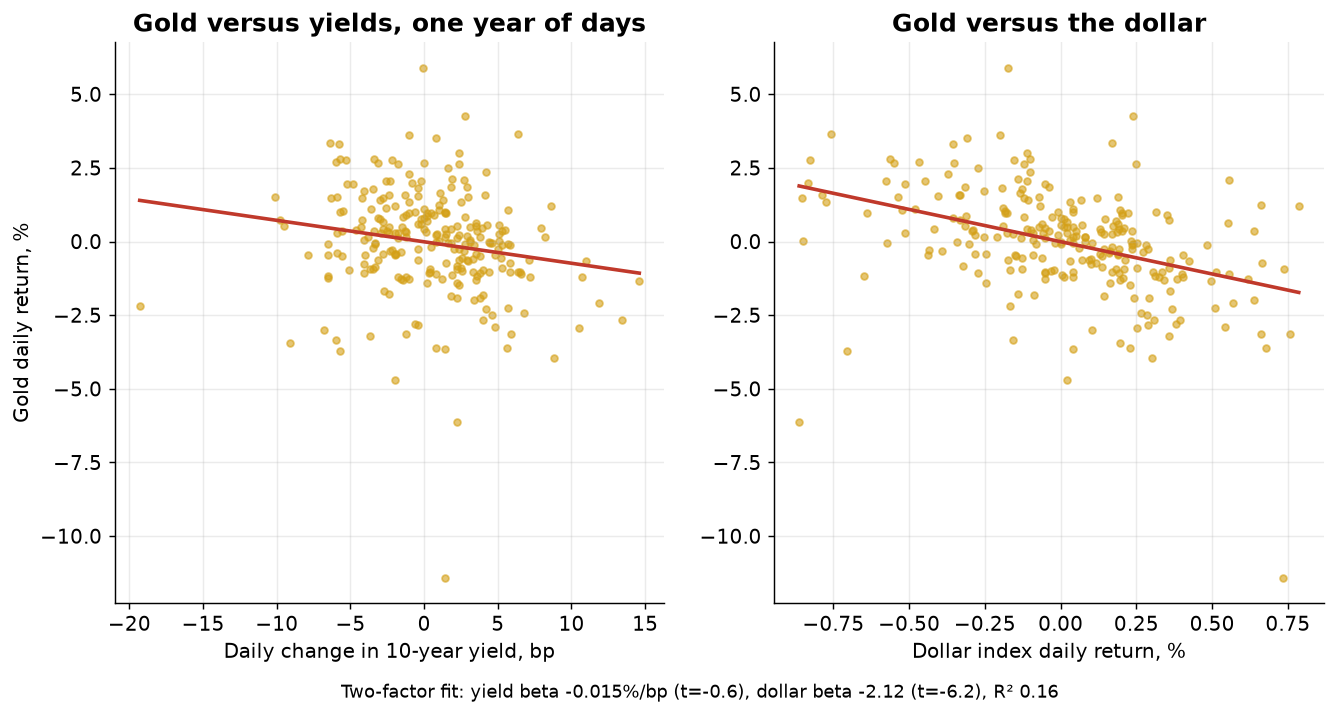
The quant view. A simple two-factor regression of daily gold returns on changes in the 10-year yield and on dollar-index returns, one year of data, finds the dollar matters and the nominal yield barely does:
The dollar beta is about −2.1 with a t-statistic near −6, the nominal yield beta is about zero with a t-statistic of −0.6, and the R² is only 0.16, so most of gold’s daily variation is not explained by either. That is why gold hurts long holders in two ways. Gold prices the real yield, which this regression cannot see, and the Fed’s hawkish repricing raises real yields. In plain terms the “uncertainty bid” is a second-order effect that disappears whenever the dollar and real rates move against it, and the dollar has risen for seven sessions.
The fundamental view. The strategy report’s own closing guidance was “no outright long despite uncertainty”, because the rule that a strong dollar dominates overrides the uncertainty rule, and “put spreads for the downtrend, far out-of-the-money calls only as a tail hedge”. That makes the gold long the clearest case in the pile of a bot built against its source document. The report’s first pass had proposed a gold straddle instead, because the uncertainty rule “fights” real yields; the later synthesis dropped the long entirely.
Volatility. Gold is the most expensive instrument to be wrong in. Annualised volatility is about 28%, the 20-day one-sigma move is about ±7.8%, and one contract carries a notional of about $370,000, with a one-sigma day worth about $5,100. A typical day’s true range is about 2.6% of price, which is about $96 per ounce or $9,600 per contract. A fixed-fraction risk rule of the textbook kind, risking a small percent of capital per trade, cannot be honoured by a small account holding a full gold contract, because the stop would have to sit inside ordinary daily noise. The backtest’s reported drawdown of 75.9% of starting capital shows what happens when the unit is too big for the account.
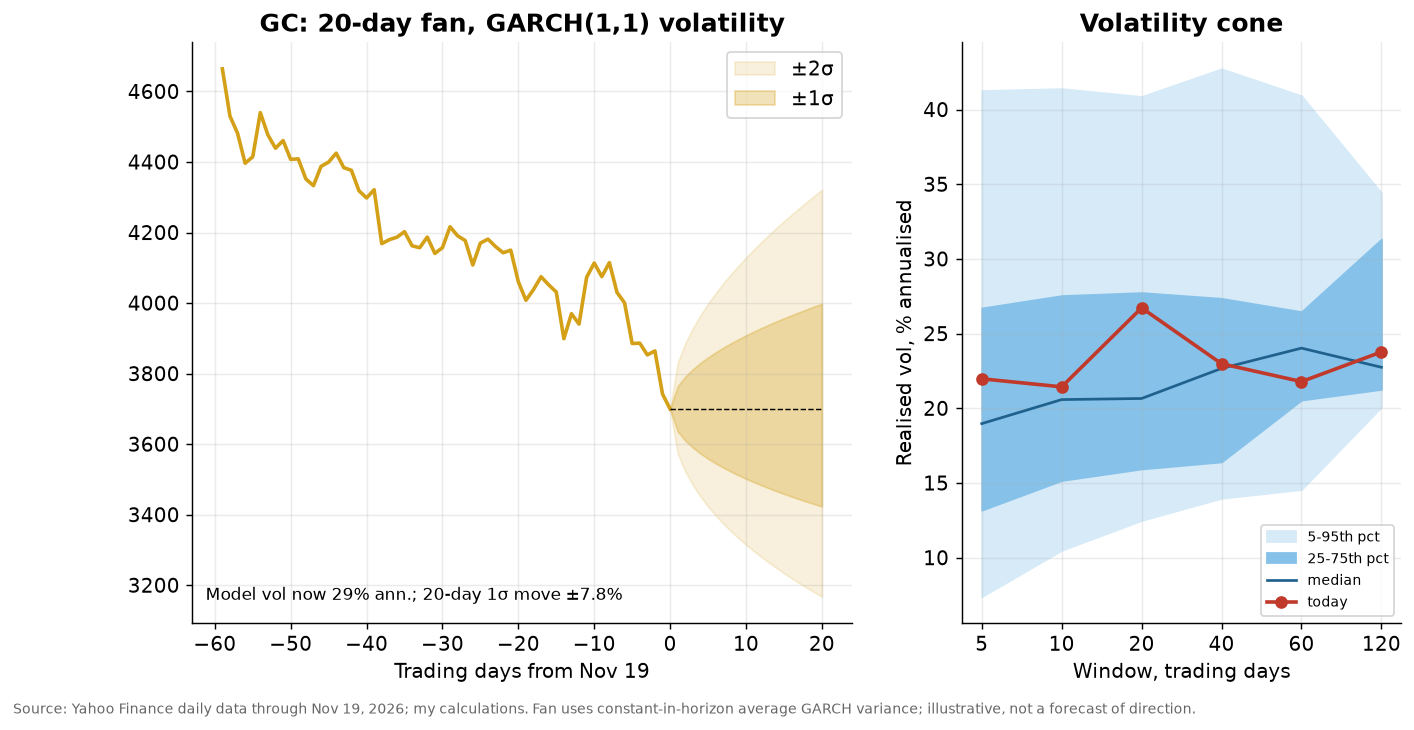
What the bot’s record shows. Seventeen trades, nine winners, a headline Sharpe of 1.55 and a $55,600 profit. Look at the dates. The profits were earned in the November 2025 to January 2026 climb toward the record and in three August trades. Since August 21 the bot has taken four consecutive stop-outs as the entry price slid from about $4,640 to $4,115. There is a gap in the printed list from February to August, with no trades at all, while gold fell from about $5,260 to the low $4,200s, which looks like a data stitching problem or a bot that stood aside for six months. Either way, a long-only trend bot in a falling market is a bot with nothing to do. Verdict: failing, and warned against by its own report.
Bot 4: CL WTI supply-boost mean-reversion short
The claim. Short crude because “the Trump-Xi-Putin trilateral agreement to boost global fuel supply” caps prices and reverses the Strait of Hormuz spike, with the bot entering as mean-reversion shorts into rallies rather than chasing the move, and with higher real rates cutting demand as a second leg. Plan estimate: Sharpe 1.45, win rate 54%, annual return 30%.
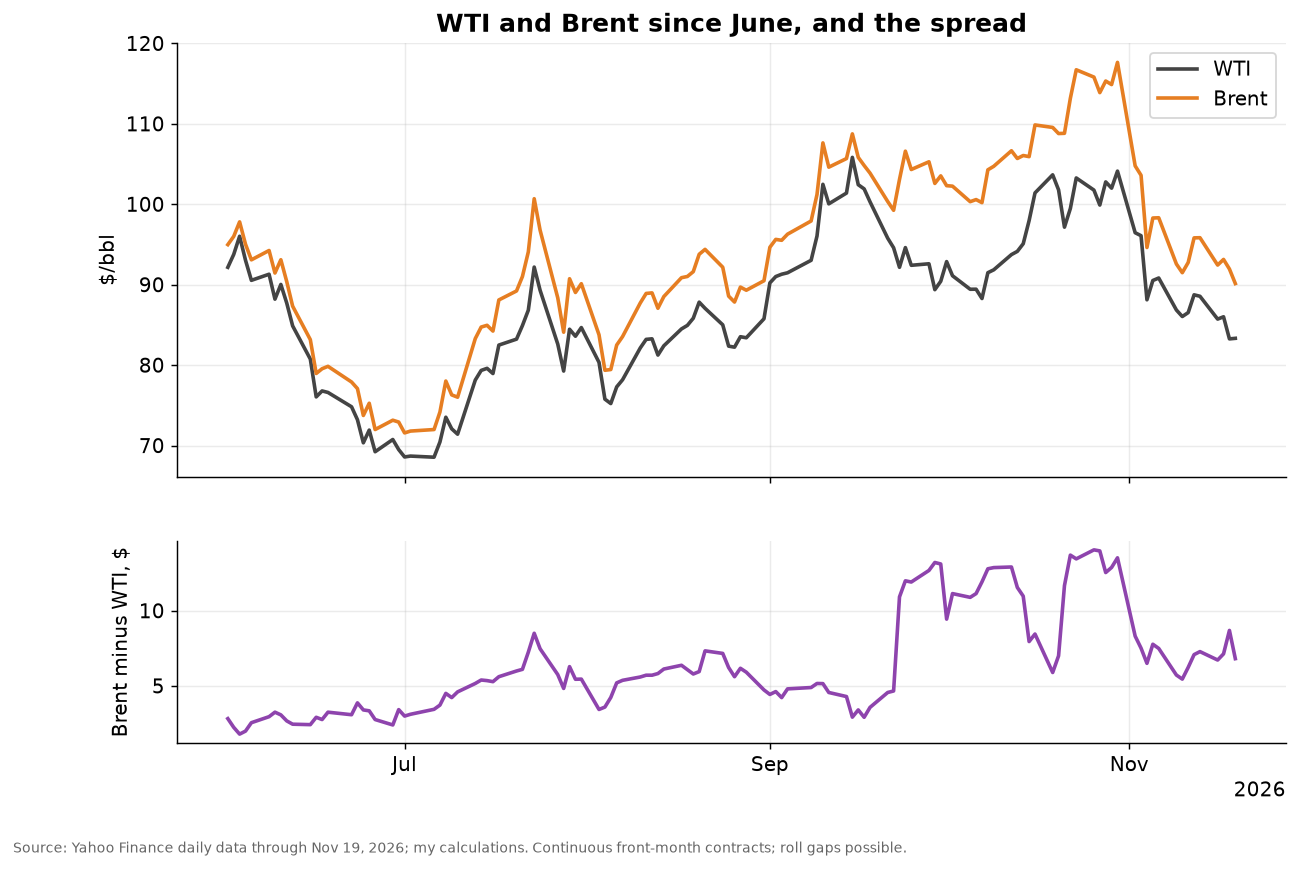
The premise check. The premise traces to a single news-feed headline in a late pass of the report, “US Futures Rally on Anthropic Record IPO; Trump, Xi, Putin Meet”, which that pass read as a trilateral meeting agreeing to boost global fuel supply. Secondary-source reporting is thinner. Newsquawk wrote only that Trump and Xi “both feel strongly that oil should flow through the Strait of Hormuz”. I found no report of a formal supply agreement. Prices did fall on Wednesday, but the clearer drivers were the EIA’s report of a 3.4-million-barrel crude build to 417.8 million barrels and a strong dollar. WTI reached a three-month low of $81.20 and recovered to about $83, with Brent near $92, per FXStreet and Reuters, secondary sources.
The tape. The short has been right for a month and wrong for much of the three months before that. WTI’s 52-week high in the Yahoo series is about $113, so the contract is 26% below it, and it sits below its 20-day and 50-day averages (near $92.5 and $94.5) but above the 200-day (near $88.2), which is an unusual place to be short from. My daily RSI is 35. Over the last month the short is up about 20%, over five sessions 6%.
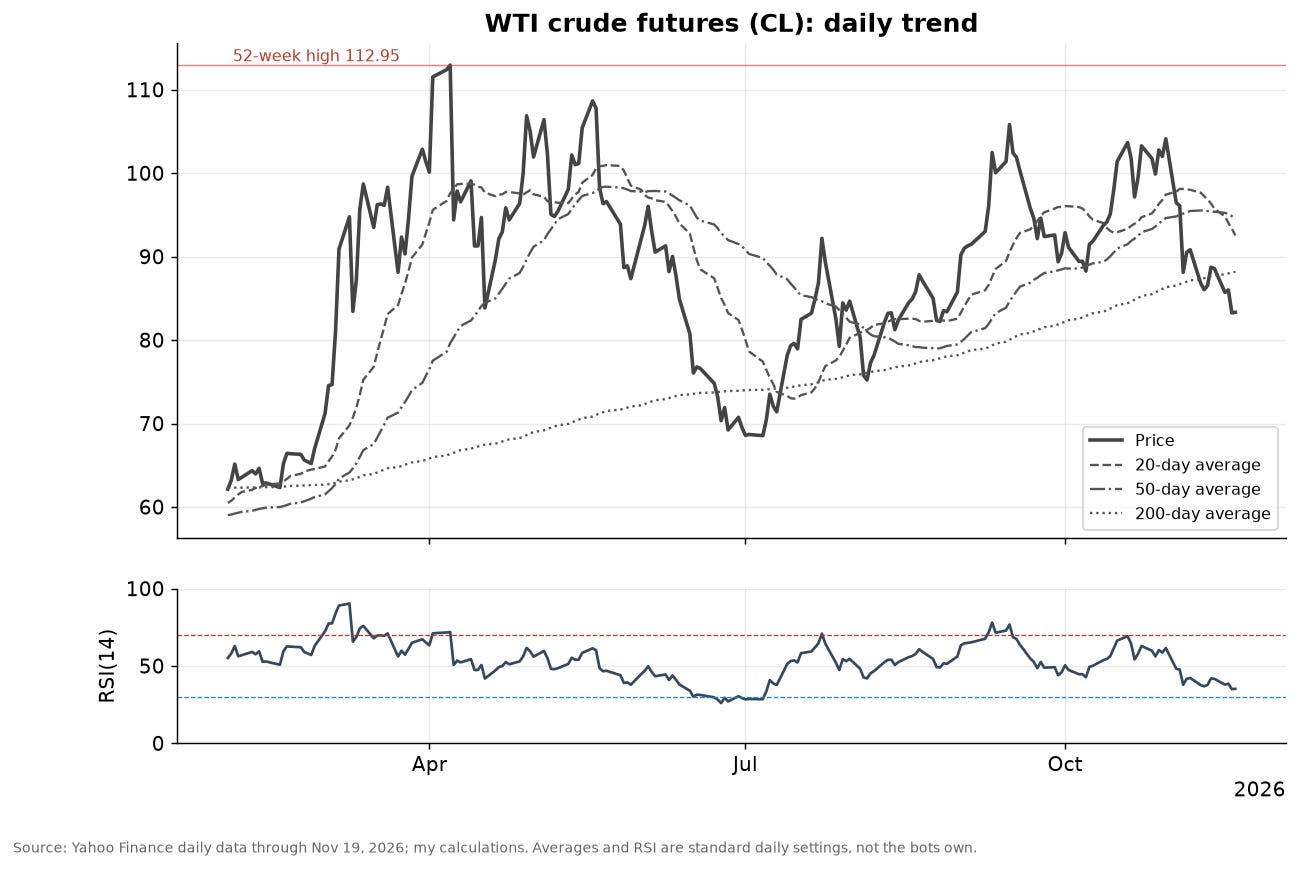
The fundamental view. Brent at about $92 against WTI at about $83 leaves a spread of roughly $9, wide because the Gulf supply risk sits in the seaborne benchmark. The bot trades only WTI. The December WTI contract expires tomorrow, per CNBC, so a roll is imminent, and the bot does not see it. The report’s own closing synthesis said the opposite of the bot: “Long CL call spreads for the $83+ geopolitical move”. The CL short is a bot built on a different pass of the report than the one that gave the final advice.
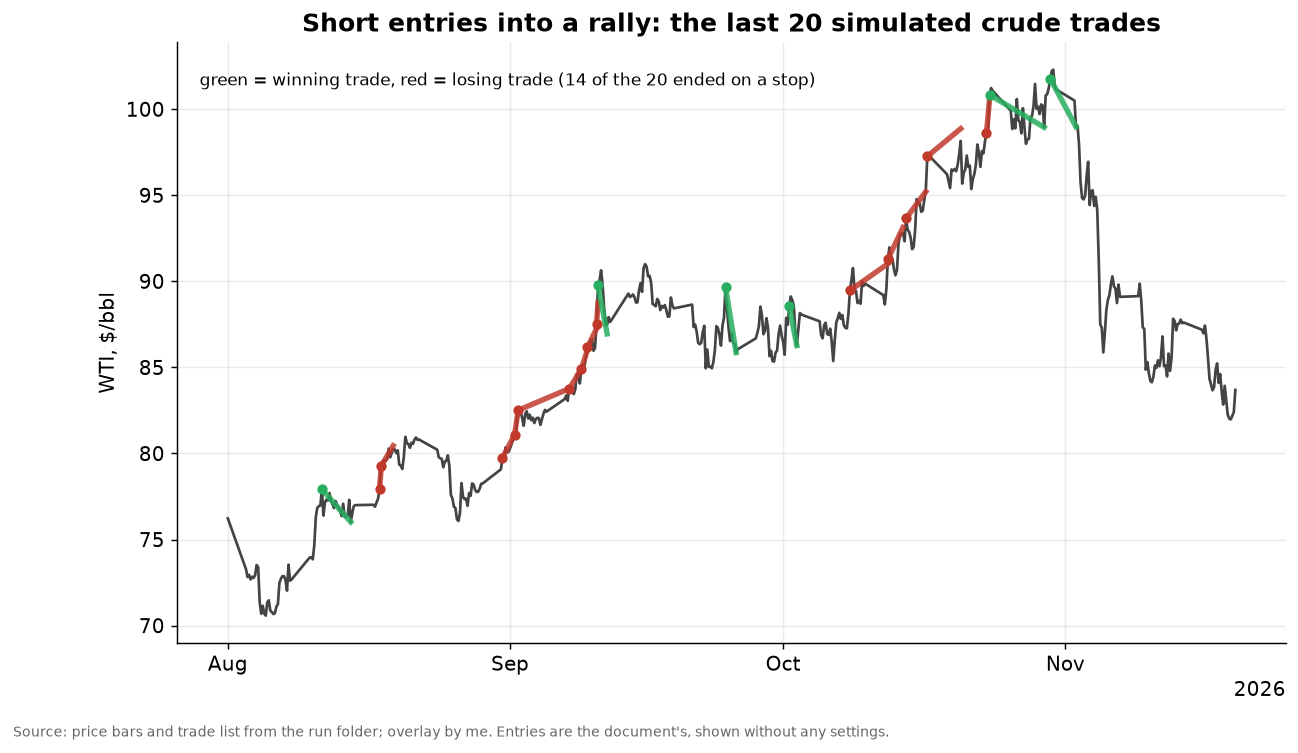
The quant view. The bot’s design is a mean-reversion short in a downtrend. A convenient model for that is an Ornstein-Uhlenbeck process, with a half-life that says how long a rally takes to fade:
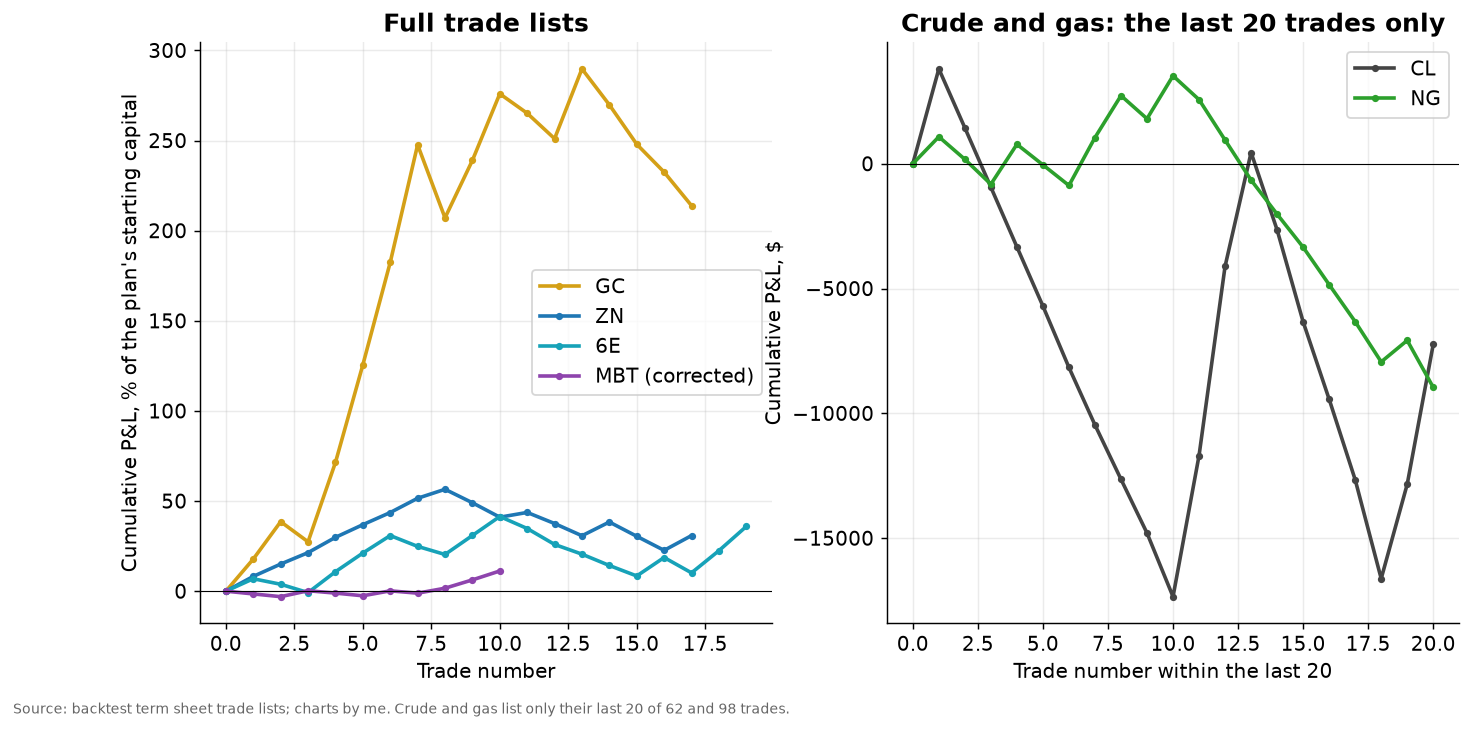
The weakness is the drift. When crude is trending up, as it did through much of the autumn, a short that fades each rally meets a series of stops, because the mean itself is moving. The printed trade list shows exactly that: of the last twenty trades, fourteen ended on a stop, and the cumulative result across those twenty is a loss of about $7,200. The headline profit is $10,000 on 62 trades, so the first 42 trades earned about $17,200 and the last 20 gave back $7,200. That is not what a stable edge looks like.
Expectancy. The term sheet reports 62 trades and 23 winners, with an average win of $4,521 and an average loss of $2,410. The expectancy per trade, for win probability p, average win W and average loss L, is:
With a 37.1% win rate, the expectancy is about $160 per trade, and the break-even win rate is about 34.8%, so the bot clears break-even by 2.3 percentage points. A few more stop-outs would erase it. The term sheet’s own Sharpe is 0.35, its maximum drawdown is 103% of starting capital, and the pipeline’s rule check flagged the drawdown as a violation of its own target, yet the bot sits in the “profitable” list because net profit is positive.
Volatility. Crude volatility is about 50% annualised, the 20-day one-sigma move about ±13%, or about $11 on the price, which is about $11,000 per contract. One contract is an $83,000 notional position that can move $2,400 in a one-sigma day.
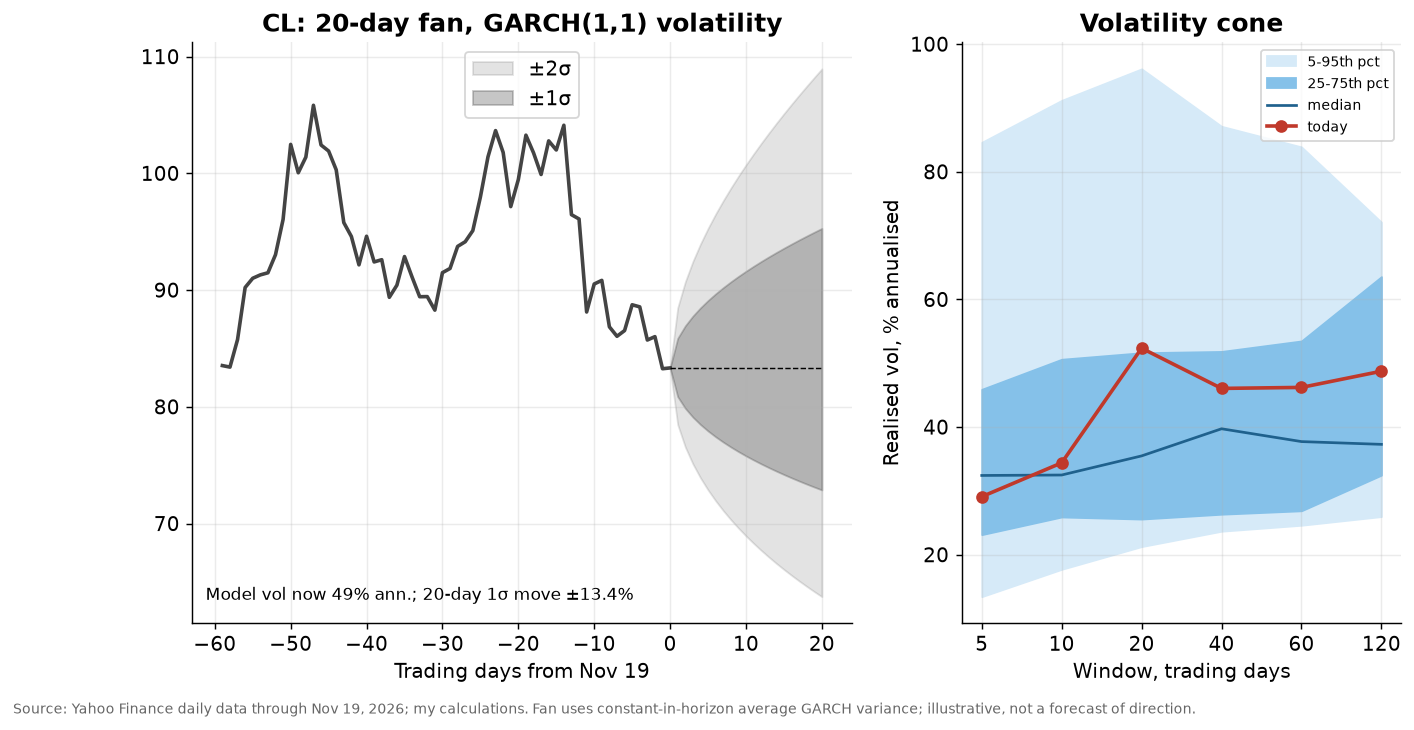
Verdict. Working today, a liability for much of the sample, and a thesis label that the sources do not support. The risk is asymmetric: if a Hormuz incident escalates, the short sits on the wrong side of a spike that can arrive overnight.
Bot 5: MBT Micro Bitcoin basis-carry short leg
The claim. The report’s key source on this was a long note from Sygnum, a digital-asset bank, on the Bitcoin carry trade: buy spot, short CME futures, and earn the basis. The plan says the bot is “the short leg” of that carry, paired against spot “so the bot carries low BTC price beta”, with a cautious short tilt while Bitcoin tests $62,000, and a kill-switch if basis or funding stays below Treasury-bill yields for two consecutive quarters. Plan estimate: Sharpe 1.60, win rate 53%, annual return 35%.
What the report actually said. The report’s own cautionary line, in the first pass, was that “nothing in this feed justifies a fresh, unhedged directional crypto futures position today”. The edge it saw was in spreads and hedged carry. The bot is a bare short, with no spot leg and no option hedge.
The tape. Bitcoin is the strongest-performing short in the book: about $63,200, down 11% in a week, 14% since the CPI print and 23% in a month, and 35% below its 52-week high of about $97,000, set in January. My daily RSI reads 22.8, the most oversold of the eight. CoinDesk, a secondary source, reported US spot ETFs lost $306 million on Wednesday and about $975 million over seven days, leaving assets at a three-month low of $77.7 billion, with puts about 70% of options volume.
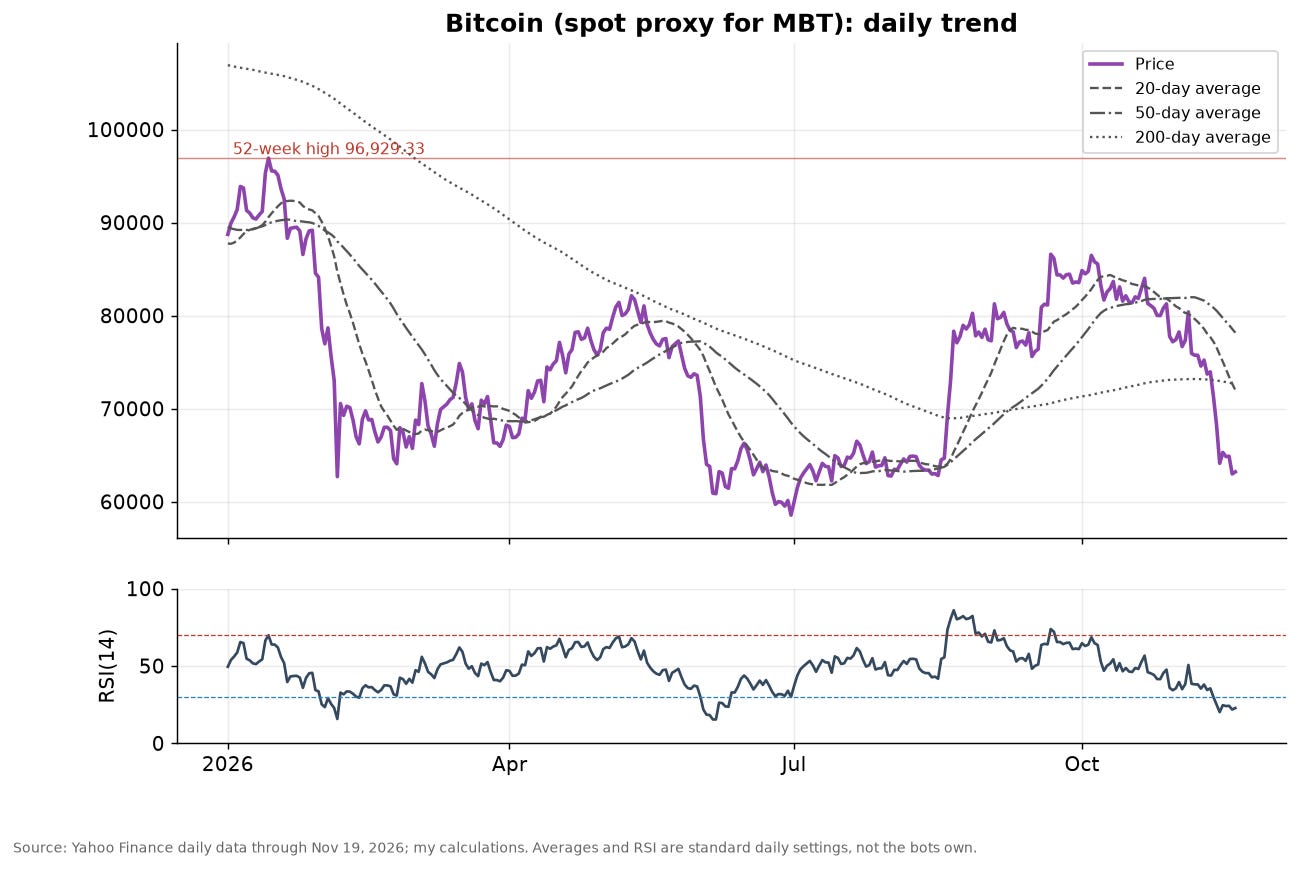
The carry premise is stale. The thesis assumed funding had recovered to about 8% annualised and the basis was well above bill yields. CoinDesk’s Thursday read has funding near neutral. A carry trade earns the difference between futures and spot, annualised, over the risk-free rate:
A carry trader makes money when the spread is positive and does not care about direction, because the spot long offsets the futures short. This bot has no spot leg. It is simply a short Bitcoin futures position with a carry-themed name, and its profit this week comes from Bitcoin falling, not from carry.
What the code does with carry. The file tracks a “carry regime” quarter by quarter and kills entries if the carry spread stays negative for two quarters running. When the data feed does not supply the basis, funding and bill-rate fields, the code substitutes them: basis and funding are set to the bill proxy plus a small amount that rises with the bot’s own price-momentum reading, and the bill rate is a fixed placeholder. Because the substitute is never below the bill rate, the spread it computes cannot go negative, and the kill-switch can never fire. The safeguard in the story is not a safeguard in the code.
The quant view. Bitcoin’s 60-day correlation with the Nasdaq-100 ETF is about 0.6, and about −0.26 with the dollar index. It is 35% below its 2026 high and was about 40% below at the worst point this year. In a sell-off led by AI-linked equities, a Bitcoin short is a hedge; in a relief rally led by the Anthropic IPO it is a squeeze.
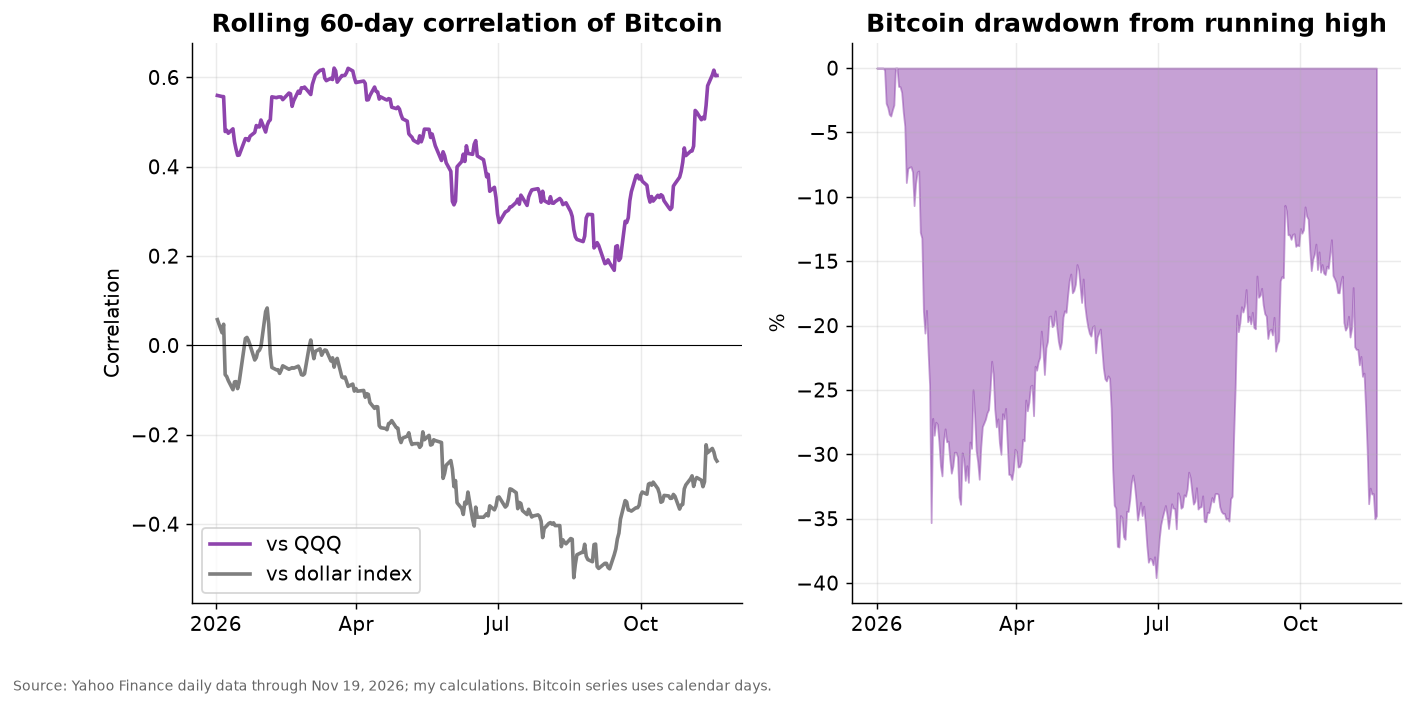
Volatility. Bitcoin’s GARCH volatility is about 45% annualised, with low persistence of about 0.86, so volatility shocks decay fast. The 20-day one-sigma move is about ±10%, about $6,600 on the price. One Micro Bitcoin contract is 0.1 bitcoin, so a notional of about $6,300 and a one-sigma day of about $130 per contract. It is a small contract, which is why the unit error in the backtest, discussed below, matters so much.
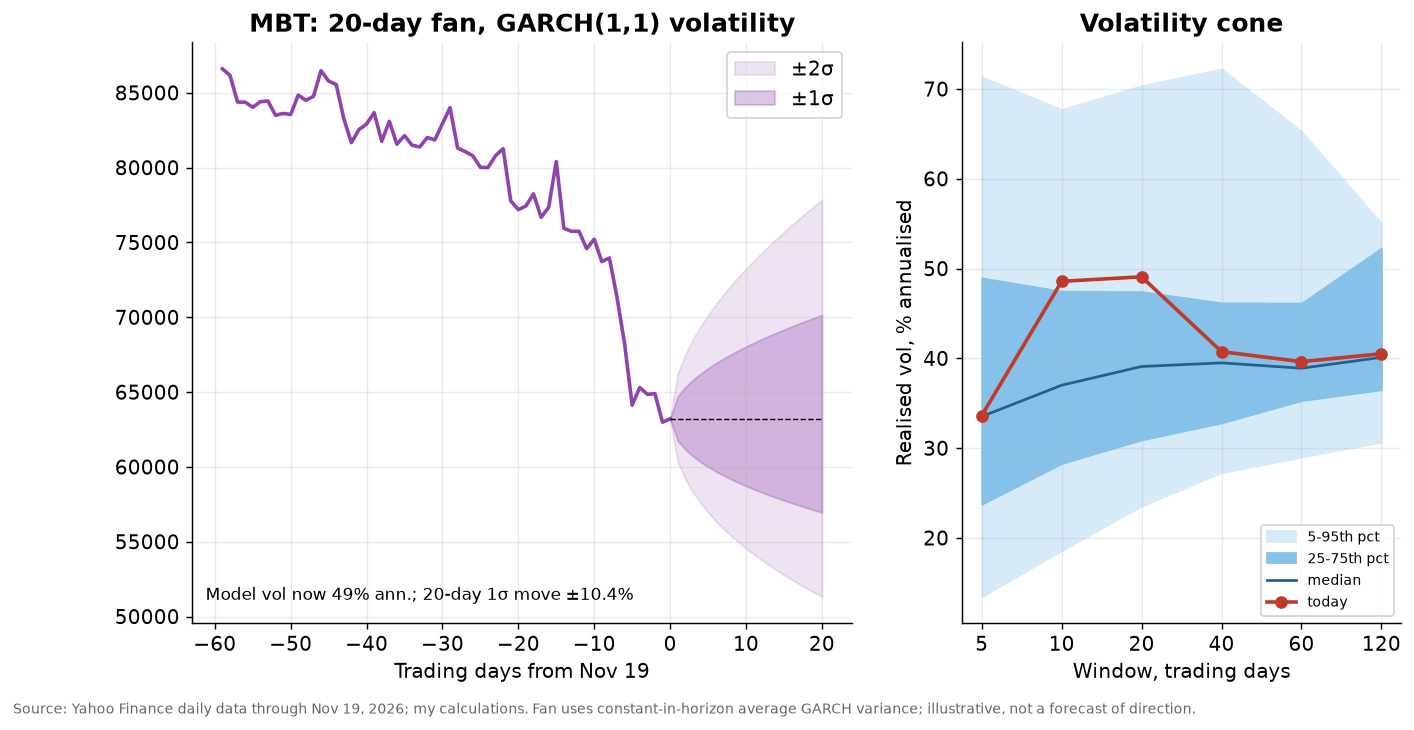
The record. Ten simulated trades, five winners, a printed Sharpe of 1.28 (a t-statistic with a one-sided p-value of about 0.12), and a headline profit of $20.2 million that is wrong by a factor of 10,000. Corrected, it is about $2,000. Verdict: working, but for the wrong reason, and the carry safeguard cannot activate. The honest label is “naked short Bitcoin in a momentum regime”, which is exposed to the sharpest mean-reversion in the book.
Bot 6: NG natural gas winter AI-load long
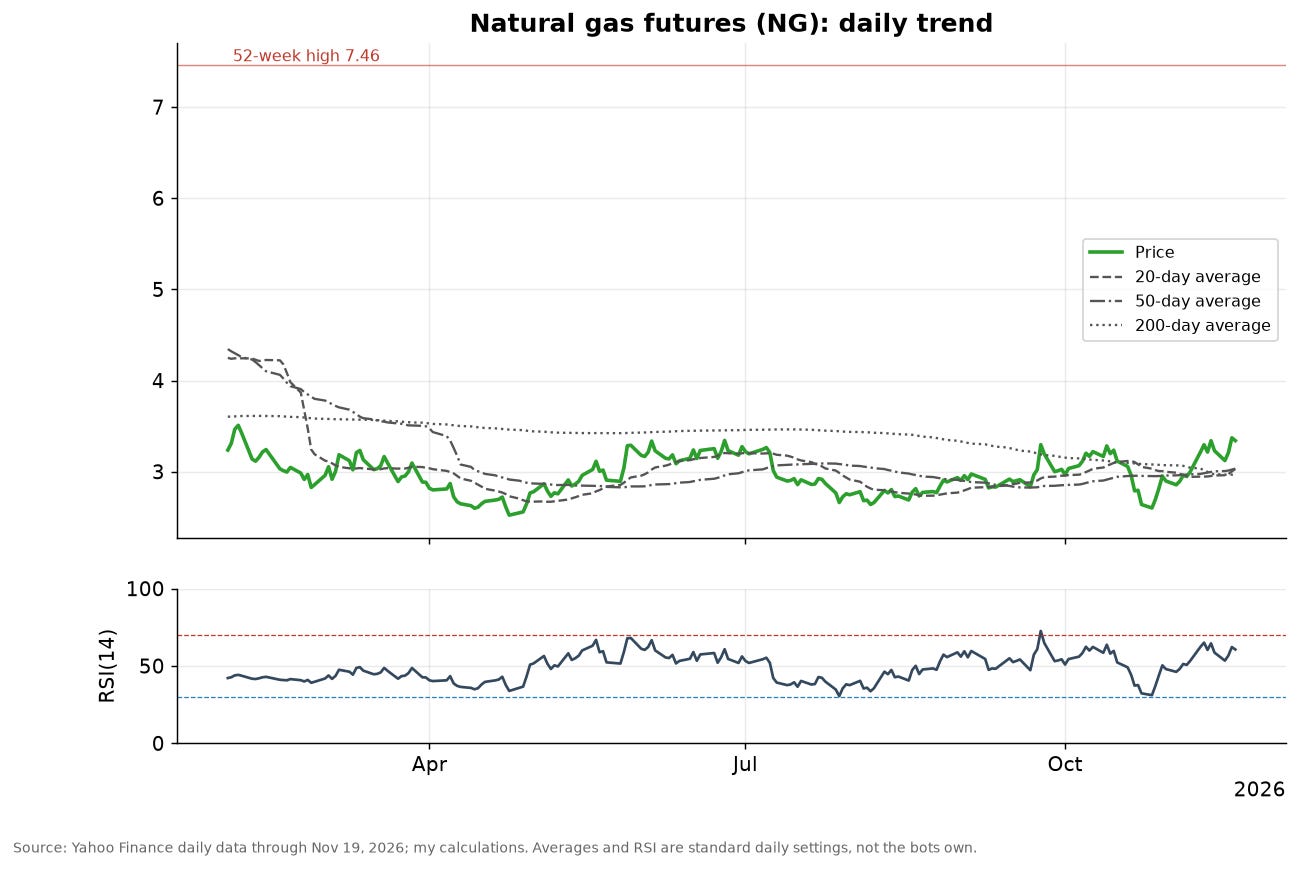
The tape. Natural gas ties SpaceX as the most volatile market in the book, and today it is at about $3.34 on the front-month, up 9% over the last month and down 55% from its 52-week high of $7.46 in the Yahoo series. Daily RSI is 60.7, the only one of the eight in the upper half. It is above its 20-, 50- and 200-day averages, near $3.03, $3.03 and $2.97. This is the most constructive tape in the book for a long.
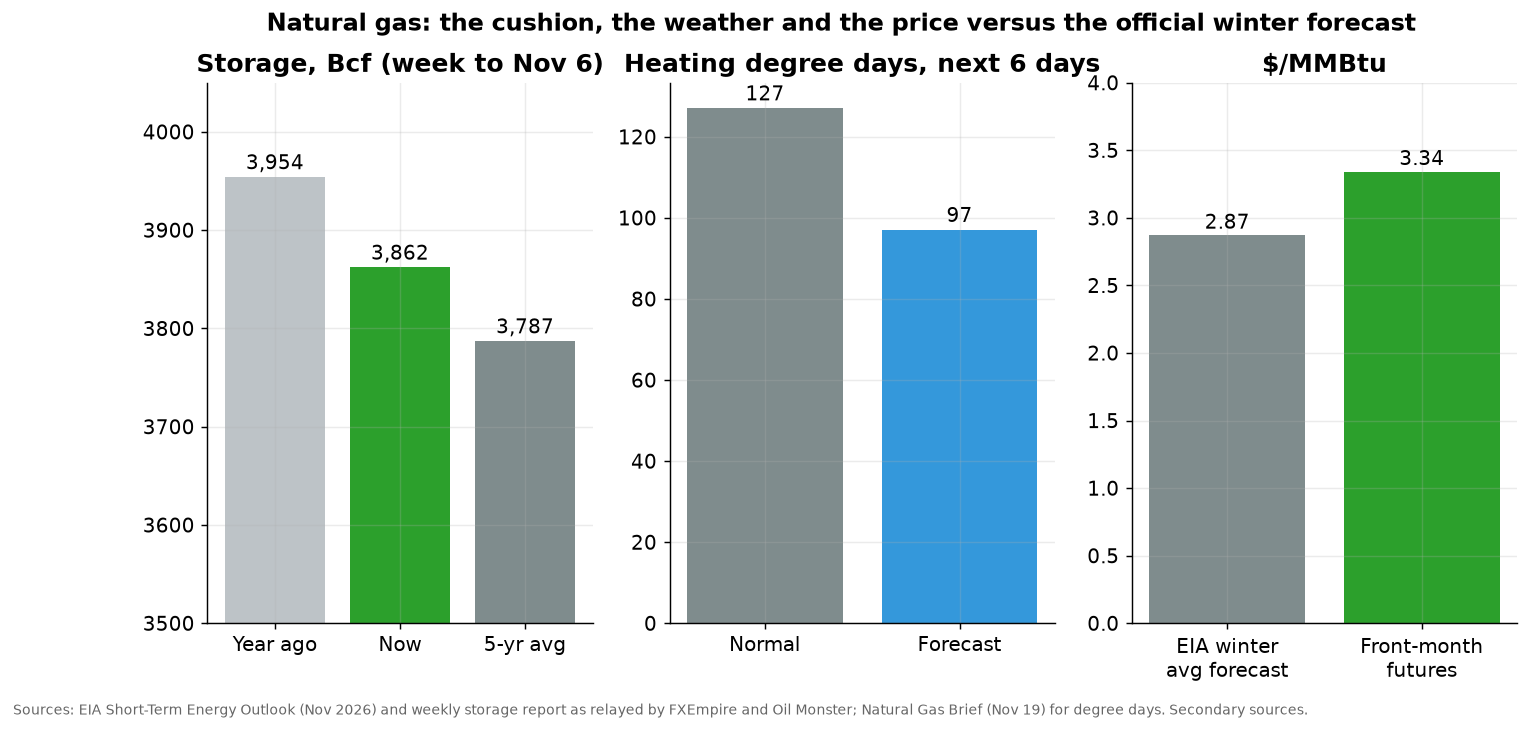
The fundamentals are not on the bot’s side, and neither was the report. The report’s own synthesis favoured call spreads over an outright long in natural gas, precisely because of the Alibaba headline. Storage stands at 3,862 billion cubic feet, 75 above the five-year average and 92 below a year ago, according to FXEmpire and Natural Gas Brief summaries of the EIA data (secondary sources). The EIA’s outlook has Henry Hub averaging $2.87 over the winter, well below the roughly $3.34 the futures pay now. Heating-degree-day forecasts for the coming days are 97 against a normal 127, a mild reading. Managed money is net short about 224,000 contracts, which is a squeeze risk if a cold snap arrives. AI data-center demand is real but slow, and it does not move a weather-driven price over a few weeks.
What “winter” means in the code. Nothing, as a calendar. The file does not check the month. The word “winter” appears in the name and the exit reason, and a “seasonal” adjustment tightens the stop in choppy ranges, a volatility-regime tweak. The bot would behave identically in July. It reads no storage, weather, LNG or positioning data.
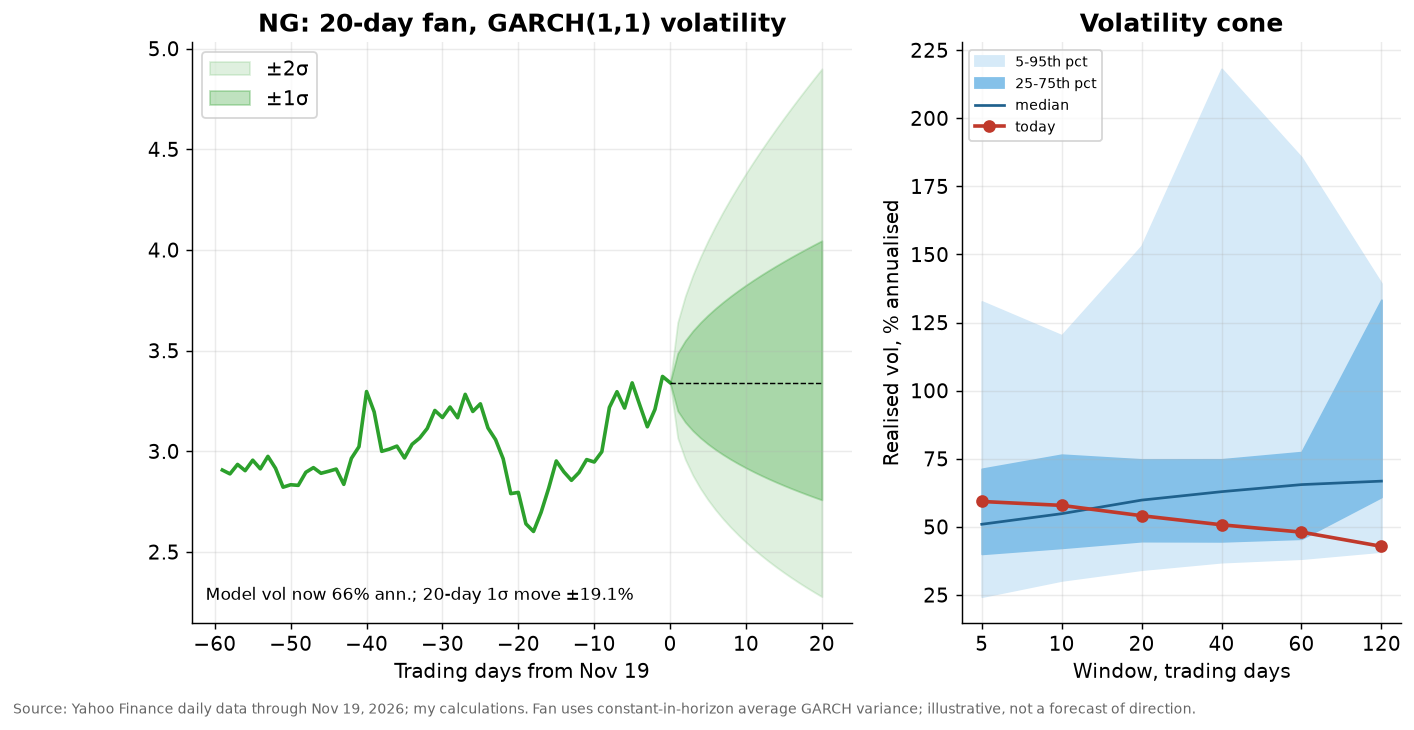
Volatility and the roll. Gas volatility is about 54% over twenty days and the GARCH fit says about 68%, with low persistence, a hallmark of a market where shocks fade. The 20-day one-sigma move is about ±19%, about $0.64 on the price or about $6,400 per contract, against a notional of about $33,400. The December contract expires around November 25 (verify against the exchange calendar), and the bot’s file is labelled for a July contract.
The record. The term sheet reports 98 trades with a 43% win rate and about $9,600 profit, a Sharpe of 0.64, and a drawdown of 105% of the plan’s starting capital. The printed last 20 trades lost about $9,000, with 14 stops, and this is the second bot whose recent trades lost more than its all-time average implies. The break-even win rate for its average win-to-loss ratio of about 1.54 is 39%, so 43% clears by about 4 points. Verdict: neutral. The tape is helpful, the fundamentals are not, and the story is mostly decoration.
Bot 7: XSPCX0 micro SpaceX Anthropic-contract long
The claim. Buy a micro single-stock future on SpaceX because of a $120.5 billion Anthropic spending commitment flowing to SpaceX, about $3.1 billion a month from December through 2029, despite a 31% post-IPO drawdown. The plan labels it “backtest-only”. Plan estimate: Sharpe 1.70, win rate 57%, annual return 40%.
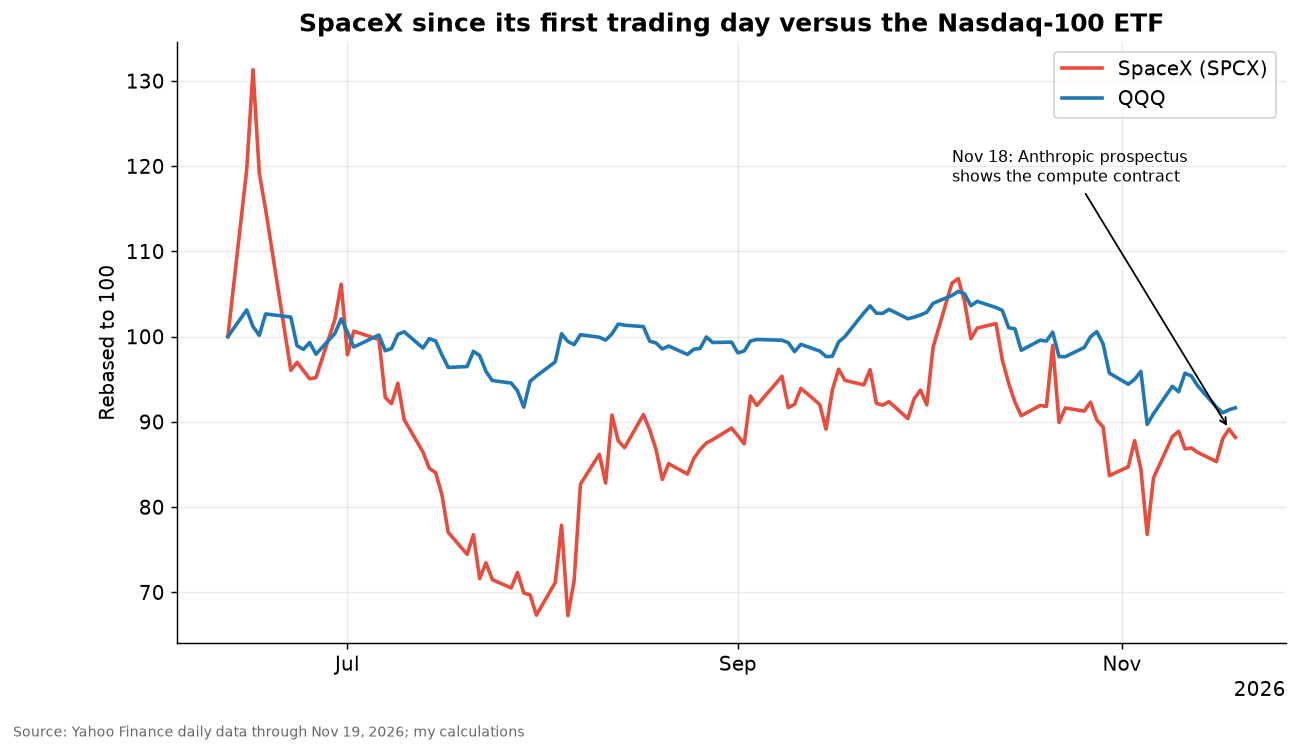
The facts, secondary-sourced. Motley Fool and Investing.com reported SpaceX near $141.70 on November 18 and described the compute contract as worth up to $120.5 billion through 2029, at about $3.1 billion a month from December, with a 90-day exit notice available after early 2027. At full run-rate that is about $37 billion a year (my arithmetic). The exit clause matters: it turns a headline number into a revenue stream with an option for the customer to leave.
The tape. My Yahoo series has 112 trading days. The stock listed on June 12 at $160.95, spiked to $211.39, fell as low as about half of that high, and is $141.94 now, 33% below the peak and about 12% below its first close. It is below its 50-day average (near $148). Realised volatility is about 62% annualised, and the GARCH fit says about 68%, which puts it level with natural gas as the most volatile name in the book.
The quant view. The contract’s value is a stream of payments, so a present value:
At $3.1 billion a month for 37 months the nominal total is about $115 billion, and discounted at 6% to 10% it is about $99 billion to $105 billion. That is a large number against a company of SpaceX’s size, but it comes with a termination option, and a momentum bot cannot tell a signed contract from a rumour. The one-sigma 20-day move of about ±19% dwarfs most of what the contract could add in a month.
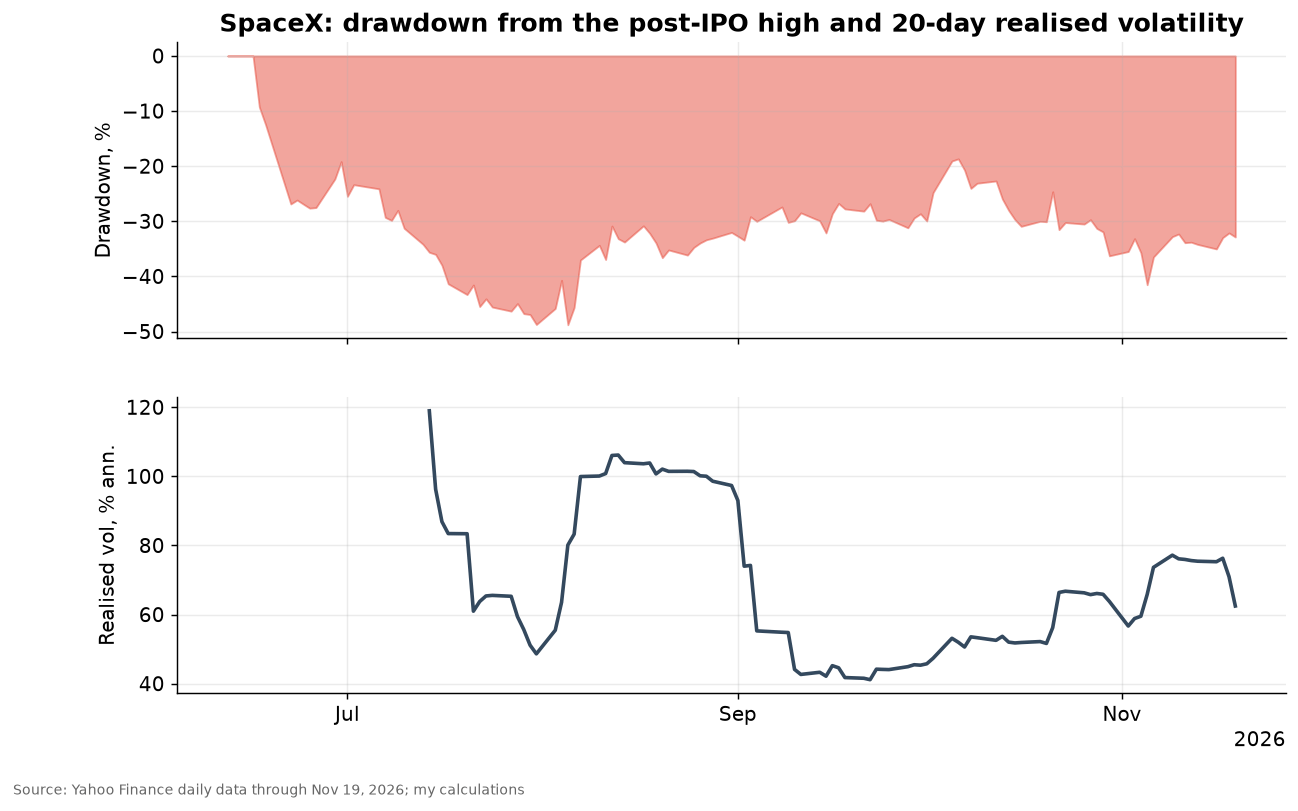
What the bot sees. A single-stock future is a leveraged slice of the share. The bot reads prices only. It has no knowledge of the Anthropic debut today, of any lock-up expiry, of the exit clause, or of earnings. It also cannot run as written: the file’s root symbol does not match the plan’s, and the term sheet says the symbol is not a configured root at the vendor, so no history exists. The backtest therefore reports zero trades, “using plan metrics”, with a probability of profit of 20% and an F grade. That is a data failure, not evidence about the strategy.
Verdict. Flat, untestable, and the most event-exposed bot in the book. A fund that wanted to express the Anthropic thesis would need the contract’s termination terms, not a trend filter.
Bot 8: XNEM00 micro Newmont gold-uncertainty long
The claim. Buy a micro single-stock future on Newmont as the equity read-through of the gold-uncertainty thesis, from the Iran war and tariff-driven inflation, complementing the gold future. It, too, is “backtest-only”. Plan estimate: Sharpe 1.30, win rate 54%, annual return 25%.
The tape. Terrible. Investor’s Business Daily, Yahoo Finance and Seeking Alpha (secondary sources) reported Newmont down between 5% and 8% on Wednesday as gold broke lower. It trades at $102.88, down 14% since the CPI print, 8.7% in five sessions and 24% from its 52-week high of $135.14. My RSI reads 36.
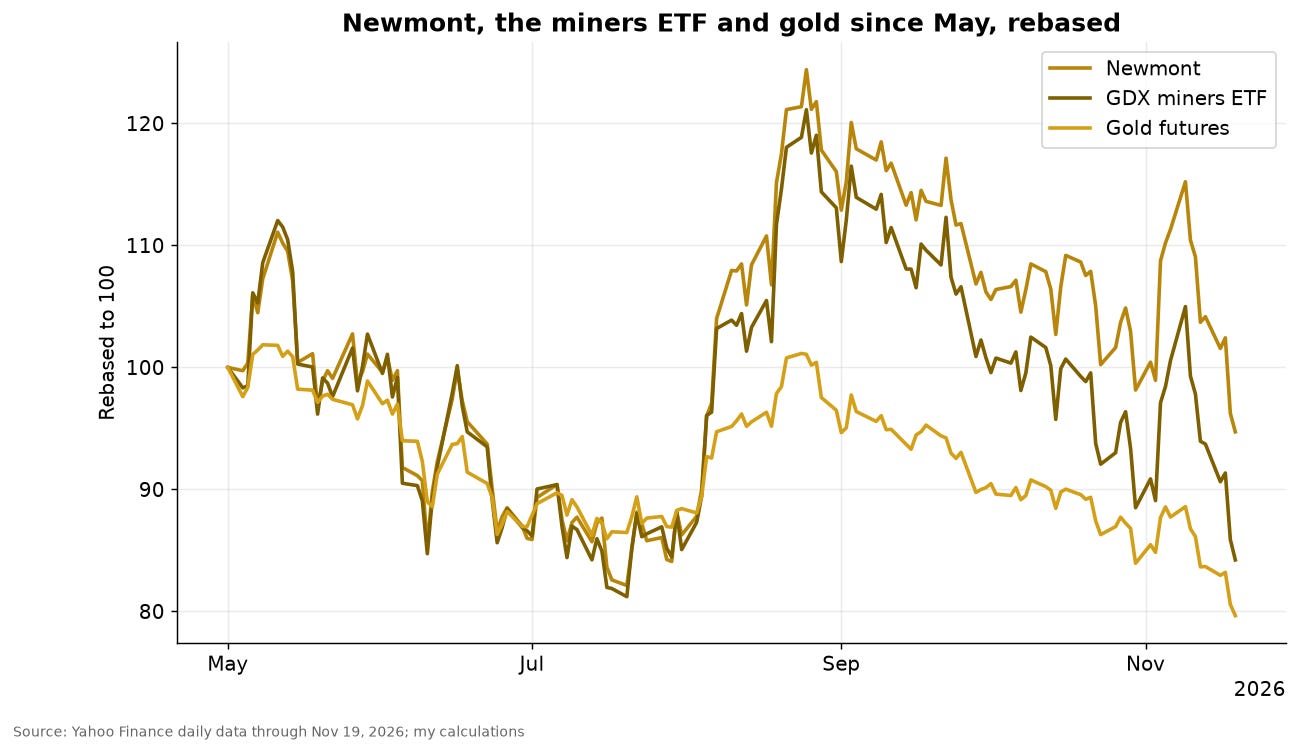
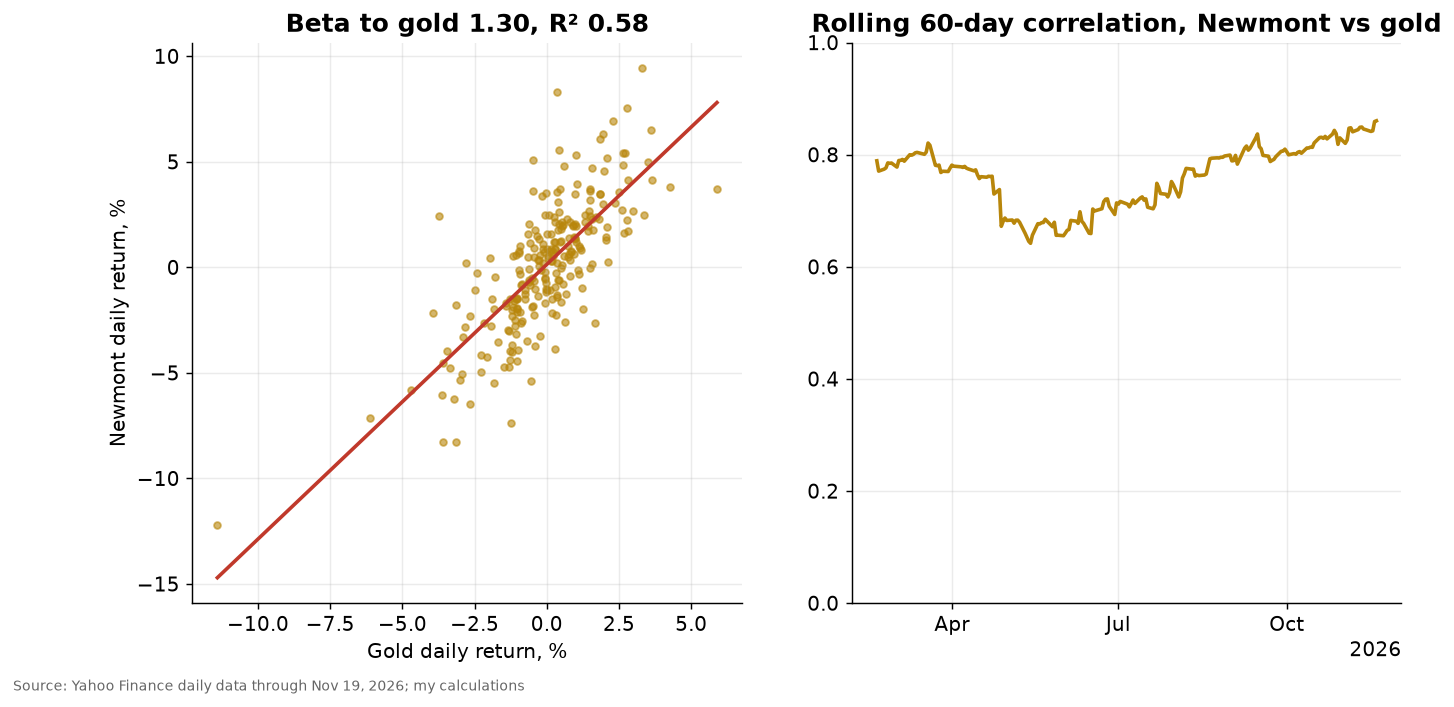
The quant view. Newmont is a levered play on gold. Regressing its daily returns on gold’s over a year gives a beta of about 1.3 and an R² of about 0.58:
If the gold long is wrong by 8%, a 1.3-beta stock is wrong by about 10%, and about 42% of its variance is its own company risk: earnings, costs, production and the equity market. The two bots’ direction-adjusted daily returns over my 111-day common sample have a correlation of 0.83. That is one trade held twice, and the portfolio section shows it in the correlation map.
What the bot sees and misses. It sees Newmont’s price. It does not read gold, the dollar, real yields, earnings dates or ex-dividend dates. The file’s root symbol, like SpaceX’s, does not match the plan’s, and the term sheet says it is not a configured root, so there is no history, no trades and an F grade. In concept it is the same trend-and-momentum template with a long bias.
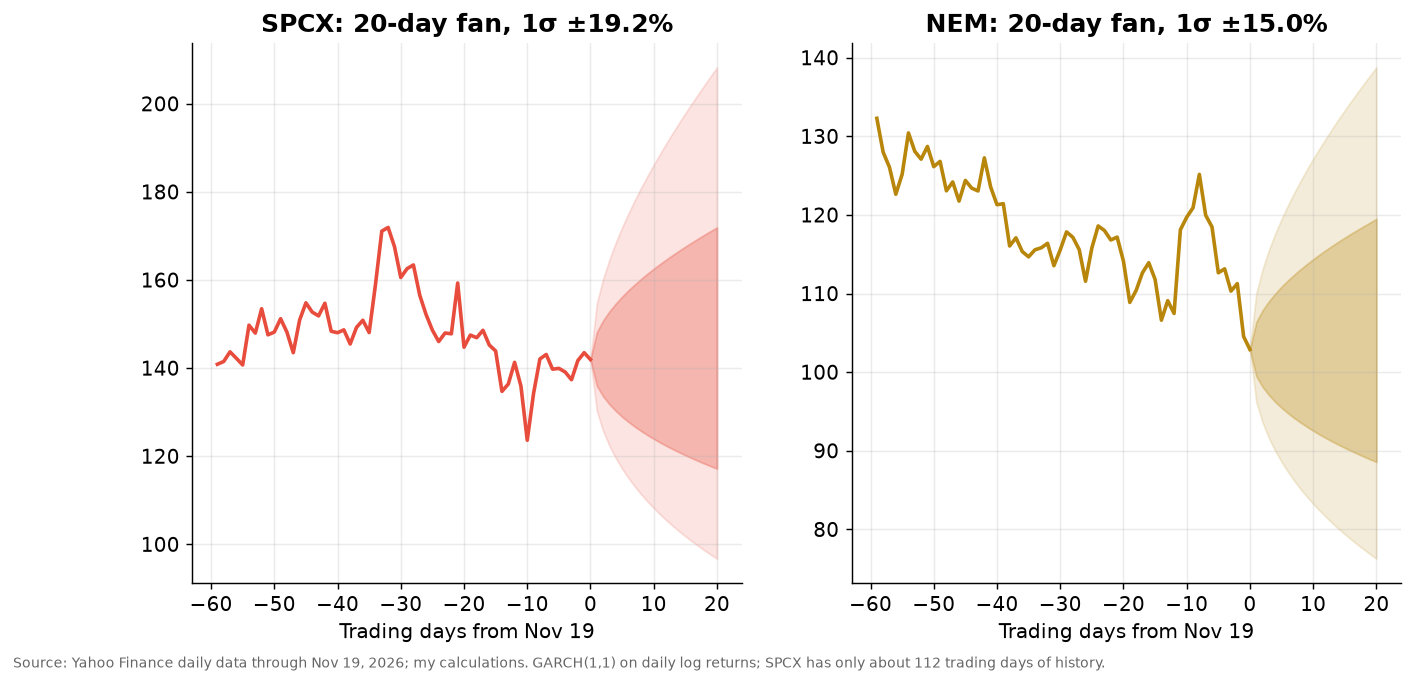
Volatility. Newmont’s annualised volatility is about 53% to 58%, and the 20-day one-sigma move is about ±15%. The GARCH persistence is about 0.98, so recent volatility will last. The two single-stock fans below show how wide the next four weeks could be for each name.
Verdict. Failing, duplicated, untestable. The only thing to say in its favour is that a trend bot will not buy a falling market until the trend turns, which is the one thing the template does well.
Portfolio view: eight bots, about five bets
A portfolio is not a list. To see what the eight bots do together, I put them on equal dollar footing, an illustrative notional per bot rather than the bots’ real sizes, took 111 common trading days of direction-adjusted daily returns, and computed the covariance matrix with an exponentially weighted estimator. The dollar notional of one position is its price times the contract multiplier, and the daily return is the log price change signed by the bot’s direction:
Here λ is the usual decay factor of an RiskMetrics-style estimator. The portfolio variance and each bot’s share of it follow from the weights w:
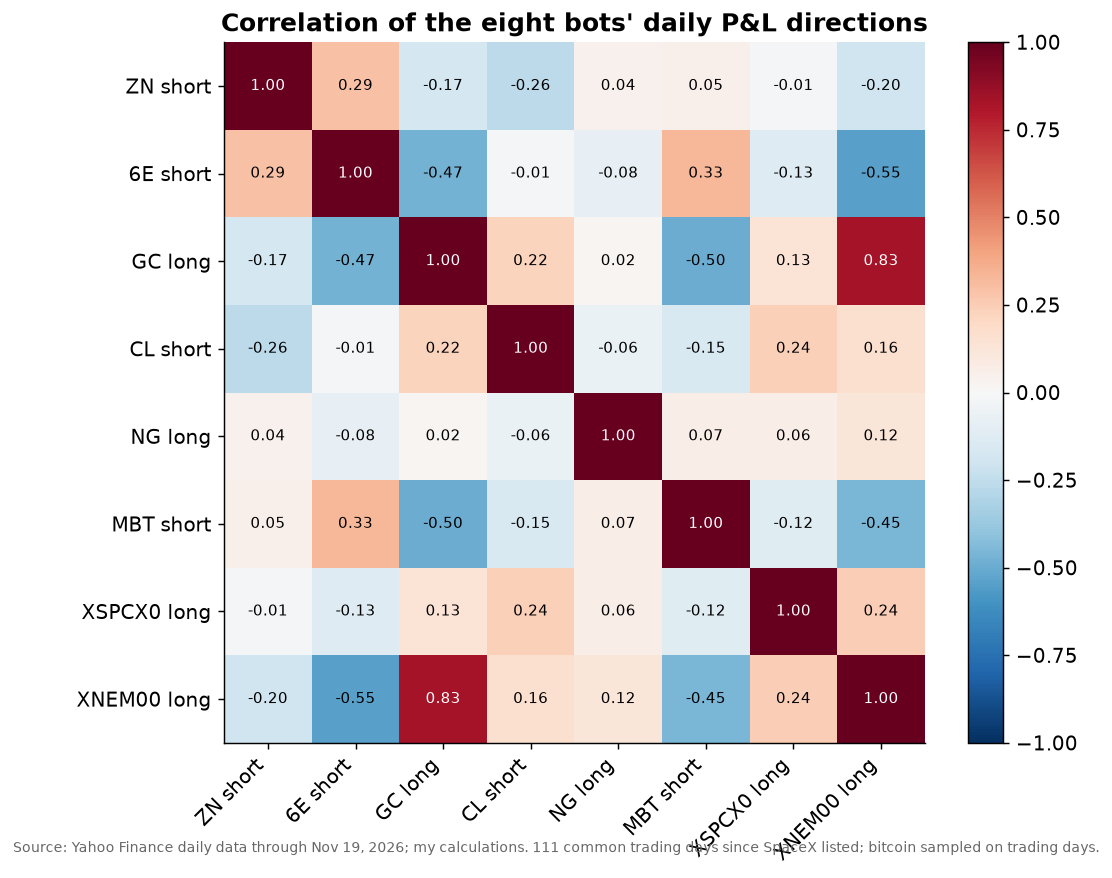
The correlation map holds the first surprise. The gold long and the Newmont long are correlated at 0.83: one trade. The Bitcoin short is negatively correlated with the gold long, at about −0.50, so those two partly hedge each other by accident. The euro short is negatively correlated with both gold and Newmont, which fits the dollar story: when the dollar rises gold falls and the euro short wins. The two energy bots and the Treasury short are close to uncorrelated with the rest.
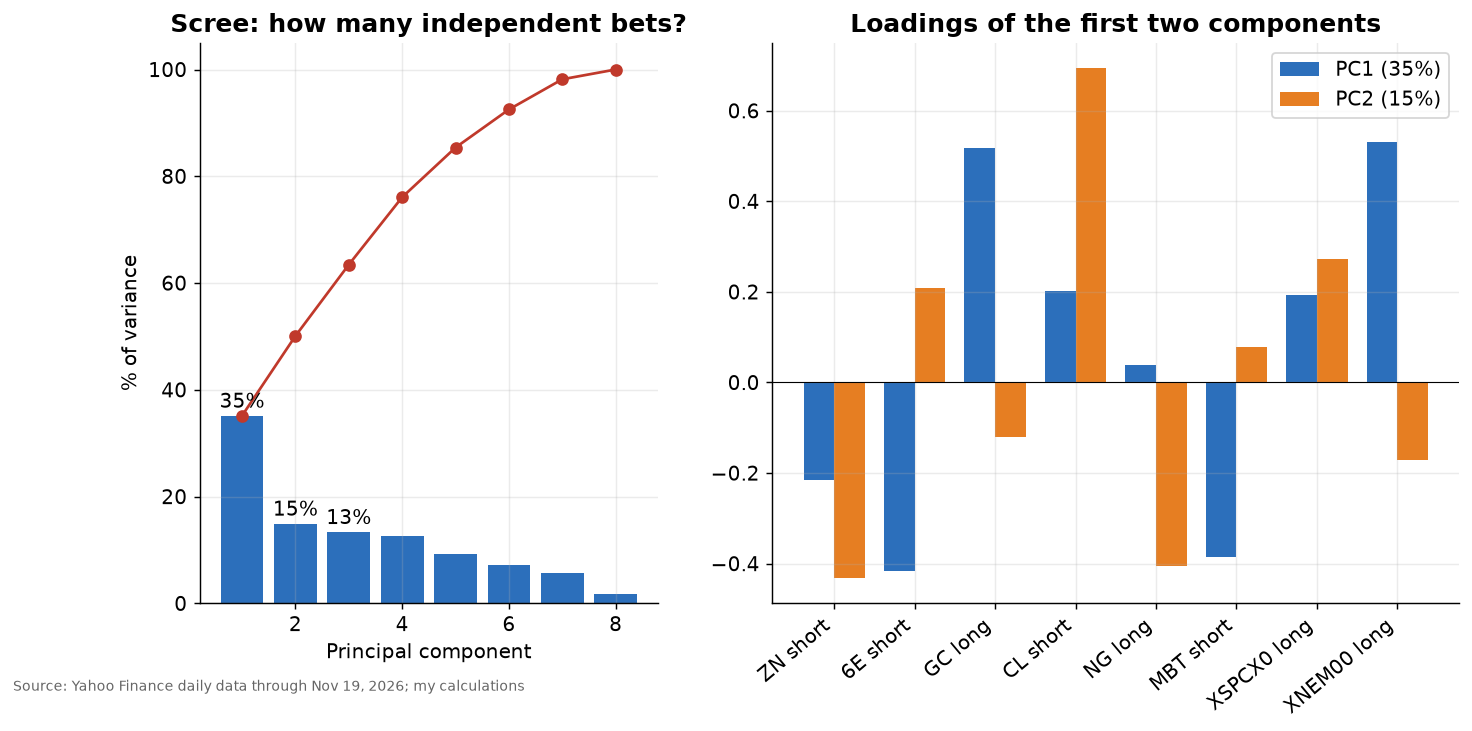
Principal-components analysis asks how many independent bets the book contains. Decompose the correlation matrix into eigenvalues λ_k and eigenvectors, and define the effective number of bets from the share each component explains:
For these eight bots N_eff is about 5.1. The first component explains 35% of the variance and the next two about 15% and 13%. Eight markets are, statistically, about five bets, and the leading factor is a mixture of dollar strength and risk appetite.
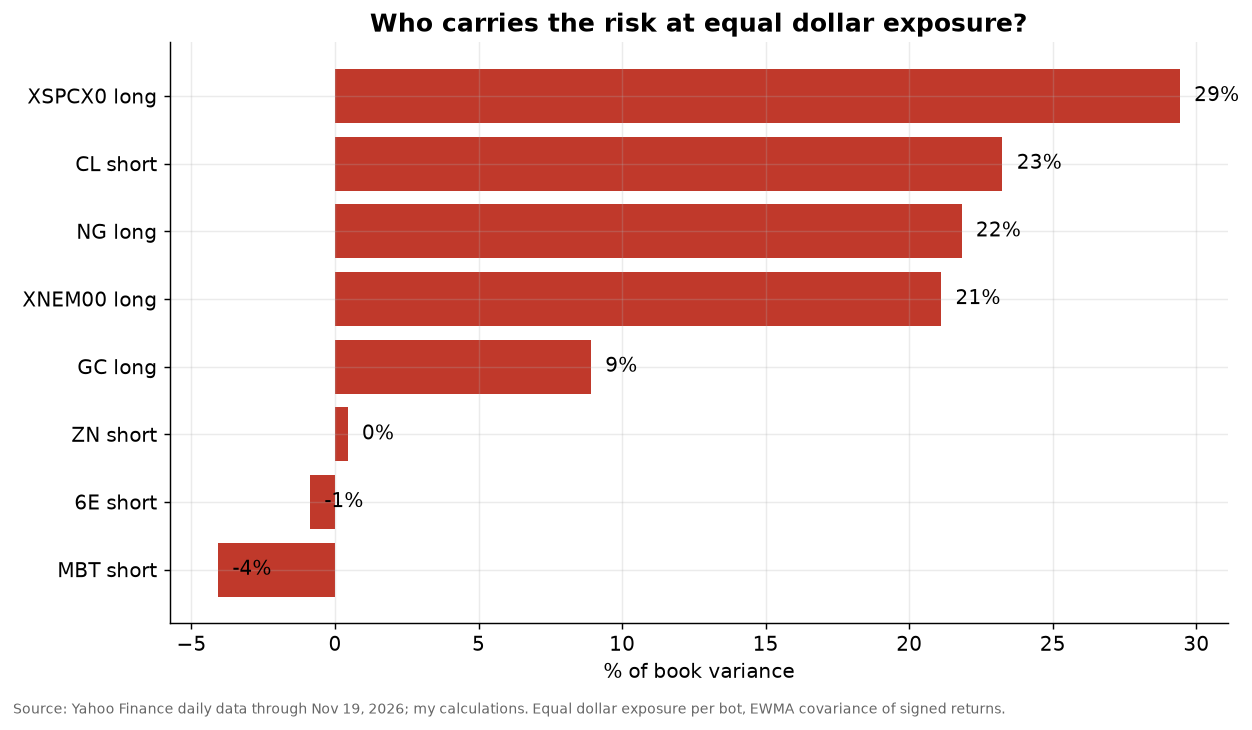
Risk contribution tells a harsher story than the count of bots. On equal notional, SpaceX contributes about 29% of the book’s variance, crude 23%, natural gas 22% and Newmont 21%. Gold adds about 9%. The Treasury short contributes almost nothing, and the euro and Bitcoin shorts contribute slightly negative amounts, because they hedge the rest. Those percentages sum to more than 100% only because two items are negative. The lesson is that equal dollar sizing is not equal risk sizing: the four volatile single-name and energy exposures drive the risk, while the lowest-volatility bots barely register.
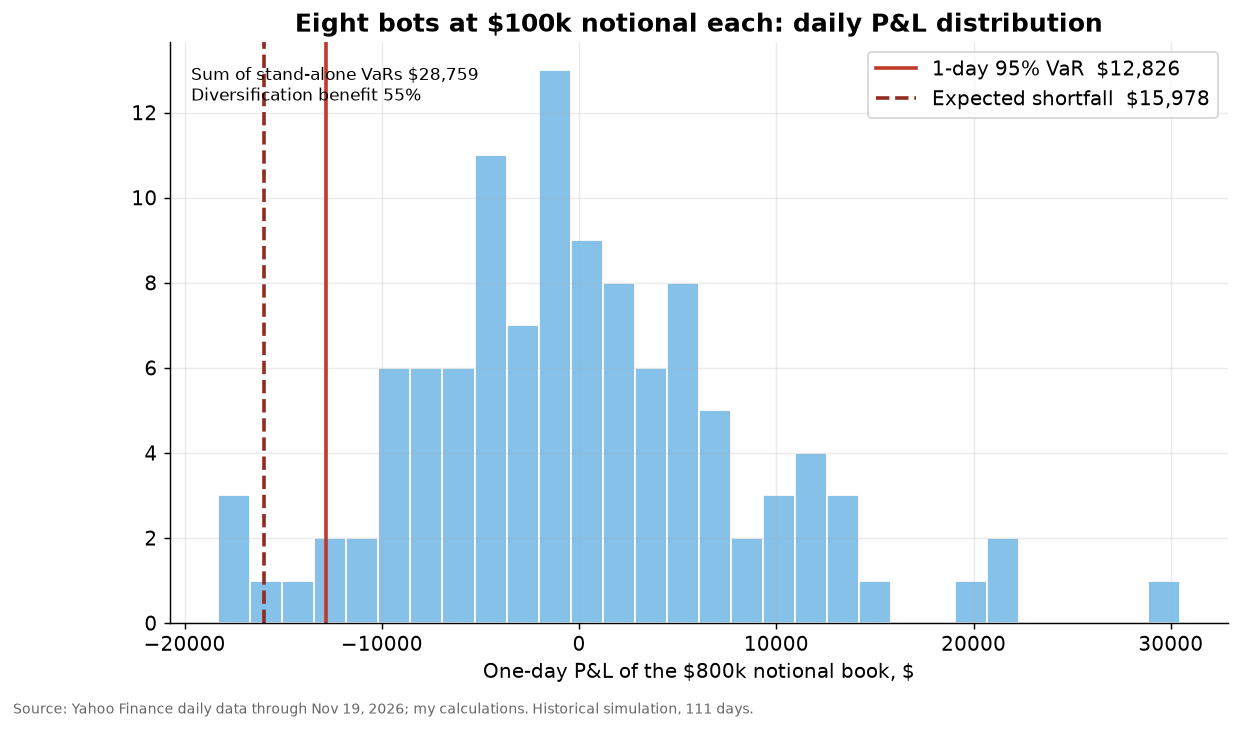
For the tail, I use a historical-simulation value at risk and expected shortfall. For loss L at confidence α, the definitions are:
On an $800,000 notional book, the one-day 95% VaR is about $12,800 and the expected shortfall about $16,000. The sum of the eight stand-alone VaRs is about $28,800, so diversification removes about 55% of the naive total. That is large, and it is also the figure most likely to disappear in stress, since correlations rise in sell-offs.
The betas come from one-year regressions. The scenario shocks are assumptions of mine, they are illustrative, and a few single-market moves in the Hormuz case are set by judgement rather than estimated.
In the Fed-shock scenario, a half-point December hike that lifts yields and the dollar and hits equities, the book loses about $20,600 net: the three shorts gain about $7,000, but the Newmont, SpaceX, crude and gold positions lose about $28,000. In the AI sell-off scenario the book loses about $35,000, mostly from SpaceX and Newmont, with the Bitcoin short earning about $12,000 as a partial offset. The Hormuz stagflation case loses about $15,000, essentially the crude short. On the upside, a Fed that relents earns about $23,700 and a dollar reversal about $21,000. One caution on the crude regression: over the last year crude has tended to rise when equities fall, because the dominant shocks have been supply scares, so the model makes the crude short lose in equity sell-offs. That is regime-dependent and should not be treated as a law.
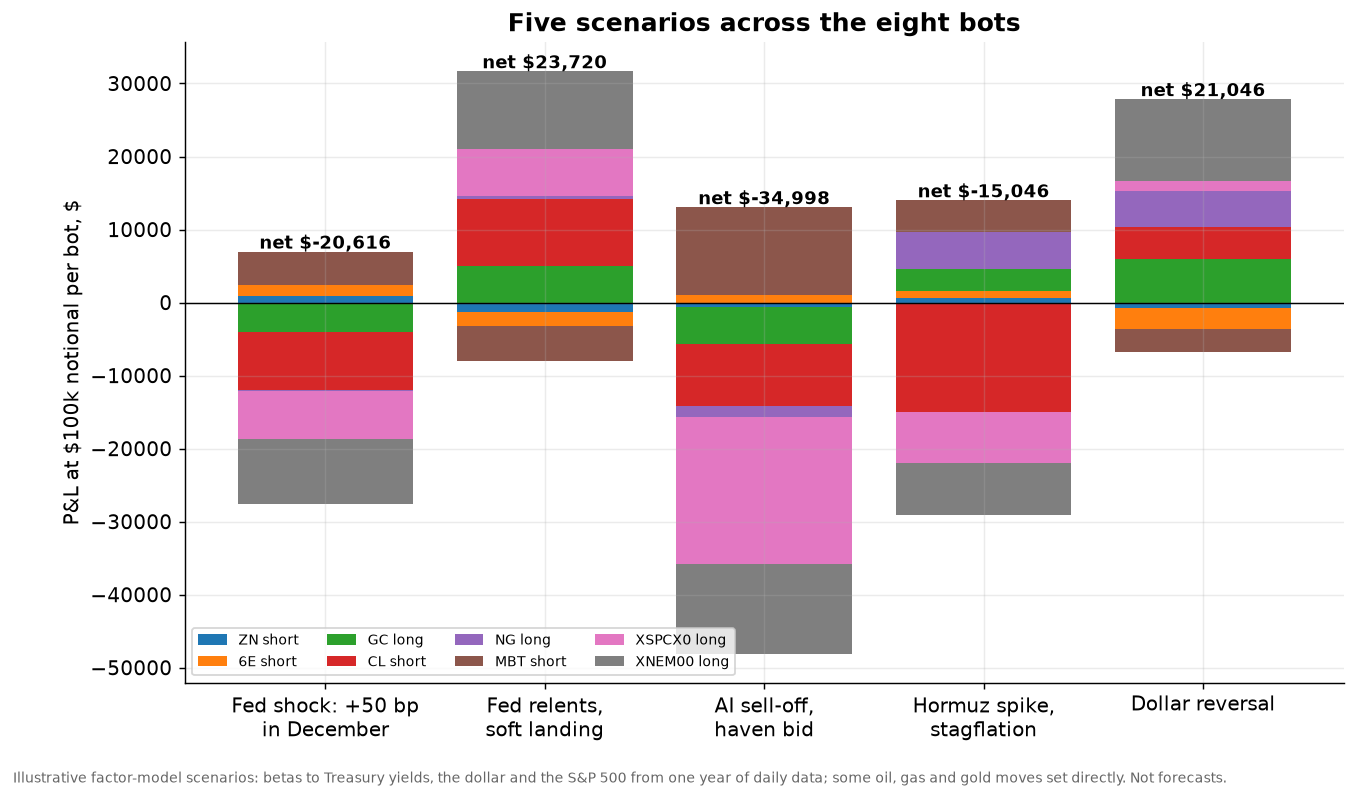
The net message is that the book is long risk and long the thing the Fed is trying to cool. The bots that are working this week are working for the same reason, and the ones that are not working are working against the same wind.
Backtest forensics: what the term sheet really says
The 10,000-fold unit error
Start with the headline, a combined profit of $20,261,979 on 223 trades. Bitcoin alone accounts for $20,177,500 of it. The ten Bitcoin trades each moved the price by a few thousand dollars, and the printed P&L per trade is in the millions. A Micro Bitcoin contract is 0.1 bitcoin. The printed profits imply a multiplier of 1,000. The ratio of the two is the error:
Divide the printed P&L by 10⁴ and the Bitcoin backtest is worth about $2,000, not $20 million. The same inflated figure feeds the document’s “average Sharpe”, its 30,405% drawdown, its 13,508% portfolio return in the rules reference, and probably its “95% probability of profit”. The workbook also lists a margin for the Micro Bitcoin contract nine times higher than the term sheet does, which is a second unit inconsistency in the same document family.
The Sharpe ratio that is a t-statistic
For the four bots whose trade lists are printed in full, I re-derived the “Sharpe ratio” from the trade P&Ls. It matches the one-sample t-statistic of the per-trade P&L exactly to three decimals: GC 1.554, ZN 1.050, 6E 0.948, MBT 1.279. For n trades with mean x̄ and sample standard deviation s:
A Sharpe ratio normally annualises mean excess return over volatility of period returns. This number grows with the square root of the trade count, ignores the time between trades, and so is not comparable to any Sharpe in a textbook or a fund factsheet. As a t-statistic it has a meaning: the one-sided p-value is the probability of seeing a mean this good if the true mean were zero. Those are about 0.07 for gold, 0.12 for Bitcoin (corrected), 0.16 for the ten-year note and 0.18 for the euro, and about 0.36 for crude and 0.26 for natural gas using the summary statistics. None clears the usual 5% line. Gold, the best, is close, and it is also the bot whose last four trades were all stops.
The document’s “probability of profit” figures of 79% to 95% are higher than the p-values imply. Converting each p-value into a probability that the true mean is positive, under a flat prior, gives about 93% for gold, 88% for Bitcoin, 82% for the euro, 85% for the ten-year note, 64% for crude and 74% for natural gas. The printed figures are 95%, 95%, 90%, 95%, 79% and 82%, so every printed number is more optimistic than the same data allow.
Bootstrap intervals
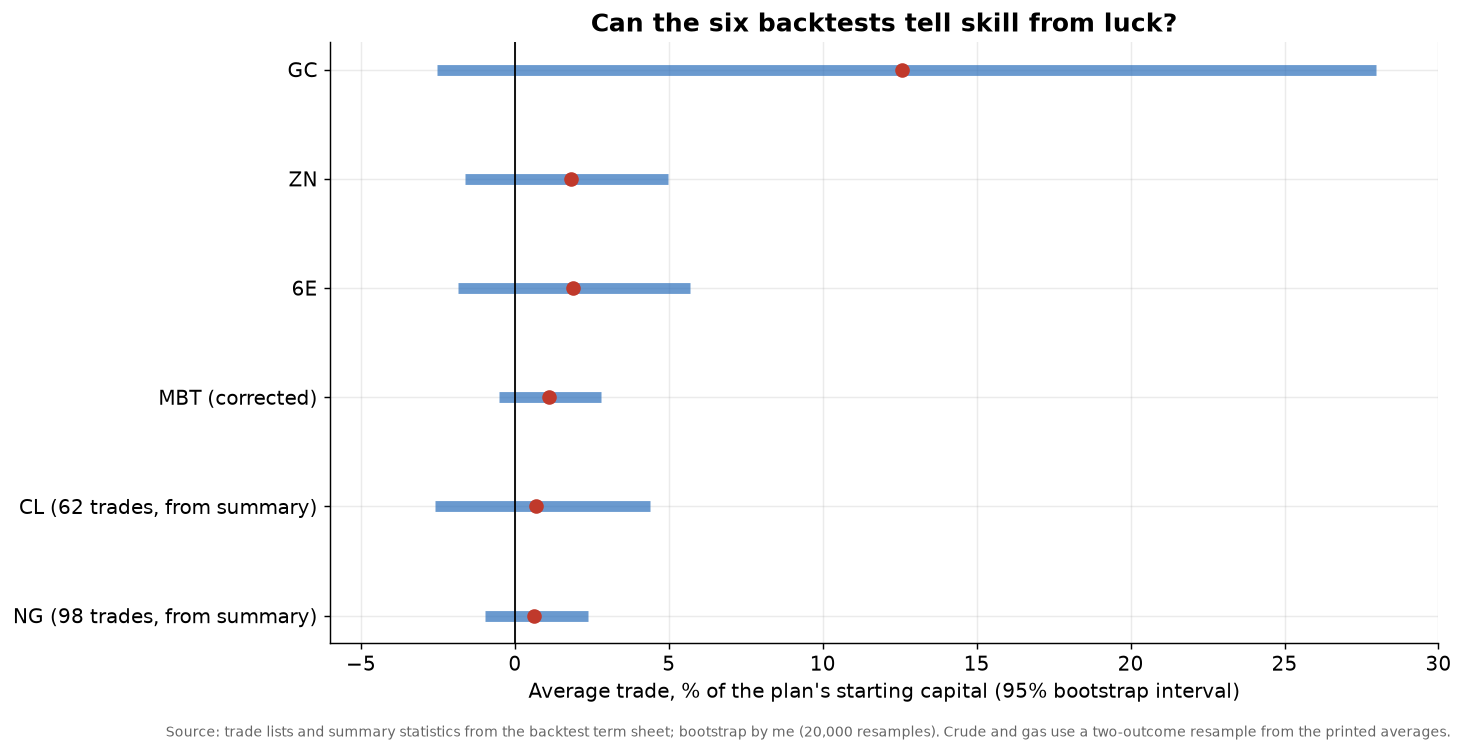
With so few trades, a distribution-free interval is more honest than a normal approximation. Resample the trade P&Ls with replacement B times, compute the mean each time, and take percentiles:
Expressed as a percentage of the plan’s starting capital, the 95% bootstrap interval for the average trade is about −1.6% to +5.0% for the ten-year note, −1.8% to +5.7% for the euro, −0.5% to +2.8% for corrected Bitcoin and −2.5% to +28.0% for gold. Crude and natural gas, whose trade lists I rebuilt only from summary statistics, also straddle zero. Every interval includes zero. In plain English, no bot’s backtest rules out being a coin flip with a good run.
Win rates, expectancy and the Kelly trap
Breakeven analysis is more useful than a Sharpe printed with false confidence. A bot with average win W and average loss L breaks even at a win rate p* = L/(W+L). Gold has a ratio of about 2.1 and breaks even at about 32%; the euro, ratio about 1.8, at about 36%; crude, ratio about 1.9, at about 35% against an achieved 37%; natural gas, ratio about 1.5, at about 39% against 43%; the ten-year note, ratio about 0.93, at about 52% against 65%. The edge over breakeven is thin for crude and natural gas, and breaks down when the recent trades are weighted more.
The Kelly criterion for the growth-optimal bet fraction is:
Computed on these samples, f* is about 31% for gold, 27% for the ten-year note, 31% for Bitcoin and 18% for the euro. Nobody should stake a quarter of capital on 17 trades. The right use of the formula is as a warning: Kelly inputs have sampling error as large as the intervals above, and even a modest overestimate of p produces a big overbet.
Drawdowns larger than the account
The term sheet prints maximum drawdowns of 103% for crude and 105% for natural gas, and 76% for gold. Drawdown is the largest peak-to-trough fall in the equity curve E:
A drawdown above 100% of capital means the account would have been wiped out and then some, at the sizes the backtest assumed. The pipeline’s own rule check flagged this for gold, crude, natural gas and Bitcoin, and then listed them in the “profitable” group anyway, because the sorting key is net profit, not risk.
The last twenty trades
The profit in the crude and gas backtests was earned early. Over the last twenty trades crude lost about $7,200, with 14 stop-outs, and natural gas lost about $9,000, also with 14 stop-outs. Gold’s last four trades were all stops. A strategy with a stable edge does not usually look like that. A strategy fit to an earlier regime does.
Plan versus actual
The workbook’s estimates were written before any test. The plan said an average Sharpe of 1.47, and the term sheet’s average is 0.58. The plan’s average maximum drawdown was 14.1%; the term sheet’s worst is 30,405% and, once Bitcoin is corrected, the next worst is natural gas at 105%. Plan win rates of 51% to 56% for the six bots with trades compare with achieved rates of 37% to 65%, with no consistent direction.
Fix list: what I would change in the process, not the settings
I will keep the bots’ parameters private here, but the structural fixes are generic.
First, fix the units. Every contract multiplier, tick value and margin figure needs a single source of truth shared by the backtester, the capital table and the workbook, and a unit test that compares a one-trade P&L to a hand calculation. Second, stop printing a t-statistic as a Sharpe ratio, or annualise properly using period returns, and attach a confidence interval to every headline number. Third, require a minimum number of trades and a stability check across sub-periods before a bot can enter any “potential” group, and sort by risk-adjusted outcomes that include the drawdown rule, not net profit.
Fourth, resolve contract months programmatically from the current date at launch, and refuse to start on an expired label. Fifth, make the symbol check part of the plan stage so that single-stock bots are not planned for roots the vendor does not carry. Sixth, when a bot’s story depends on a variable, such as basis, storage, the rate differential or the next earnings date, make the variable an input, or drop the story from the label. A carry bot that cannot see carry is a momentum bot. Seventh, reconcile the six passes of the report before turning them into a plan, since the plan inherited the less cautious pass for gold, crude and Bitcoin. Eighth, cap the correlated exposure at the book level, so that two gold bots and a pair of dollar bots are not treated as four ideas.
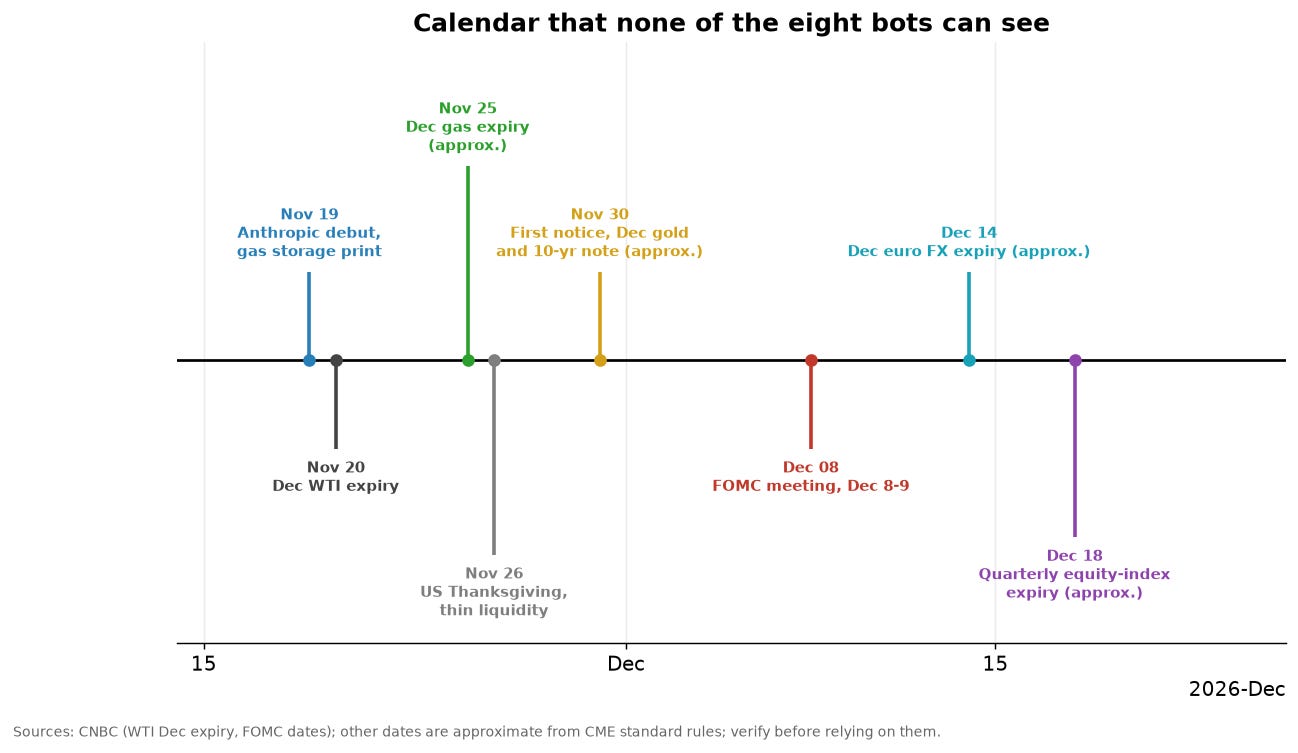
The calendar the bots cannot see
Several dates can move this book before year-end. Anthropic’s first trading day is today. The December WTI contract expires on Friday, November 20, per CNBC. US Thanksgiving on November 26 brings thin liquidity. Approximate dates, which I have not verified against the exchanges and which you should check before relying on them, include the December natural gas expiry around November 25, first notice for December gold and the 10-year note around the end of the month, the December euro futures expiry in mid-December and the quarterly equity-index expiry on December 18. The one date with source backing is the FOMC meeting on December 8 to 9, where CME FedWatch had a quarter-point hike close to fully priced.
Verdict
Run the eight bots through the same questions. Is the label right? Only two are close to it, the ten-year note short and the euro short, which are trend shorts on trending markets. Is the thesis working this week? Four are, Bitcoin, crude, the euro and, barely, the ten-year note. Two are failing, gold and Newmont, and two are flat, natural gas and SpaceX. Did the report endorse the trade? For gold, crude, Bitcoin and natural gas, the report’s own synthesis recommended something different: no long gold, call spreads rather than a crude short, hedged carry rather than a bare short, and call spreads rather than an outright gas long. Is the backtest credible? For none of the eight. One has a 10,000-fold unit error, two have no trades at all, and the six that have trades have intervals that include zero.
The folder sorted six bots into “potential” and three into “loser”, with natural gas in both. My assessment is different. The euro short has the most coherent market logic and the most trustworthy numbers, with the cleanest one-factor exposure and the smallest tail. The ten-year note short is a clean yield bet but unproven. Bitcoin is making money for reasons unrelated to its label. Crude is a coin flip on an unsupported premise. Gold and Newmont are one losing trade, held twice, against the advice of the report that produced them. Natural gas is a fair tape with unhelpful fundamentals. SpaceX and Newmont, the two the folder called losers, are untested rather than proven bad, because the vendor had no data for them.
The practical point is not that automation or AI-written plans are useless. It is that an end-to-end pipeline can write a persuasive 103 pages, and its arithmetic can be wrong by four orders of magnitude without anyone noticing. Read the trade list, check the units, ask what the bot can actually see, and treat every probability printed to the percent with suspicion.
Sources and notes
Market data are daily Yahoo Finance series pulled on November 19, 2026, plus vendor price files from the run folder, used only to cross-check trade prices. Moving averages, RSI readings, volatility figures and regressions are my own standard calculations, not the bots’ settings. Statistical models used: GARCH(1,1) with Student-t innovations, exponentially weighted covariance, principal components, historical VaR and expected shortfall, bootstrap resampling and OLS regression. All backtest figures are simulated, taken from the run’s documents and recomputed where stated.
Secondary-source news used for context, each marked where it appears: CNBC and Reuters (rates, dollar, euro, gold, oil expiry dates, FedWatch probabilities, Waller), the OCBC Daily Treasury Outlook (Fed minutes, fed funds futures, Iran, equities), FXStreet, Reuters and EIA summaries (crude), CoinDesk and other crypto outlets (Bitcoin ETF flows, funding, options), EIA data via FXEmpire and Natural Gas Brief (gas storage and weather), Motley Fool and Investing.com (SpaceX and the Anthropic contract), Newsquawk and the Guardian (Anthropic IPO), and Investor’s Business Daily, Yahoo Finance and Seeking Alpha (Newmont). I did not verify these at the primary source.
This is educational analysis, not investment advice. It does not describe any live trading by the author. Futures, options and single-stock futures are leveraged and can lose more than the amount invested.